 |
| About Bioline | All Journals | Testimonials | Membership | News |
|
||||||
|
||||||
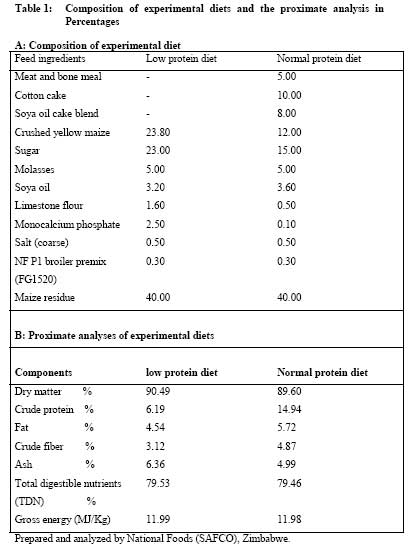
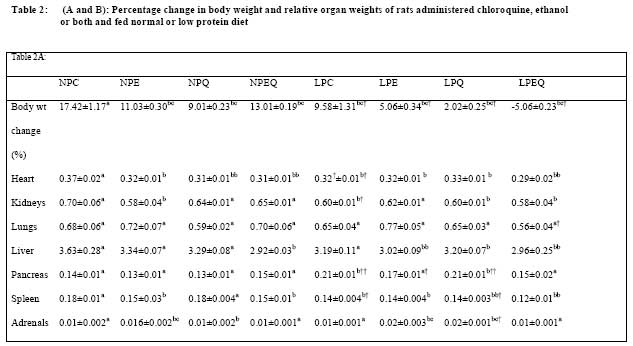
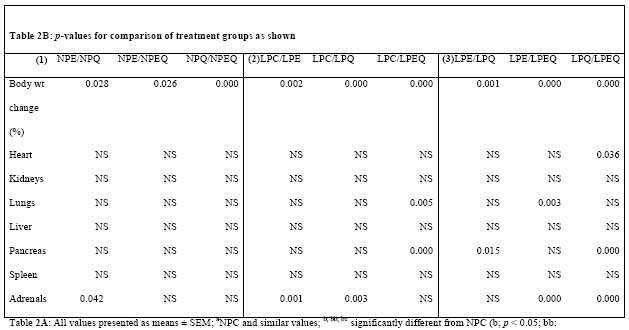
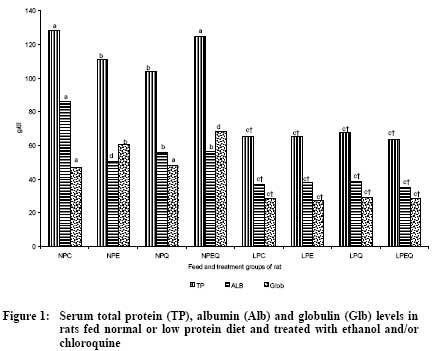
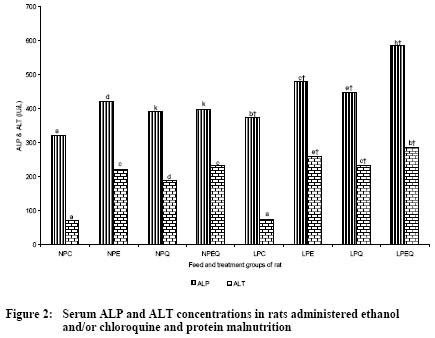
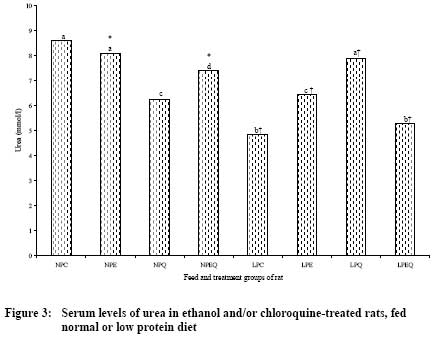
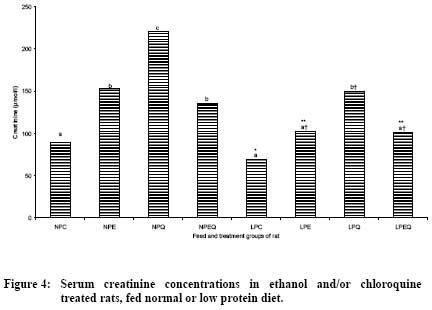
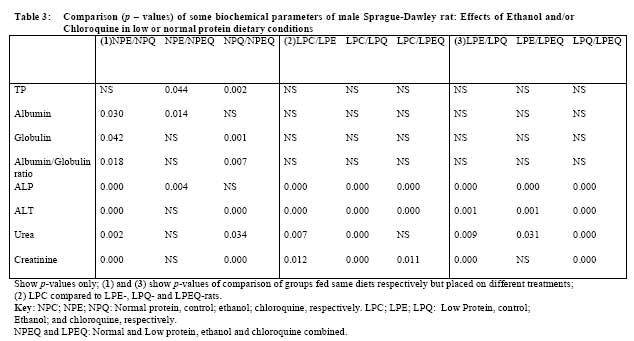
African Journal of Food Agriculture, Nutrition and Development, Vol. 9, No. 5, May, 2009, pp. 1226-1244 Article Effects of ethanol and/or chloroquine with low protein dietary intake on some biochemical parameters in male rats Mbajiorgu EF, Vlok W, Aire TA, Alberts M Department of Human Anatomy and Histology, School of Medicine, University of Limpopo, Private Bag, X1106, Sovenga 0727, Limpopo Province Correspondence Address:Department of Human Anatomy and Histology, School of Medicine, University of Limpopo, Private Bag, X1106, Sovenga 0727, Limpopo Province ejifun@gmail.com Code Number: nd09057 Abstract In malaria-endemic developing countries, plagued with malnutrition, patients undergoing chloroquine (Q) treatment on prolonged basis often consume ethanol (E) regularly. This may constitute a serious health problem. The objective of this study was to investigate whether concurrent administration of E and Q under conditions of protein malnutrition may impact negatively on biochemical parameters. An experimental study was conducted to investigate biochemical effects of E and/or Q associated with protein malnutrition in adult male Sprague Dawley rats. Two groups of adult male Sprague-Dawley rats were fed either normal protein diet (NP, 15%) or low protein diet (LP, 6%). Each diet group includes the controls (NPC, LPC), chloroquine- (Q); [NPQ; LPQ], ethanol- (E); [NPE; LPE} or both chloroquinine and ethanol (NPEQ; LPEQ) treated groups. Chloroquine diphosphate (10mg, kg -1 body weight per rat) was administered intramuscularly, on days 0, 10, 20, and 30 to appropriate groups, while 6% E in drinking water was provided ad libitum to E-treated groups. Drinking water was given to Q-treated groups, and physiological saline was injected to E-treated groups. After 40 days, b lood was collected, under ether anesthesia, by cardiac puncture for biochemical analysis. Results showed that concurrent treatment of E and Q slightly decreased TP and albumin (Alb) levels in LPEQ-rats compared to LPC, LPE and LPQ rat groups. Furthermore, TP level was substantially and significantly elevated in NPEQ-rats compared to LPEQ, NPE and NPQ rat groups. Ethanol and Chloroquine interaction exacerbated ALP and ALT activities in LPEQ-rats compared to NPEQ- rats. Urea depression was enhanced in LPEQ- than in NPEQ-rats. Creatinine levels were increased in all treatment groups. The results suggest increased toxic effect of concurrent intake of E and Q in LP- fed rats. The findings show that LP dietary intake potentiates adverse effects of combined E and Q. This has implications for clinical practice, especially in poor malaria endemic countries where prevalence of protein malnutrition is often high, and patients who consume alcohol while on chloroquine, are at greater risk of severe toxic effect of combined E and Q intake.Keywords: ethanol, chloroquine, biochemical-indices, rats, malnutrition Introduction Chloroquine (Q) remains the drug of choice for treatment of malaria in malaria-endemic developing countries primarily because it is cheap and readily available [1] . In western Uganda, for example, misuse/abuse of drugs such as Q through self medication represents 87.2 - 94.6% of drug use [2] . In these poor settings, with malaria endemicity, individuals / patients on Q, for treatment of malaria or rheumatoid arthritis, often consume alcohol (ethanol; E) regularly [3] . Hence, because of widespread poverty and malnutrition [4] , intake of Q and E concurrently with protein deficient diets is not uncommon. This may constitute a serious health problem. Studies have shown that chloroquine (Q), a 4-aminoquinoline drug, affects a wide range of biochemical processes, including the inhibition of key metabolic enzymes such as alcohol dehydrogenase, succinate dehydrogenase and glucose 6-phosphate dehydrogenase [5],[6] . Ethanol (E) interferes with several metabolic pathways, resulting in derangements in protein, carbohydrate and lipid metabolism during its oxidation in the body [7] . It also affects renal function by decreasing glomerular filtration rate, aldosterone synthesis and alteration of kidney structure [8] . Concurrent administration of Q with other drugs (such as didanosine, hydroxyurea, mepacrine among others), has been shown to either potentiate or attenuate the effects of the drugs [8],[9],[10] . Effects of E alone, and in combination with other drugs has been reported [7],[3] . However, only one study has reported the effect of concurrent intake of E and Q, on heamatological parameters [8] . This study focused on select biochemical changes associated with intake of E and/or Q with protein malnutrition. Materials and Methods Rats Adult male Sprague-Dawley rats between 3 and 4 months old were used in the study. The rats were bred and housed at the Animal House, Faculty of Medical Sciences, University of Zimbabwe. The rats were housed in cages and maintained on a 12-hour light / 12-hour dark regimen. The rat cages had pervious floors which permitted faeces and urine to pass into a lower compartment filled with sawdust preventing any contamination of the rats. Experimental Design The rats were randomly assigned to two major groups based on their dietary protein level: Normal protein diet (NP, 15%) and low protein diet (LP, 6%) groups - see [Table - 1] for composition and proximate analysis of the feed. Each diet group of rats was further sub-divided into four sub-groups that served as controls or received chloroquine (Q) or ethanol (E) or both chloroquine diphosphate and ethanol (EQ) for 40 days. The treatment groups (with about five-seven rats each) were thus identified as controls on normal protein (NPC) or low protein (LPC), rats given chloroquine only whilst on normal protein (NPQ) or low protein (LPQ), rats on ethanol treatment only whilst on normal protein (NPE) or low protein (LPE) and rats on both ethanol and chloroquine treatment whilst on normal protein NPEQ) or low protein (LPEQ). Chloroquine (10mg,kg -1 body weight per rat) was administered intramuscularly, on days 0, 10, 20, and 30 to the NPQ, LPQ, NPEQ and LPEQ groups while 6% E in drinking water was provided ad libitum to the NPE, LPE, NPEQ and LPEQ groups, as reported by Akingbemi and Aire [11] . Drinking water, being the vehicle for E, was given to the groups on only Q treatment (NPQ; LPQ). A volume of physiological saline, the vehicle for Q, equivalent to Q injected rats, was injected to the groups receiving only E (NPE; LPE). After 40 days of treatment, the rats were weighed and deeply anaesthetized with ether. Blood was collected by cardiac puncture into appropriately labeled sterile tubes containing K-EDTA. The rats were then sacrificed by anaesthetic overdose. Biochemical Analyses The activities of serum alkaline phosphatase (ALP) and alanine aminotransferase (ALT) and the concentrations of total protein, albumin, creatinine, and urea were determined on an autoanalyser (Electro-Nucleonics Inc., Altaire T m , New Jersey, U.S.A.). Serum globulin was derived as the difference between the total protein and albumin. Enzyme activity was determined at 37 o C. All reagent kits were obtained from Schiapparelli Biosystems, New Jersey. Organ weights The wet weight of the heart, kidneys, lungs, liver, pancreas, spleen and adrenals, obtained on a mettler analytical balance, (PE 1600, Mettler Instrument AG; Switzerland) were expressed as proportions (%) of the body weight, for the purpose of comparison. Data presentation and statistical analysis The descriptive statistical analysis was done using SPSS 12.0 for windows. Values are presented as means ± SEM. All the treated groups were compared with the controls. The nutritional effect was assessed by comparing the groups with similar treatment but placed on different diets. Student′s t -test was used to test for differences in all the comparisons. A value of p < 0.05 was considered significant. Ethical consideration Ethical clearance for this study was obtained from the Ministry of Agriculture, Zimbabwe, as stipulated in the Scientific Animal Experiment Act, 1963. The University of Limpopo ethical committee also approved the project. Results General FindingsAll animals were in good bodily condition throughout the experiment. There were no unplanned deaths recorded. Feed and fluid intake increased marginally in all the groups during the experiment, but slight decreases were recorded in NPEQ, LPE, and LPEQ groups in the last 7 days before sacrifice. At sacrifice, NPEQ, LPE and LPEQ rats showed some fatty infiltration of the liver. Organ weights The relative organ weights were as shown in [Table 2A] and [Table 2B]. Protein malnutrition, ethanol and/or chloroquine administration caused decreases in body weight which were significant in all the groups compared with NPC-rats [Table 2A]. The LPEQ rats had actually lost some weight. The relative sizes of the heart were significantly reduced in all groups compared with NPC-rats [Table 2A], but not among the LP-fed rats [Table 2B]. The kidney sizes decreased significantly in NPE; LPC; LPQ and LPEQ rats. The relative weight of the liver was significantly reduced in NPEQ, LPE, LPQ ( P = 0.05) and LPEQ rats and the spleen in NPE and NPEQ rats and also in LPC, LPE, LPQ and LPEQ ( p < 0.05) rats [Table 2A]. The relative weight of the pancreas was increased significantly in LPC and LPQ rats and the adrenal gland was enlarged in NPE, LPE and LPQ rats ( P < 0.05), [Table 2A] and [Table 2B]. A greater decrease in relative organ weights (heart, lungs, pancreas and adrenals) in LPEQ rats compared to either LPE or LPQ rats [Table 2B]. Serum Biochemistry The biochemical parameters are presented in [Figure - 1], [Figure - 2], [Figure - 3], [Figure - 4] and [Table - 3]. Total protein (TP) decreased significantly in NPE and NPQ, but with no significant changes in LPE, LPQ, LPEQ and NPEQ rats in comparison with the control groups ([Figure - 1]; [Table - 3]). Albumin (Alb) was significantly reduced in NPE, NPQ and NPEQ rats. Globulin (Glb) was significantly increased in NPE and NPEQ groups in comparison with the control rats [Figure - 1]. The ALP and ALT activities increased significantly in all the treated groups when compared with the control groups [Figure - 2]. Ethanol (more than Q) significantly increased ALP and ALT activities in both dietary regimens ([Table - 3]; [Figure - 2]). Both ALP and ALT activities were elevated ( p < 0.05) in LP- than in NP- rat groups. The ALP activity in NPEQ group was slightly above the level in NPQ rats, but below the level in NPE rats ( p < 0.05). In LPEQ group, ALP activity was increased above the levels in LPE and LPQ groups ( p < 0.05). The activity of ALT was significantly elevated in NPEQ- and LPEQ-rats relative to NPQ, NPE and LPQ, LPE groups respectively [Figure - 2]. Urea was reduced in NPQ and NPEQ rats ( p < 0.05) compared to control rats ([Figure - 3]; [Table - 3]). In LPE and LPQ rats, urea level was increased compared to LPC rats ( p < 0.05) [Table - 3]. Urea level was higher in NP- than in LP-treated groups ( p < 0.05). Urea level in NPEQ rats was reduced to a level between the levels in NPE and NPQ rats, while in LPEQ rats; urea level was lower than the levels in LPE and LPQ rats [Figure - 3]. In NPQ rats, urea was reduced compared to NPE and NPEQ groups ( p < 0.05), and also in LPE- compared to LPQ group ( p < 0.05) ([Figure - 3]; [Table - 3]). Creatinine increased in all the groups in comparison with the control groups ( p < 0.05) [Figure - 4]. In NPEQ rats, creatinine was reduced below the levels in NPE and NPQ rats ( p < 0.05) ([Figure - 4]; [Table - 3]). In LPEQ-rats, it was reduced below the level in LPQ rats ( p < 0.05). Chloroquine (more than E) increased creatinine levels in both dietary groups ( p < 0.05) [Figure - 4]. Discussion This study explored the effect of concurrent intake of Q and E under protein malnourished dietary status. Concurrent presence of E and Q in the body may either be due to misuse/abuse of these drugs, individual habits and/or disease conditions. Adopted experimental design is typical of prevalent conditions in malaria-endemic and often impoverished, developing countries. Two levels of controls (normal and low protein controls, NPC, LPC) were employed so as to determine the combined effects of E and Q associated with protein malnutrition. Though some overlapping effects might still be obscured, loss of body weight, and decrease in relative organ weights (heart, liver, spleen and pancreas) in LPEQ- treated rats, show that malnutrition can enhance adverse effect of combined intake of E and Q. Levels of TP and Alb were slightly lower in LPEQ- treated rats than in LPC, LPE and LPQ - treated rats. This suggests greater adverse effect of combined E and Q in LPEQ- treated rats. On the other hand, higher TP level in NPEQ-treated rats compared to levels in NPE- and NPQ- treated rats and also to LPEQ-treated rats suggests that NP-dietary intake may ameliorate adverse effects of combined intake of E and Q. Differences in amino acid concentration of the two diets may account for the general increases in TP, Alb and Glb levels in NP-treated groups suggesting beneficial effects of NP- dietary intake in concurrent E and Q presence in the body. Normal protein intake can increase metabolism and excretion of E and Q, leading to reduction in their individual toxicity and increased TP level in NPEQ- treated rats [12] . Previous studies have demonstrated that nutritional status may modulate adverse effect of combined presence of E and Q [13],[14] . I nhibition of protein synthesis by E and Q may account for the decreased TP and Alb levels in NPE- and NPQ- treated rats compared to control rats. This is consistent with the findings in earlier reports [15],[16],[17],[18] . Furthermore, ALT and ALP levels were higher in LP-groups compared to NP-groups. Previous studies have shown that increase in ALT and ALP activities are indicative of hepatic dysfunction [11],[19] . Increase of ALP activities is also associated with cholestatic lesions [20] . Higher elevations of ALT and ALP activities amongst the LP-groups suggest greater hepatic damage in LP- groups. Furthermore, also suggesting that consistent intake of diets high in protein content may ameliorate the adverse effects of combined E and Q intake. Low serum urea in LPC rats is consistent with findings of previous studies [14],[21] . Significant depression of urea level in NPQ- and slightly in NPE- rats suggests impairment of the ability of the liver to deaminate proteins by Q and E in NP- diet; serum urea is a product of protein degradation by the liver. On the other hand increased urea levels in LPE and LPQ suggests altered kidney function [8] . Renal effects of E and Q leading to increased urea level have previously been reported [22],[23] . Though, the present study did not include analysis of liver iron content, it has been demonstrated in a previous study that low protein diets increase liver iron content [24] which in turn may enhance E hepatotoxicity [25],[26] . This may explain the depression in urea level in LPEQ-treated rats compared to NPEQ-treated rats. Hepatotoxicity and associated renal dysfunction may account for the different urea levels in LPEQ- and NPEQ- treated rats. Additionally, increased serum creatinine levels in E and/or Q treatments, an indication of alterated renal function, is consitent with previous findings [23] . Lower creatinine levels in NPEQ- and LPEQ- rat groups (compared to NPE-, NPQ- rat groups and LPE- , LPQ- rat groups respectively) suggest reduction in adverse effects probably due to interaction between E and Q in the liver. However, higher creatinine level in LPEQ- than in NPEQ- rat groups suggests greater toxic effect of concurrent presence of E and Q in LPEQ rats. Conclusion Overall, findings suggest that adequate and consistent intake of diets high in protein content may ameliorate toxic effect of concurrent intake of E and Q, and inadequate protein dietary intake may enhance the toxic effects. This has clinical implications for malaria endemic developing countries where protein deficient diets, misuse/abuse of chloroquine through self-medication and alcohol use is common. Alcohol users and/or individuals undergoing Q treatment on a prolonged basis may need closer supervision for potential serious adverse effects. Further, protein supplementation may be advisable for these individuals to ameliorate the potential serious adverse effect of combined E and Q intake. Acknowledgement We acknowledge with thanks the help of the Department of Anatomy, Universities of Zimbabwe and Limpopo, for the use of the laboratory facilities, and the laboratory staff for their assistance in this study. References
Copyright 2009 - African Journal of Food Agriculture, Nutrition and Development The following images related to this document are available:Photo images[nd09057f2.jpg] [nd09057f4.jpg] [nd09057t2a.jpg] [nd09057t1.jpg] [nd09057t2b.jpg] [nd09057t3.jpg] [nd09057f1.jpg] [nd09057f3.jpg] |
| |||||||||
