 |
| About Bioline | All Journals | Testimonials | Membership | News |
|
||||||
|
||||||
African Journal of Food Agriculture Nutrition and Development, Vol. 9, No. 6, Sept, 2009, pp. 1309-1324 The Contribution Of African Leafy Vegetables (ALVS) To Vitamin A Intake And The Influence Of Income In Rural Kenya Oiye SO*1,2 , Shiundu KM1 and RK Oniang’o1 *Corresponding Author
email: oiyeshad@gmail.com,
oiyes@yahoo.com Code Number: nd09064 ABSTRACT Despite the increased recognition of African Leafy Vegetables (ALVs) as important source of vitamin A, there is still paucity of research highlighting on the vitamin A intake attributed to them. The level and the extent of contribution of ALVs could inform programming, monitoring and evaluation of vitamin A-related nutrition and development programs. The study aimed at investigating the level of contribution of ALVs to household vitamin A intake and the influence of household monthly income in a rural setting, through use of selected data from a cross-sectional vitamin A consumption survey in Butere-Mumias District, western Kenya. A multistage cluster sampling procedure was used to select 814 households considered for the survey. It was found that plant sources contributed about 43.1% of total household vitamin A intake. ALVs contributed 65.7% of vitamin A from plant sources and 32.7 % of household vitamin A intake. Predominant ALV was the cowpea leaves which accounted for about 45% of vitamin A contributed by ALVs, 34% of the contribution of plant sources and 14.7% of household vitamin A intake. Although the influence of monthly income on the level of vitamin A from ALVs was not conclusive, there were some indications that lower intake from ALVs was positively correlated with lower incomes and vice versa. Income was weakly and negatively associated with household vitamin A intake (r=-1.92, 3.7% of variance explained), and the opposite was true for the proportion of income spent on food verses household vitamin A intake (r=1.64, 2.7% of variance explained). It was apparent that ALVs formed an important dietary source of vitamin A in rural households in western Kenya with cowpea leaves as a predominant contributor. In areas of similar environmental conditions, ALVs production, marketing and consumption should be promoted. There was no evidence that increase in income among the rural folk may likely improve ALVs consumption and vitamin A intake. It is thus recommended that development programs and policies consider ALVs as significant source of vitamin A, and that increments in incomes per se may not significantly influence household vitamin A intake and from ALVs. Key words: African Leafy Vegetables, Vitamin A, Income INTRODUCTION Vitamin A deficiency is still a public health problem especially in sub-Sahara Africa and South-East Asia, effecting mostly young children and pregnant mothers in low-income countries [1]. In Kenya, Vitamin A deficiency has been documented in 11 districts [2]. World Health Organization (WHO) has also listed Kenya among the 72 countries in the world suspected to have low serum retinol levels [3]. The past demographic surveys show Vitamin A deficiency nationally to be at all-time high at 76 percent [4]. The relationship between vitamin A consumption and blindness is currently well established. Supplementary trials have also revealed the association between vitamin A and reduced morbidity and mortality [5]. As a method to combat vitamin A deficiency, vitamin A supplementation began in Kenya several years ago and is continuing. However, there has been a realization that one of the most effective and sustainable way to overcome vitamin A deficiency is through food-based strategies, which, with time, are able to build into, and become part of the existing dietary systems [6]. Food fortification is often touted as the most promising short- to medium-term strategy for combating micronutrient deficiency [7]. However, even the smallest price increase attributed to fortification tends to discourage the poorest who also are the neediest in this case [8]. Further, despite the appealing nature of fortification, its progress has been slow [8]. Dietary diversification is one of food-based intervention that is deemed feasible in Africa [9]. Though the main source of vitamin A is the animal source foods, plant sources represent more than 80% of total food intake of vitamin A in sub-Saharan Africa because of their low-cost, high availability and diversity [9]. Fruits, roots, tubers and leafy vegetables are the main providers of provitamin A carotenoids. Due to their availability and affordability, green leafy vegetables are largely consumed by the poor populations, but their pro-vitamin A activity has been proven to be less (12µg of β-carotene for 1µg of retinol) [10] than previously assumed (6µg of β-carotene for 1µg of retinol) [11]. It is now acknowledged that coloured fruits and cooked yellow tubers are much more efficiently converted to vitamin A than equal amounts of dark-green leafy vegetables [12]. The comparatively low pro-vitamin A activity in ALVs should not be a factor in diminishing the role of these crops in current and future efforts to address vitamin A deficiency. The critical issue is to broaden the strategy, to progressively include diverse plant materials that would synergize and subsequently, hasten the reduction of VAD globally. In many rural communities in Africa, consumption of indigenous green African Leafy Vegetables (ALVs) is common, though decreasing as ‘exotic’ vegetables, which are more affordable, more available throughout the year, but relatively poor in provitamin A content gain currency. In the recent past, ALVs were associated with low-class people hence they were considered to be food for the poor. These misconceptions still linger in some places in Africa and will take time to change. Most ALVs are much superior to common ‘exotic’ or commercially produced vegetables in Kenya (kales and cabbages) in β-carotene and other vitamin and mineral contents. Increasing the consumption of ALVs and possibly substituting for kales and cabbages in Kenya can go a long way in improving vitamin A intake. Using this as the basis, there are a number of programs in Kenya that have attempted to increase the consumption of ALVs in the effort to increase micronutrient intake both in the rural and urban areas. In the high agricultural potential rural areas, promotion and support of production, post-harvest processing, marketing and consumption of ALVs has been encouraged. In the urban areas there is emphasis on dietary diversification and efforts to embrace traditional foods including ALVs in diets. This has mainly been to curb the rise of non-communicable diseases related to the urban dietary practices. Against these efforts, there is still paucity of demonstrated evidence on the contribution of ALVs to vitamin A supply – besides lack of evidence for the contribution of plant-based foods in general. As such, it has been difficult to evaluate the impact of or potential nutritional benefits of many rural-based programs which attempt to improve vitamin A intake through increased production, marketing and consumption of ALVs. This paper thus utilized extracted data from a vitamin A survey conducted to estimate the contribution of African Leafy Vegetables to household vitamin A intake in Butere-Mumias district, Western Kenya. Some results from the same survey can be found in Shiundu et al. [8]. The paper also aimed to analyze the association between household vitamin A intake (and vitamin A from ALVs) and household economic status as indicated by household monthly income and proportion of income spent on food. METHODOLOGY Sampling and sample size The study area (Butere-Mumias District) is in the Lake Region and experiences 2 rainy seasons: the short rains between August and November and the long rains between late February and June. Two divisions in the district were randomly selected as representative of divisions where the ALVs were being promoted (Butere) and where there was no promotion (Khwisero). Eight hundred and seventeen (402 in Butere division and 412 in Khwisero division) households with children 12-71 months were selected using a multistage cluster sampling procedure, the most popular and practical way of sampling the population at risk of vitamin A deficiency [13]. The 24-hour recall was targeted on approximately 20% of the households (141 households after attrition due to data incoherence), randomly selected out of the 814 considered for the household survey. About 44 ALVs farmers (22 from each division) not involved the household survey were also randomly selected (2 from each village) and asked to cook selected vitamin A-rich foods from their farms for β-carotene analysis. General household survey and food frequency A food frequency checklist questionnaire adapted from Hellen Keller International (HKI) food frequency questionnaire was administered to the 814 households selected. The respondents were the mothers who were questioned on how often the households ate pre-listed foods in the past 7 days. Before administering the food frequency questionnaire, food items that are rich in vitamin A content and were available in the locality were identified through qualitative market surveys and group discussions. However, vitamin A rich foods in the HKI frequency list (compulsory ones) were included in the food frequency questionnaire even if some of these foods were not commonly available locally. Twenty four-hour analysis Caregivers (mothers) were asked about their household food intake. All food consumed from getting up to going down to sleep were recorded in order to assess the amounts consumed accurately. To estimate the household vitamin A intake, food composition tables prepared by Sehmi (1993) were considered [14] except for the analyzed ALVs where laboratory results from β-carotene analysis were used. Retinol equivalents were calculated by dividing the β-carotene content by 12 (β-carotene-retinol conversion rate of 12:1) as recommended by Institute of Medicine [10]. To standardize and estimate household vitamin A intake, total daily vitamin A consumed in the household was divided by the number of household members and presented in microgram Retinol Equivalents per person per day (µRE/p/d). Analysis of β-carotene content in foods Edible portions of plant foods commonly consumed in the area and rich in vitamin A as indicated by the results of household survey were analyzed for β-carotene content. Each farmer was instructed to harvest a particular crop from his/her respective farm and prepare (cook) the edible portions in the usual way known to them without any standard instructions given. For each division, it was ensured that one food item was prepared by 2 farmers. Thus for every food item, 4 samples were obtained (two from each division). They were transported in cool boxes immediately to Nairobi, about 400km away for β-carotene analysis at the Nairobi University Food Laboratories. β-carotene content was analyzed using a High Performance Liquid Chromatography (HPLC). For each sample, the analysis was done in triplicates. The β-carotene content of the 4 separate samples were averaged to give the mean β-carotene content of respective food item. Food considered for analysis were kales (Brasica oleracea var acephala), cowpea leaves (Vigna unguiculata), African vegetable nightshade (Solanum spp), pumpkin leaves (Cucurbita maxima), jute mallow (Corchorus olitorius), Spider plant (Cleome gynadra), slenderleaf (Crotalarias ochroleuca), amaranths (Amaruthus lividus), orange–fleshed sweet potatoe (Ipomea butatus) and Ethiopian kales (Brassica carinata). Data analysis Means and percentages were
calculated for socio-economic data, vitamin A content of food, food frequency
and household vitamin A intake. For household vitamin A intake, student’s
t-test was also used to compare the vitamin A intakes for household with a
monthly income below Kenya Shillings 2400 (~ RESULTS Key
socio-economic characteristics Table 1 depicts the
socio-economic characteristics of the households interviewed in Butere and
Khwisero divisions. On average, each household had about 5 members. The male
gender was the predominant household head, averaged about 37 years old and
mostly had attained primary school as the highest level of education. Own
farming and casual labour were the leading sources of income for the households
with the latter predominant in Khwisero division and former in Butere division.
Butere division is comparatively a more sugarcane growing area than Khwisero
and many families there depend on casual work in the sugarcane farms to
supplement their subsistence farming. On average, about two-thirds of the total
household income was spent on food. Among other food crops, about 86% of
households grew ALVs on their farms and a high proportion of households grew
the ALVs in Butere than in Khwisero divisions. On average in the two divisions,
of the 43.8 kg of ALVs produced per household in the year preceding the survey,
26% was sold. Table 1: Socio-economic indicators of the study group Indicator Butere n=402 Khwisero n=412 Aggregate (n=814) P-value Average
household size 5.61 5.33 5.50 0.132 Household
head (% female) 7.40 6.30 6.90 Average
age of the household head (years) 38.54 36.04 37.28 0.002 Most
common highest level of education of the household head Primary (60.20%) Primary (56.80%) Primary (58.60%) Predominant
source of income Casual labour (29.90%) Subsistence (42.70%) Subsistence farming (35.60%), Average
household income per month in Kshs (US$) 3890 (~US$48.60) 4730 (~US$59.12) 4314 (~US$54.00) 0.00001 Income
spent on food in Kshs (% spent of food) 2543 (65.37) 2593 (54.82) 2568 (59.52) 0.653 Percentage
who grew ALVs in the preceding year 92.59 79.9 85.90 Percent
who sold ALVs in the preceding year 38.30 9.50 54.60 Average
ALVs production in the preceding the survey year per household in Kg 64.38 23.70 43.87 0.000 Average
ALVs sold in the preceding year preceding the survey per household (% sold
out of produced) 18.55 (28.8) 4.31 (18.86) 11.37 (25.91) 0.000 Food
frequency of selected vitamin A rich foods The HKI-modified 7-day food frequency used considered
foods rich in vitamin A as presented in Table 2. ALVs (as a group) recorded the
highest mean frequency, an indication that they were highly consumed (on
average, 5 times a week) as compared to other foods listed. Almost all
households (98.8%) consumed it at least once a week. This could be an
indication that ALVs are comparatively easily available and are important
source of vitamin A in the study area. Other highly consumed vitamin A sources
were kales, mangoes, eggs, papaya, sweet potatoes and fish, which were consumed
at least once a week on average. Carrots, pumpkin fruit, butter, liver,
cod-liver oil (Scots emulsion) were not highly consumed (less than once a
week). Red palm oil was not consumed at all in the study area. Palm oil is
rarely consumed in Kenya. Vitamin A rich foods highly consumed at least once a
week by households were ALVs (98.8%), kales (95.8%), cooking oil and fat
(75.3%) and fish (82.8%). Table 2: 7-day food frequency vitamin A rich foods Food
item Mean
frequency (n=814) (±SD) Percent
households that consumed the food at least once a week ALVs 5.22±1.72 98.8 Kales 2.82±1.52 95.8 Cooking
oil and fat 1.85±1.80 75.3 Fish 1.72±1.35 82.8 Papaya 1.34±1.73 65.1 Mango 1.22±1.43 62.8 Egg 1.16±1.26 67.9 Sweet
potatoes 1.06±1.24 61 Margarine
(bread spread) 0.8±1.55 33.5 Pumpkin
fruit 0.34±0.70 24 Cod
liver 0.25±1.17 6.1 Scots
emulsion. emulsion 0.17±0.93 5.1 Liver 0.12±0.55 7.5 Carrots 0.12±0.48 3.8 Butter 0.05±0.33 3.2 Red
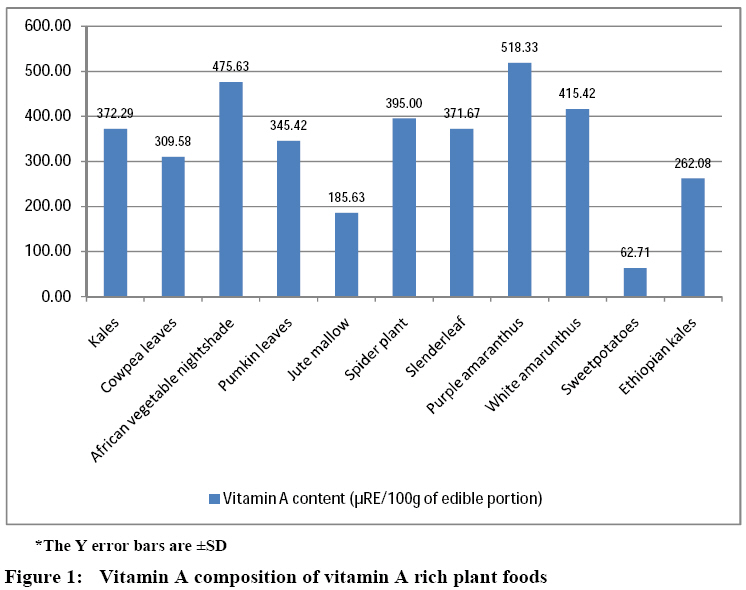
palm oil 0.00±0.00 0 Vitamin A content of ALVs Figure 1 depicts the vitamin A
content of foods analyzed. Amaranths, African vegetable nightshade and spider
plant were found to have high retinol equivalents after cooking. However,
purple amaranths had the highest vitamin A content (518.33 µgRE). Kales,
cowpeas leaves, sunhemp, and Ethiopian kales had relatively medium vitamin
content, while jute mallow and orange-fleshed sweet potato had least vitamin A
content with the latter having the lowest of all the analyzed foods. The values
presented in Figure 1 did not closely compare with those already published in Kenya [12, 13]. The values presented in Figure 1 were used for computing vitamin A intake
for ALVs. Contribution
of ALVs to the vitamin A intake ALVs as a group contributed 239.3 µgRE/p/d (Table 3),
which accounted for 32.7% of the total vitamin A intake. There was no
statistical significant difference in vitamin A intake from ALVs between
households who earned less than and more than US$1 a day (p>0.05) and this
implies that income was a minor or insignificant determinant of vitamin A
consumption from ALVs. However, as depicted by odds ratio (>1), vitamin A
intake from ALVs below general average (239.3 µgRE/p/d) was more likely in
low-income ( Table 3: Household vitamin A intake from food groups Vitamin A intake per person per day in µg Retinol
Equivalents (µg RE/p/d)† Food
group Income levels >US$ 1 per day (n=109) P-value* Average Odds ratio§ African
Leafy Vegetables 230.50 241.95 0.870 239.32 1.108 Other
vegetables (kales and cabbages) 43.17 51.34 0.378 49.46 1.256 Fruits 18.21 18.71 0.956 18.59 1.468 Roots
and tubers 6.38 8.32 0.925 7.88 0.686 Cereals,
pulses and nuts 0.11 0.21 0.309 0.19 2.171 Eggs 0.00035 0.00012 0.611 0.00017 0.271 Fats
and Oils 351.78 401.33 0.351 389.95 0.650 Milk 4.54 4.46 0.919 4.48 0.624 Fermented
milk 0.00 0.75 0.454 0.58 0 Meat‡ 18.44 21.77 0.724 21.00 0.278 Total 673.12 748.84 731.45 † Total household vitamin A supply
divided by total number of household members Table 4: Household vitamin A intake from ALVs Vegetables Vitamin A intake (µRE per person) As a % of vitamin A from ALVs % contribution to total vitamin A intake Jute
mallow 8.11 3.39 1.11 African
vegetable nightshade 19.10 7.98 2.61 Spider
plant 3.96 1.65 0.54 Slenderleaf 38.10 15.92 5.21 Pumpkin
leaves 38.77 16.20 5.30 Cowpea
leaves 107.20 44.80 14.66 Amaranths 24.07 10.06 3.29 Apart from ALVs, another significant, and evidently
the highest contributor to vitamin A intake was the fats and oil. These were
the fortified cooking fat and oils, and margarine (spread). They accounted for
about 53.3% of total vitamin A intake per adult person. It did not appear as if
the higher the income, the higher the fats and oils consumption (p>0.05).
However, odds ratio indicated that households with incomes above US$1 were likely
to consume vitamin A amounts (from fats and oils) above the general average
(390 µgRE/p/d). Other foods that were likely to be consumed in households of
higher incomes than lower, were eggs, milk and meat (Odds ration<1). These
animal source foods are considered by rural dwellers as expensive or are
associated with the affluent. Following fats and oils, ALVs, other vegetables
(kales and cabbages) and fruits (in that order) were found to be the next most
important sources of vitamin A. Income and vitamin A intake
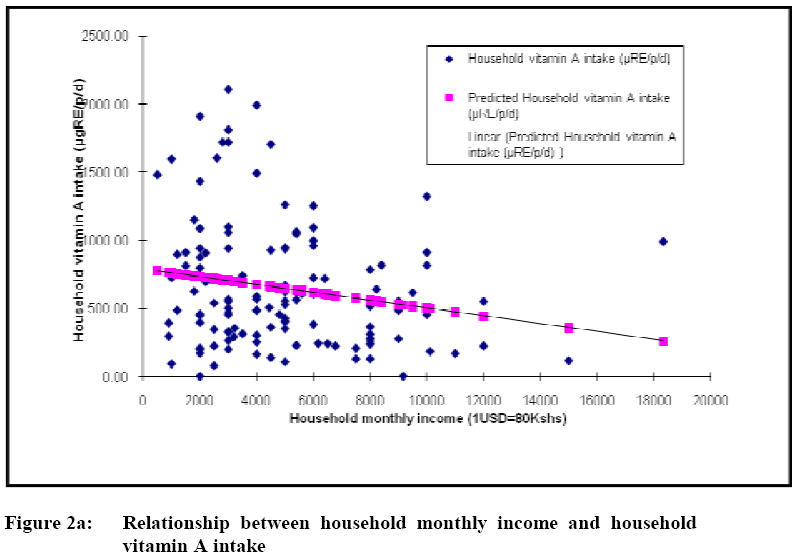
The general trend was that the
more a household earns per month, the less the vitamin A intake (Figure 2a).
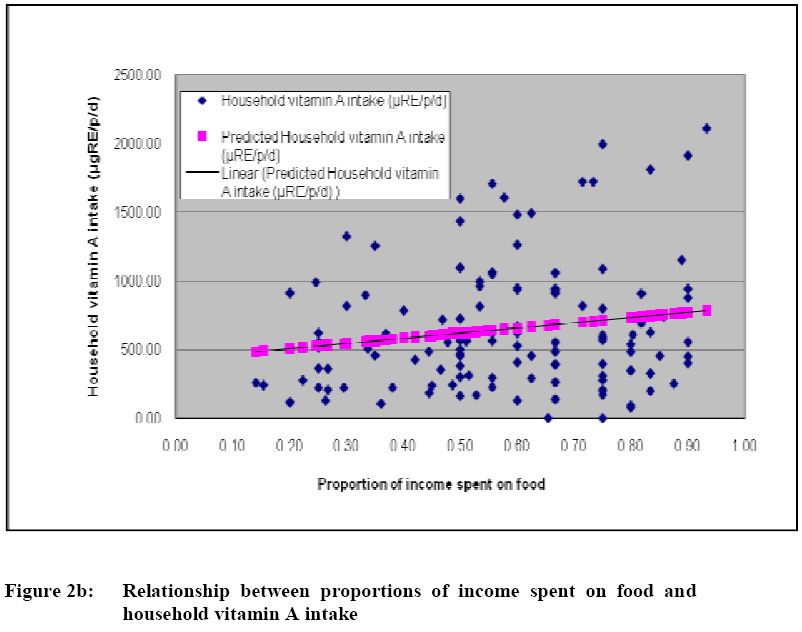
The converse (positive correlation) was true for the proportion of income spent
on food – increase in income spent on food was associated with higher household
vitamin A intake (Figure 2b). For the former case, the Pearson’s coefficient of
correlation was -1.92 with only 3.7% of the variance explained. Pearson’s
coefficient of correlation for the proportion spent on food was 1.64 with only 2.7%
of the vitamin A intake variation explained. DISCUSSIONS The sampling and preparation of foods analyzed was varied from the
conventional approach of sampling and simulating preparation method in the
laboratory prior β-carotene analysis. The samples were collected from
farmers after home-based preparation. Uncontrolled preparation method prior to
β-carotene analysis may partly explain the difference between the values
reported here and those already published [14, 15]. Other factors that can
potentially explain the variations are the species-specific (genetic diversity,
and stage maturation) and ecological factors such as soil and seasonality,
among others [16]. The results are contrary to what
has been stated about sub-Saharan Africa – that 80% of dietary intake of
vitamin A comes from plant foods [9]. When combined, plant sources account for
43.13%, roughly half of what may be expected (80%). This however compares
favorably with 48 % contribution of fruits, nuts and vegetables (as a group) to
vitamin A intake in United States diets [17]. It is also important to note that
although the survey time cut across all seasons, seasonality was not factored
in the analysis. Rainy seasons are normally associated with increased
consumption of vegetables because they are highly available then. There could
possibly be a marked different when the survey is done in dry season when the
vegetables are expected to be scarce and expensive. It was revealed that ALVs as a
group are a major plant source of vitamin A, accounting for about a third of
the total daily vitamin A intake and about two-thirds of the intake from plant
foods. This does compare favorably with Faber et al. [18] who have reported
42-68% contribution of dark-green vegetables (not ALVs alone- ALVs inclusive)
among 2-5 year old children KwaZulu Natal, South Africa. Of all the ALVs, cow
pea leaves is the most important source of vitamin A. Out of the ALVs analyzed
for β-carotene content, cowpea leaves have comparatively medium-level
content of the pro-vitamin A. The reason why it is an important ALV (and
overall a significant vitamin A source) could be because it is widely grown,
consumed in large quantities and a preference for many in the study area.
Consumption of ALVs in the study community can be traced back to many years and
is a cultural dietary habit. In addition, there are development agencies that
have been conducting promotional activities aimed at boosting ALVs production,
marketing and consumption. Anecdotal data also depict that the community has
moved from gathering wild ALVs to cultivating them –thanks to the efforts of
supplying farmers with viable ALV seeds. Despite the marketing support
initiatives in the study area, the community seems to be generally a net
consumer, and not a net seller of ALVs; only about a quarter of the ALVs
produced are sold in the markets. The contribution of ALVs to
vitamin A intakes of those earning more than US$1 and those who earn less did
not differ significantly. This could be an indication that the consumption of
ALVs is a cultural practice, more influenced by availability and preference,
and is less dependent on the household economic status. The scenario is
however, not different from other food groups. Further analysis (of the odds of
‘intake below average’) however, brings out an interesting observation- vitamin
A intake from ALVs below the general average computed is more likely in lower
income groups than higher income groups. This hints that probably, there could
be a relationship between the level of contribution of ALVs to vitamin A intake
and household income. That is, the higher the household income, the higher
likelihood of vitamin A intake from ALVs, and vice versa. The case is
the same for fats and oils and animal source foods (meats and milk). The latter
case is expected since animal source foods, fats and oils are largely bought,
as opposed to ALVs, which are produced more for subsistence use than for
commercial purposes. It was noticed that the higher
the income, the less the vitamin A intake. This correlation is weak and does
not suggest significant influence on vitamin A intake. This is consistent with
the earlier observation that income does not affect vitamin A intake from ALVs
and other foods as well. One parameter that does show positive correlation
with vitamin A intake is the proportion of income spent on food. The higher the
proportion of income spent on food, the higher the vitamin A intake. The correlation
however is also weak and not sufficient to indicate that improving the
income-base and encouraging the use of more income to purchase food can lead to
improvement in vitamin A intake. CONCLUSION
AND RECOMMENDATION African Leafy Vegetables form an important dietary source
of vitamin A, contributing about one-third of total vitamin A consumed in rural
households in western Kenya. This also accounts for more than two-thirds of
total contribution of plant-based foods. The most abundant and consumed ALVs,
accounting for most of the dietary vitamin A is the cowpea leaves. Its contribution
to daily vitamin A intake surpasses that of most food groups. In areas of
similar environmental conditions, ALVs production, marketing and consumption
should be promoted. There are inconclusive or unconvincing indications that the
higher the income levels, the more the household vitamin A intake and intake
from ALVs. Further, the proportion of income spent on food is positively but
weakly correlated with total vitamin A intake. Nutrition and development
programs and policies should consider ALVs as significant source of vitamin A,
and that increments in incomes per se may not significantly influence
household vitamin A intake and from ALVs. ACKNOWLEDGMENTS The authors wish to thank
Nutrition Third World, Belgium for funding this research work and the
households in Butere-Mumias District, Kenya for their cooperation and
willingness to provide information that was used in this study. REFERENCES © Copyright 2009 - Rural Outreach Program | |||||||||||||||||||||||||||||||||||||||||||||||||||||||||||||||||||||||||||||||||||||||||||||||||||||||||||||||||||||||||||||||||||||||||||||||||||||||||||||||||||||||||||||||||||||||||||||||||||||||||||||||||||||||||||||||||||||
| |||||||||
