 |
| About Bioline | All Journals | Testimonials | Membership | News |
|
||||||
|
||||||
African Journal of Food Agriculture Nutrition and Development, Vol. 9, No. 6, Sept, 2009, pp. 1345-1364 Nutritional Status Of Children (6-59 Months) Among HIV-Positive Mothers/Caregivers Living In An Urban Setting Of Uganda Bukusuba J1*, Kikafunda JK1 and RG Whitehead2 *Corresponding author email: jbuk2001ug@yahoo.com Code Number: nd09066 ABSTRACT Few studies have attempted to establish the burden of childhood malnutrition and the associated factors among households of HIV-positive mothers/caregivers particularly in urban settings. There is also no satisfactory evidence of health and nutritional benefits of food aid in this particular group where options to attain a balanced diet are generally minimal. A cross- sectional survey was therefore organized to assess the prevalence of malnutrition and establish the contributory factors that would be vital in design of interventions. The target group was children under five years of age (6-59 months) of HIV-positive mothers/caregivers residing inan urban setting of Uganda. Interviews were conducted with a random sample of 144 households of HIV-positive mothers/caregivers of children under the age of five years in Jinja municipality in Eastern Uganda. Nutritional status was determined on every randomly selected index child from sampled households. Epi-Info 2002 was used for calculation of z-scores and Nutrisurvey for SMART (2005) for drawing anthropometric charts. SPSS version 12 was then used for descriptive statistics, bivariate and multivariate analyses. For all the statistical tests, P≤0.05 was considered significant.The proportion of stunted children (23%) among study households was nearly 12 times higher, underweight (11%) more than five times higher and wasting (3.5%) about two times higher than the level expected in a healthy, well-nourished population. Malnutrition among children under five years of age in households of mothers/caregivers living with HIV/AIDS in Ugandan urban settings is therefore of public health concern. The identified causative factors include high malaria and fever episodes, high dependency ratio, low food access, low Socio-Economic Status (SES) and low education level of mother/caregiver. Interventions to address malnutrition in this vulnerable group should therefore aim at addressing the identified contributory factors. Use of insecticide-treated mosquito nets (ITNs) and campaigns to ensure their proper use, income generating activities, and kitchen gardening are some of the targeted interventions that could contribute to alleviation of the problem. Food aid to supplement the diet contributes to daily energy requirements. Key words: HIV+ mothers/caregivers, under- fives, diet INTRODUCTION Sub-Saharan Africa, one of the poorest regions in the world, is severely affected by HIV/AIDS. More than 80% of all people living with HIV in the world are from sub-Sahara Africa [1,2]. In Uganda, it is estimated that of the 1,050,055 people who were living with HIV/AIDS in 2002, 51% were women, 39% men and 10% were children below 15 years [3,4]. Jinja is the second smallest district in Uganda, with high urban HIV prevalence (10%) and under-five mortality rate of 115 per 1000 live births [5]. This rate is more than double the acceptable level of below 50 deaths per 1000 live births [6]. With the growing loss of economically productive members (15-49 years) to HIV/ AIDS and numbers of children who have lost one or both parents, there is now a well documented increasing dependency ratio. The economic consequences are worsened by a diversion of income earned in a household and savings to health care of HIV-positive members. Additional high health costs of opportunistic infections, side effects of treatment and poor replacement feeding among HIV-positive mother/caregivers hinders adequate dietary consumption and hence health of children. One of the most detrimental effects of the HIV/AIDS pandemic is therefore the inability of affected households to put enough food on the table mainly because of the continued deterioration of the health of affected persons and subsequent decreased productivity [7]. The Agricultural Cooperative Development International/Volunteers in Overseas Cooperative Assistance (ACDI/VOCA) Title II HIV/AIDS Life Initiative program was started in Uganda in 1992 to improve the quality of life of People Living with HIV/ AIDS (PLWHA) by keeping them productive and able to work, helping them to grow food and contribute to the income of their families. This reduced time and money spent on health and reduced food insecurity in these households. Beneficiary households received monthly rations of Corn Soy Blend (CSB) and vegetable oil. However, there wasn’t much reported on whether access to food aid enabled beneficiary households to consume a diversified diet and higher number of meals. These are considered proxy indicators for micronutrient and macronutrient intakes, respectively [8]. Malnutrition affects mostly children because of their high demand for nutrients to meet rapid growth rates. Low quantity and quality of complementary foods, poor child-feeding practices, and high rates of infections, contribute to poor health and growth in this vulnerable group. Malnutrition in children results in growth retardation and, limited cognitive development that diminish their working capacity during adulthood. It also results in decreased resistance to disease and infections and ultimately, ill health and death [9,10]. Health costs to the nation and the families plus the time the mother spends attending to a sick child are enormous. According to earlier studies, 34% of all deaths that occur before the fifth birthday in Uganda are attributed to malnutrition. Childhood malnutrition is therefore a significant public health problem in Uganda, affecting more than one third of the children under the age of five [11]. Anecdotal data suggests that the burden of childhood malnutrition falls squarely on mothers/caregivers. However, the nature, magnitude and spread of the burden are rarely quantified. In addition, the nutritional implications of food aid in Jinja town are not fully known. An assessment was thus designed to investigate the nutritional status of children aged 6-59 months among HIV+ mothers/caregivers living in an urban setting of Uganda. The findings of the assessment are critical as a basis for designing sustainable food security and nutrition programs, complementary feeding and nutrition counseling for HIV-positive mothers/caregivers. METHODOLOGY This was a cross-sectional study in which HIV-positive mothers/caregivers living with children under five years of age (6-59 months) and residents of Jinja municipality were randomly recruited with the help of The AIDS Support Organization (TASO) in Jinja district, eastern Uganda. The procedure used in selection of the calculated sample of study households was Simple Random Sampling (SRS). A numbered list of all eligible households was first made by assigning each household a unique number. These numbers were subsequently written on small pieces of paper and placed in a box. 160 households were then picked from the box, making sure that the box was well shaken each time to ensure the principle of equal and random selection. The selected subjects were then contacted for consent. A total of 144 HIV-positive mothers/caregivers living with at least one child under the age of five years (6-59 months) agreed to participate. Interviews were conducted in local languages (Lusoga or Luganda) at the respective households of respondents. Inclusion and Exclusion criteria HIV-positive mothers/caregivers were eligible for the study if they were residents of Jinja municipality (urban setting) and had a child below five years of age in their household. In each household, one index child was selected. Potential participants were excluded at recruitment if they had no child under the age of five years in their households or if they were not residents of Jinja municipality. A household was defined as a group of people who lived under the same roof or in the same house and ate meals together. Dietary quality was measured by the Dietary Diversity Score (DDS), which was calculated as the sum of the number of different food groups consumed within the household in the 24 hours prior to the assessment [12].A total of 12 food groups were considered in this study: cereals (such as maize, millet, sorghum, rice), roots/tubers (such as cassava, yams, irish potato, sweet potato), legumes (such as beans, peas, groundnuts, soybeans), milk/milk products (such as fresh milk, yoghurt), fish, oils/fats, fruits (such as mangoes, pineapples, pawpaws), poultry (such as chicken, duck, turkey, pigeon), meat (such as beef, mutton, pork, rabbit, goat meat, offals), eggs, vegetables (such as avocado, carrots, cabbage, onion, egg plant, pumpkin, tomato) and sugar/honey. The diversity score was calculated by attributing a score of “1” to each food group that was eaten within the household and “0” was assigned for each food group not consumed. Households with a higher diversity score were considered to have a high quality diet with high micronutrient consumption. Diet quantity was determined from the number of meals consumed per day in the households. This has been shown to serve as a proxy indicator of adequate macronutrient intake or access to food [8,12,13]. A meal was defined as consumption of food at a particular time in the 24 hours prior to the assessment within the household. The meal timings were categorized as morning meal, any food between morning and lunch, lunch, any food between lunch and supper, supper, or any food after supper. The proportion of households consuming less than three meals per day was then computed. Socioeconomic status (SES) Socioeconomic status was calculated as a continuous cumulative variable using the following factors; employment status of respondent, number of household members engaged in income generation, ownership and type of housing, land and a range of consumer durable assets [7,14,15]. This was done by attributing a score of “1” to each of the above factors reported in the household and a total sum of the scores was calculated for individual households [7]. Nutritional status of children under five years Body weight of the index child was measured twice to the nearest 0.1kg, using a 136 kg digital Scale (Tanita Corporation Tokyo Japan, THD-305 Made in China) while the children were wearing light indoor clothing and no shoes. The mean of the two measurements was used in analysis. Standing height/length of the children without shoes was measured twice, to the nearest millimeter with a portable direct reading stadiometer (Short Productions, Woonsocket, RI). Generally, children above the age of two years (or >85 cm in height) were measured in an upright standing position (height), whereas those aged below two years (or <85 cm in height) were measured lying down in a recumbent position (length). Height or length was expressed in cm, and the mean of the two measurements was used in analysis. Height and weight measurements of the children, taking age and sex into consideration, were converted into z-scores based on the National Center for Health Statistics (NCHS) reference population recommended by the World Health Organization (WHO). Thus, those below -2 standard deviations of the NCHS median reference for height-for-age, weight-for-age and weight-for-height were categorized as stunted, underweight, and wasted, respectively [16,17,18,19]. In this study, all three indices were used to describe the level of child malnutrition. However, given that low height-for-age (stunting) measures linear growth retardation and cumulative growth deficit and indicates the effect of past or chronic malnutrition, an in-depth multivariate analysis was performed on stunting. The total of severe and moderate (<-2 SD) were used to indicate poor nutritional status (malnourished) and was coded as 1. Those that were mild or better (≥-2 SD) were categorized as not malnourished and coded as 0 [19]. Morbidity of children The types of illnesses suffered by the children in the two weeks prior to the study were determined. Diarrhoea was defined as any episode of more than three stools per day; bloody diarrhoea as any episode of more than three diarrhoeal stools per day in which there was presence of blood in at least one or all of the diarrhoeal stools; measles - any episode of fever accompanied by cutaneous eruption, rhino-pharyngitis or conjuntivitis; fever - elevated body temperature; acute respiratory infection (ARI) - any episode with associated fever & cough with signs of sputum, thoracic pain, dyspnoea, or wheezing; and malaria - measured fever (temperature > 37.5°C) or a reported positive test for blood stage Plasmodium falciparum at any density. Statistical analysis The statistical package Epi-Info 2002 was used in calculation of z-scores and Nutrisurvey for SMART (2005) for drawing anthropometric charts. SPSS version 12 was then used in data cleaning and analysis. Histograms with a frequency curve superimposed were used for continuous data to see if the distribution was normal and whether there was adequate data cleaning. Scatterplots and boxplots were used to compare two variables to identify bivariate outliers, or values of a variable that were far different from the expected values. After data cleaning and transformation, one-way analyses were performed to show associations between one independent variable and nutritional status. Multivariate analysis was used for further investigation of the validity of bivariate associations. To determine the independent correlates of nutritional status, stepwise linear regressionwas conducted. HAZ was used as the dependent variable in the regression. Sex of child was coded as male = 1 and female = 0. Mother/caregiver’s education was recoded into a dichotomous variables as no formal education = 0 and primary or higher = 1. Marital status of mother/caregiver was recoded into a dichotomous variable as well; widowed = 1 and not widowed (never married, divorced/separated and married) = 0. For any illness, presence was coded as 1 and absent = 0. Skipping of meals by children in the two months prior to the survey (as a proxy indicator of low food access) was recoded as often = 1 and rarely or never = 0. Access to food aid was coded as beneficiary = 1 and not beneficiary = 0. Statistical significance was set at the 5% Confidence Interval and for all statistical tests P≤0.05 was considered significant. Ethical considerations The study was approved by the Department of Food Science and Technology of Makerere University in Uganda, TASO research committee and Uganda National Council for Science and Technology (UNCST). Consent from study households was obtained prior to recruitment with the help of counselors at TASO-Jinja. HIV-positive mothers/caregivers were informed that any information collected during the course of the study was to be kept confidential. Personal names were not reflected in any research document, instead, identification numbers were used, but up to data analysis stage. RESULTS Background characteristics of the study participants Table 1 provides information on socio-demographic characteristics of the study population. A total of 144 children (6-59 months) were studied, of which 51.4% were female and 48.6% male. The distribution of children by age group were 6-17 months (16.7%), 18-29 months (13.2%), 30-41 months (12.5%), 42-53 months (33.3%) and 54-59 months (24.3%). The common illnesses reported among children were fever (78.3%), malaria (32.5%) and diarrhea (22.3%). There were no reported episodes of bloody diarrhea, ARI or measles among children in the two weeks before the assessment. A total of 144 HIV-positive mothers/caregivers were interviewed. The mean age was 34 years and the highest proportion of them was widowed (57%). Most of the respondents were of Basoga tribe (73%). Nearly 60% of the households were female-headed. The average household size was seven with the largest household having 18 members and the smallest having two members, the respondent and one child. About 38% of the households had more than one person living with HIV and the highest number of PLWHA in a household was five. Table 1: Socio-demographic characteristics of the study population
*Value represents Mean ± Standard Deviation Shown in Table 2 is information on the socio-economic characteristics of the study population. The study revealed that though more than half of the mothers/caregivers had a primary level of education (55%), a substantial proportion had no formal education (11.8%). Majority of the respondents were unemployed (51.4%) and had only one income earner in their household (67.4%). The dependency ratio calculated as the ratio of number of people employed or earning income in household to household size was 0.14 ± 0.13. Almost half of the households (44.4%) received monthly rations of Corn Soy Blend (CSB) and vegetable oil from ACDI/VOCA Title II HIV/AIDS Life Initiative program and about 62% of these households had received food aid for at least two years. Table 2: Socio-economic characteristics of the study population
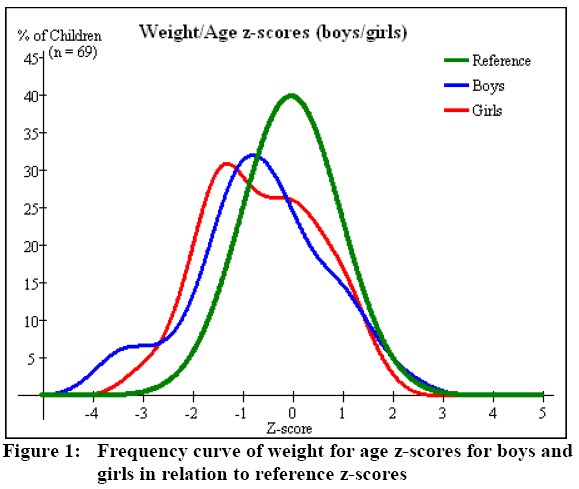
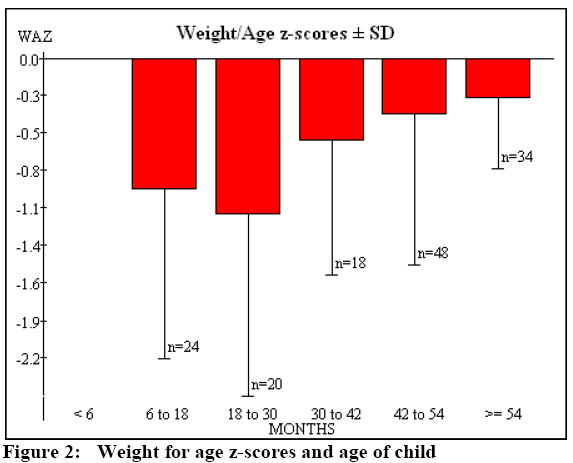
*Value represents Mean ± Standard Deviation Dietary quality and quantity One of the most detrimental effects of the HIV/AIDS pandemic is the inability of affected households to access adequate food on the table usually because of the continued deterioration of the health of affected persons and subsequent decreased productivity. Dietary quality Though the average number of food groups consumed in the study households was about six, more than half of these households reported consumption of less than six food groups in the 24 hours prior to the survey (59%). The food groups reportedly consumed within households in the 24 hours prior to the assessment were mainlycereals (88.3%), sugar/honey (86.9%), vegetables (84.8%), legumes (70.3%) and oils/fats (69.7%). There was low consumption of eggs (16.0%), fruits (40.3%), and foods of animal origin such as meat (13.9%), fish (31.9%) and milk/milk products (45.8%). Consumption of a diversified diet was significantly associated with socio-economic status (SES) [r (N=144) = 0.164, P = 0.04] and access to food aid (F2, 142 = 8.95, P = 0.003). Beneficiaries of ACDI/VOCA Title II HIV/AIDS Life Initiative program reported that access to food aid had helped them to save money for acquiring more food and a varied diet (Table 3). Diet Quantity There was high proportion of households that reported consumption of less than three meals per day (80%). As shown in Table 3, increased meal frequency was significantly associated with access to food aid possibly because of improved food availability in the beneficiary households (F2, 142 = 5.81, P = 0.017). Nutritional status of children under five years of age Nutritional status assessment of children below five years of age in HIV affected households has been recognized as an important indicator of the food and nutrition security situation in these households. As shown in Figure 1, weight for age z-scores (WAZ) curves are displaced to the left of the reference curve demonstrating that malnutrition is prevalent among children of HIV-positive mothers/caregivers in the study area. About 23% of the children below five years of age were stunted of which 9% were severely stunted, 11% were underweight of which 4% were severely underweight and 3.5% were wasted. Malnutrition among children of HIV-positive mothers/caregivers in the study area is therefore of public health concern because in a population of healthy and well-nourished children, only 2% of them are expected to fall below <-2 SD for each of the three indices [11,19]. The proportion of stunted children among households in the study area was consequently almost 12 times the level expected in a healthy, well-nourished population, more than five times for underweight and about twice the wasting level. The level of malnutrition among children of HIV-positive mothers/caregivers was not significantly different from the urban prevalence rate of acute malnutrition in Uganda reported in the 2006 demographic and health study [11]. Multivariate analysis of nutritional status A significant model to predict child’s nutritional status emerged (Adjusted R square = 0.404, P = 0.005). The Adjusted R square showed that the model accounted for 40.4% of variance in nutritional status of children. A low adjusted R square could be a result of a small sample size; however important trends and determinants of nutritional status were identified. The value of Beta gives a measure of the contribution of each variable to the model. The impact of malaria, child’s age, dependency ratio and skipping of meals (as a proxy indicator of low food access) on nutritional status appeared to be significantly greater than those of sex of child, fever incidences, household dietary diversity score, access to food aid, widowed, socio-Economic Status (SES) and education level of mother/caregiver (Table 4). The prevalence of underweight among children rose with age and peaked at 18-30 months (Figure 2). Table 3: Impact of access to food aid on dietary consumption patterns
Table 4: Some of the variables predicting nutritional status of children in the study area
YBeta gives a measure of the contribution of each variable to the
model DISCUSSION Poor health status and prolonged illness associated with HIV/AIDS inhibit the productivity and income-earning capacity of those infected, as well as those who are withdrawn from other productive activities in order to provide care for sick household members [20]. Household spending on food, education and other basic necessities is often curtailed in order to cope with increased medical expenses. As households absorb additional dependent adults and orphans, the ability to adequately provide for the basic well-being of all household members diminishes. Major determinants of malnutrition The causes of malnutrition among children (6-59 months) born to or living with HIV-positive mothers/caregivers are many and complex but stem basically from inadequate food intake, improper feeding practices and frequent illnesses. In poor settings, the consequences of a mother/caregiver being HIV-positive are felt by the entire household since agricultural production and family income declines, affecting the availability and access to food. This particularly puts children at risk for malnutrition and therefore increased vulnerability to infection and poor growth, as time and household resources are diverted in an effort to care for the HIV-positive mother/caregiver. Household dietary intake A low dietary diversity (below six food groups) demonstrated poor food accessibility and meant that HIV-positive mother/caregiver and their household members especially children in the study area were at a high risk of micronutrient deficiency disorders and related diseases. It has been reported that dietary diversity is a good proxy indicator of the access dimension of household food security as well as micronutrient intake [8,21]. In addition, since a high proportion of study households reportedly consumed less than three meals per day (80%), this would likely mean lower macronutrient intake. In earlier studies, it was reported that consumption of three or more meals per day is a good proxy indicator for sufficient macronutrient consumption and general food security [8]. The results of the current study therefore demonstrate that more than half of the households had an inadequate macronutrient consumption. This possibly contributes to the poor quality of life of HIV-positive mothers/caregivers and their children, since the two groups have high energy and nutrient requirements. Children from households that reported consumption of a less diversified diet (low dietary diversity score) were more vulnerable to malnutrition (Table 4). This was in agreement with the consistent positive association noted between dietary diversity and child growth in a number of countries [8, 22, 23, 24, 25,26]. In a Kenyan survey, dietary diversity measured by the number of individual foods consumed in the 24 hours prior to the study was significantly associated with better nutritional status of children [27]. Access to food aid had an additional short-term contribution to better food access of beneficiary households which translated into better nutritional status of the children. Households that did not have access to food aid were therefore more likely to have malnourished children than their counterparts who received food aid. Child’s health status The assessment revealed high episodes of malaria and fever as major contributory factors to poor nutritional and health status of children in the study area (Table 4). Malaria, especially due to Plasmodium Falciparum is one of the major infectious diseases and leading causes of anaemia and child deaths in sub-Saharan Africa where about one million children die every year because of malaria [28]. Studies have shown that malaria, diarrhea, together with parasitic worm diseases and other infectious diseases such as fever affect both dietary intake and utilization, consequently affecting child’s nutritional status [29, 30]. Age and gender of the child The present study found that poor nutrition mainly affects children between the ages of one and three years.The trend was similar to findings on children in the general population from previous studies [9, 31, 32, 33]. One of the studies showed that the prevalence of moderate and severe forms of malnutrition was high in children aged 13 to 36 months [31]. These findings demonstrate poor complementary feeding patterns, low food access and poor health care of children as a result of diversion of income to the health care of HIV-positive mothers/caregivers.Overall, results also showed a higher percentage of malnourished boys than of girls, a finding consistent with earlier findings [10,19, 34,35]. Socio-economic factors Socio-economic status was significantly associated with nutritional status of children under five years of age (Table 4). Prevalence of malnutrition significantly reduced with increase in SES. Earlier studies in Uganda and other countries showed that households with higher SES, have a lower prevalence of stunted children [9,32,33,36].The burden of orphans (defined in this study as children who had lost both parents) and being widowed especially for female headed households jeopardizes the health and nutritional well-being of children [37]. About 29% of the children were orphans and more than half of the households were female headed (60.4%). Children from households with high numbers of dependants and those whose mothers/caregivers were widows/widowers had an increased risk of malnutrition. Education of mother/caregiver Education is one of the most important resources that enable mothers or care givers to provide appropriate care for their children, which is an important determinant of children’s growth and development. In the current study, children whose mothers/caregivers had primary or higher education were more likely to be well nourished. Studies in Uganda [34], Ethiopia [38], Libya [39] and Philippines [40] revealed a similar trend.Education is not only a human right, but also a social necessity since people who have been able to gain proper schooling are able to take advantage of the information and opportunities it provides for improving their standards of living. CONCLUSION This study showed that malnutrition among children under five years of age in Ugandan urban households of mothers/caregivers living with HIV/AIDS is of public health concern. The identified causative factors were: high malaria and fever episodes, high dependency ratio, low food access, low Socio-economic Status (SES) and low education level of mothers/caregivers. Interventions to address malnutrition in this vulnerable group should therefore aim at addressing the above contributory factors. Use of insecticide-treated mosquito nets and campaigns to ensure proper use, income generating activities, and kitchen gardening are some of the targeted interventions that could help alleviate the problem. ACKNOWLEDGEMENT We thankfully acknowledge Nestle Foundation of Switzerland for funding this study. The inputs from the Department of Food Science and Technology of Makerere University and Uganda National Council for Science and Technology (UNCST) are appreciated. The staff of TASO-Jinja, Jinja Network of People Living with HIV/ AIDS (JINNET+) and AIDS Orphans Education Trust (AOET) are also commended for their support. REFERENCES
© Copyright 2009 - Rural Outreach Program The following images related to this document are available:Photo images[nd09066f2.jpg] [nd09066f1.jpg] | |||||||||||||||||||||||||||||||||||||||||||||||||||||||||||||||||||||||||||||||||||||||||||||||||||||||||||||||||||||||||||||||||||||||||||||||||||||||||||||||||||||||
| |||||||||
