
|
African Journal of Food, Agriculture, Nutrition and Development
Rural Outreach Program
ISSN: 1684-5358 EISSN: 1684-5374
Vol. 9, Num. 9, 2010, pp. 1914-1926
|
African Journal of Food Agriculture Nutrition and Development, Vol. 9, No. 9, Jan, 2009, pp. 1914-1926
Household Level Determinants Of
Food Insecurity In Rural Areas Of Dire Dawa, Eastern Ethiopia
Bogale A1* and A
Shimelis2
1Alexander von Humboldt Research Fellow, Humboldt
University of Berlin, Philippstrasse 13, 10115 Berlin, Germany
2Researcher, Somali Regional Pastoral and Agropastoral
Research Institute, Jijiga, Ethiopia
*Corresponding
author email: ayalnehb@yahoo.com
Code Number: nd09112
ABSTRACT
Even though the struggle to
achieve food security at the household level in the rural areas of Ethiopia
dates back a long period, it has remained as a challenging goal even today.
Making their living on marginal, moisture stressed, heavily degraded and less
productive land, households in rural areas of Dire Dawa face persistent food
shortages. The design and implementation of effective measures to reduce
household food insecurity in the region depends on in-depth understanding of
its covariates.This study seeks to address these issues by assessing
location specific socio-economic factors that influence food insecurity of
households in rural areas of Dire Dawa Administrative region. The analysis is
based on survey data gathered from randomly selected 115 sample rural
households in the study area. A binary logit model was used to identify the
factors influencing household level food insecurity. A total of thirteen
explanatory variables were included in the empirical model. The empirical
results estimated using the survey data to identify the determinants of food
insecurity among rural households in the study area revealed mixed impressions.
Among variables considered, family size, annual income, amount of credit
received, access to irrigation, age of household head, farm size, and livestock
owned showed theoretically consistent and statistically significant effect. However,
estimated coefficients of number of oxen owned and dependency ratio showed
theoretically inconsistent and statistically insignificant effect on the
probability of household to be food insecure.. Estimated coefficients of sex of
household head, total off-farm income, education of household head and amount
of food aid received were not found to be statistically significant in
determining household food insecurity in the study area. The findings imply
that improvement in food security situation needs to build assets, improve the
functioning of rural financial markets and promote family planning. These areas
could provide entry points for policy intervention to reduce hunger and augment
household and community livelihood opportunities.
Key words: Food
Insecurity, Binary Logit, Ethiopia
INTRODUCTION
Even though developing countries
have achieved relatively faster agricultural growth during the last four
decades, the progress has been dominated by significant gains in Asia [1].
Agricultural growth in sub-Saharan Africa averaged nearly 3 percent over the
past 25 years. This is partly attributed to their agro-climatic potential, poor
infrastructure and the dismantling of public agricultural institutions for
research, extension, credit and marketing [2]. To counter these years of
neglect and concerned about global food security, the United Nations, heads of
states and Government and international and regional organizations, called for
urgent action [3]. A number of initiatives have emerged or are emerging to
address this important challenge [4]. Such initiatives include the Alliance for
an African Green Revolution and a proposed Global Fund for Smallholder
Agriculture [5]. The reason for such initiatives also includes ensuring
sustainability of agricultural growth in countries experiencing it.
Despite the above efforts,
deepening food crises in several developing countries specially those in
sub-Saharan Africa (SSA) is still the concern of many researchers, planners,
donors and international development agencies, who have given high priority to
the study of food systems and the problem of food security [6]. Despite the
availability of resources and the efforts made by governments in most of these
countries, food insecurity and declining food production per capita remained
among the most crucial issues. The attainment of an increase in food grain
production above the population growth is still a challenge for most SSA
countries [7].
With a
population projected to reach 80 million in 2010 and about 45 percent living
below the poverty line and most vulnerable to food insecurity, ensuring food
security remains a key issue for the Government of Ethiopia [8]. In order to combat threats of famine and pervasive poverty and
thereby ensure food security for its population, the government strategy has
rested on increasing the availability of food grains through significant
investments in agricultural technologies (high yielding varieties of seeds,
fertilizer), services (extension, credit, inputs), and rural infrastructure
(roads, markets). The impacts of these policies, however, have been shadowed as
there are still millions of people who experience extreme hunger in the
country.
Food security
is the condition in which all have access to sufficient food to live healthy
and productive lives [9]. Food security is dependent on
agricultural production, food imports and donations, employment opportunities
and income earnings, intra-household decision-making and resource allocation,
health care utilization and caring practices [10]. It
is a multi-dimensional development issue that needs cross-sectoral integrated
approaches. However, because there are concerns that such approaches can be too
costly, too complicated or take too long to show results, institutions may not
invest their scarce resources in implementing them. Moreover, household food
security issues cannot be seen in isolation from broader factors such as
physical, policy and social environment [11]. The physical factors play a large
role in determining the type of activities that can be undertaken by rural
households. Government policies, on the other hand, have a strong effect on the
design and implementation of household food security interventions. Likewise,
the presence of social conflict expressed in terms of mistrust of other social
groups or even outright violence, is also an important factor in the design and
implementation of interventions in a given region.
Making their living on marginal
and moisture stressed, and heavily degraded and less productive land,
households in rural areas of Dire Dawa are facing unrelenting food shortages.
On top of ever decreasing land holding size and increasing population,
recurrent drought and resource (land, water, forest, rangeland) degradation in
the study area have made the food security situation worse. Realizing this
issue, many governmental and non-governmental organizations are intervening at
least to lessen the adverse effects of the food problem, but there is yet
little success. Cognizant of these facts, this study was
designed to identify location specific factors that contributed to household
food insecurity, and through that make recommendations to improve the
effectiveness of interventions.
METHODOLOGY
Source of data
A two-stage random sampling
procedure was used to select 115 rural households in rural areas Dire Dawa. At
the first stage, 5 peasant associations (PAs) were selected randomly. In the
second stage, probability proportional to size sampling technique was employed
to draw sample households from the selected sample PAs. A structured survey
questionnaire was designed and pre-tested to collect the primary data. The
household head was the main respondent. The questionnaire tried to encompass
information on demographic characteristics, crop and livestock production,
farming systems and productive resources, land use, access to services, as well
as coping strategies employed by the households during time of food shortage
[12].
The analytical
model
Food security at the household
level is best measured by direct survey of income, expenditure and consumption
and comparing it with the minimum subsistence requirement [13]. The government
of Ethiopia has set the minimum acceptable weighted average food requirement
per adult equivalent (AE) per day at 2100 kcal [8, 14, 15]. The determination
of the adult equivalent takes into account the age and sex of each household
member [16]. Hence, for this study 2100 kcal per adult equivalent per day is
employed as a cut-off value between food-secure and food-insecure households.
Thus, those households who have energy per AE below the minimum subsistence
requirement (2100 kcal) are deemed to be food insecure, and those who managed
to attain the 2100 kcal per AE per day are considered to be food secure households.
Once the groups are categorized
as food-secure and food-insecure, the next step is to identify the
socio-economic factors that are correlated with food-insecurity. It is
hypothesized that some farm and household characteristics such as household
size, land size and level of agricultural production have got relative
importance in determining whether a household is food secure or not.
A variety of statistical models
can be used to establish the relationship between these household
characteristics and food insecurity. Conventionally, linear regression analysis
is widely used in most economic and social investigation because of
availability of simple computer packages, as well as ease of interpreting the
results. However, results derived from linear regression analysis may lead to
fairly unreasonable estimates when the dependent variable is dichotomous. Therefore,
the use of the logit or probit models is recommended as a panacea of the
drawback of the linear regression model [17]. Which model to choose between
logit and probit is, however, difficult for they are similar in most
applications, the only difference being that the logistic distribution has
slightly fatter tails. This means that there is no binding reason to choose one
over the other but for its comparative mathematical and interpretational
simplicity many researchers tend to choose the logit model [18]. Therefore,
this study employed the logit model following the footstep of these
researchers. The dependent variable in this case, food insecurity, was a binary
variable which took a value one if a household was found to be food insecure,
zero otherwise.
The cumulative logistic
probability model can be econometrically specified as [19]:
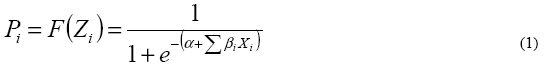
Where Pi is the
probability that an individual is being food insecure given Xi
Xi
represents the ith explanatory variables
a & bi
are regression parameters to be estimated.
e is
the base of the natural logarithm
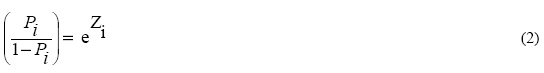
For ease of interpretation of
the coefficients, a logistic model could be written in terms of the odds and
log of odd. The odds ratio is the ratio of the probability that an individual
or household would be food insecure (Pi) to the probability of a
household would not be food insecure (1- Pi). That is,
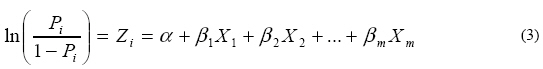
and taking the
natural logarithm of equation (2) yields:
If the
disturbance term Ui is taken into account, the logit model becomes:
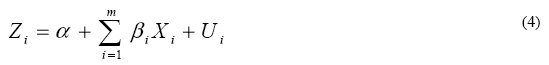
The parameters of the model,
α and β, can be estimated using the maximum likelihood (ML) method
[19, 20].
Variables and
working hypothesis
Review of literature, past
research findings, experts and authors’ knowledge of the food insecurity
situation of the study area were used to identify the potential determinants of
household food insecurity. Therefore, the following variables were selected to
analyze whether they explain a household’s food insecurity or not.
As family size increases,
obviously the number of mouths to feed from the available food increases.
Hence, it is hypothesized that family size and food insecurity are positively
related. Age of household head also matters for household food security. Rural
households mostly devote their lifetime or base their livelihoods on
agriculture. The older the household head, the more experience s/he has in
farming and weather forecasting. Moreover, older persons are more risk
averters, and mostly they tend to diversify their production activities. As a
result, the chance for such a household to be food insecure is less. Moreover,
in a household where productive age groups are higher than the non-productive
age groups, the probability of a household to be in shortage of food would be
less, provided that the area provides good working atmosphere and production
potential. Since male-headed households are in a better position to pull more
labor force than the female-headed ones, sex of the household head is an important
determinant of food insecurity in the study area.
Education equips individuals
with the necessary knowledge of how to make a living. Literate individuals are
keen to get information and use it. Hence, it is supposed that
households who have had at least primary education or informal education are
the ones to be more likely to benefit from agricultural technologies and thus
become food secure.
Ownership of assets such as
cultivated land and livestock as well as access to irrigation decreases the
likelihood that the household will be food insecure. As income determines the
household’s ability to secure food, it remains to be an important variable
which explains the characteristics of food secure and food insecure households.
Income earned from any source improves the food security status of the
household. Households which manage to secure larger income from any source have
better access to the food they need than those households which do not. Credit
may also serve as an important source of income. Those households which receive
the credit they requested have better possibility to spend on activities they
wish. Either they purchase agricultural input (improved seed and/or fertilizer)
or they purchase livestock for resale after they fattened them.
EMPIRICAL
RESULTS
Table 1 below shows summary
statistics and scores of sample household groups on the continuous and dummy
variables included in the model. The results revealed that food insecure and
food secure household groups have statistically significant difference with
respect to mean of the variables such as family size (FASZ), total annual
income (TINC), annual off-farm income (TOFFI), age of household head (AGE),
dependency ratio (DPR), and amount of credit received (AMDT). Categorical
variables such as education of the household head (EDUC) and access to
irrigation (IRGN) were also found to be statistically different for the two
groups of households (Table 1).
Table 1: Code,
definitions and descriptive statistics of variables included in the logit model
Variable code |
Variable type |
Variable definition |
Food insecure
(N = 87) |
Food secure
(N = 28) |
Overall sample
(N = 115) |
t- (chi-square) value |
Mean |
SD |
Mean |
SD |
Mean |
SD |
FASZ |
Continuous |
Family size in number |
7.08 |
1.67 |
4.50 |
1.48 |
6.45 |
1.96 |
7.784*** |
DPR |
Continuous |
Dependency ratio |
1.35 |
0.84 |
0.92 |
0.64 |
1.23 |
0.82 |
2.888** |
CLSZ |
Continuous |
Cultivated land size |
0.74 |
0.33 |
0.85 |
0.43 |
0.77 |
0.36 |
-1.489 |
TLU |
Continuous |
Total livestock holding in
TLU |
4.80 |
4.47 |
5.677 |
6.06 |
5.01 |
4.89 |
-0.824 |
OXEN |
Continuous |
Number of oxen owned |
0.41 |
0.62 |
0.50 |
0.64 |
0.43 |
0.62 |
-0.635 |
AMDT |
Continuous |
Amount of credit received |
68.70 |
97.99 |
115.07 |
118.27 |
79.98 |
104.67 |
-1.877* |
TOFFI |
Continuous |
Total off farm income earned |
168.80 |
195.41 |
416.89 |
284.87 |
229.21 |
243.85 |
-4.295*** |
FAID |
Continuous |
Food aid obtained |
340.44 |
261.35 |
322.96 |
247.83 |
336.19 |
257.17 |
0.312 |
AGE |
Continuous |
Age of household head in
years |
41.07 |
8.66 |
32.21 |
7.38 |
39.89 |
8.60 |
2.877** |
TINC |
Continuous |
Total annual household
income |
1554.72 |
633.69 |
2230.12 |
738.86 |
1719 |
719 |
-4.349*** |
EDUC |
Dummy# |
1, if the household head
is literate; 0, otherwise |
26.40 (23) |
|
42.90 (12) |
|
30.40 (35) |
|
2.794* |
SEX |
Dummy |
1, if the household head is
male; 0, otherwise |
88.50 (77) |
|
85.70 (24) |
|
87.83 (101) |
|
0.154 |
IRGN |
Dummy |
1, if the household used
irrigation; 0, otherwise |
4.60 (4) |
|
78.60 (22) |
|
22.60 (26) |
|
30.27*** |
Note: SD: Standard
Duration; # Mean for dummy variables indicates percent with value 1
and numbers in the parenthesis represent frequency distribution;
***, ** and * is
significant at 1%, 5% and 10% probability level, respectively.
In order to identify the most
important factors which determine household food insecurity from the
hypothesized potential variables, binary logit model was estimated by employing
SPSS Version 10.0 statistical package.
Since the likelihood ratio test
statistics exceeds the chi-square critical value by 13 degrees of freedom, the
hypothesis that all coefficients of the model except the intercept are equal to
zero is rejected. Another measure of goodness of fit used in logistic
regression analysis is the count R2, which indicates the number of
sample observations which are correctly predicted by the model. The count R2
is based on the principle that if the estimated probability of the event is
less than 0.5, the event will not occur and if it is greater than 0.5, the
event will occur [20]. In other words, the ith observation is
grouped as food insecure if the computed probability is greater than or equal
to 0.5, and as otherwise food secure . The model results showed that the
logistic regression model correctly predicted 97.4 percent of the sample
households. The sensitivity (correctly predicted food insecure) and the
specificity (correctly predicted food secure) are found to be 98.9 percent and
92.9 percent, respectively (Table 2).
Table 2: The maximum likelihood estimates of the
logit model
Variables |
Estimated
Coefficient |
Odds
ratio |
Wald
Statistics |
Constant |
20.361 |
|
4.064** |
FASZ |
3.907 |
49.770 |
8.401*** |
DPR |
-0.583 |
0.558 |
0.135 |
CLSZ |
-7.455 |
0.001 |
3.556* |
TLU |
-0.350 |
0.704 |
2.738* |
OXEN |
2.811 |
16.630 |
1.813 |
AMDT |
-0.021 |
0.979 |
4.794** |
TOFFI |
-0.004 |
0.996 |
1.273 |
FAID |
0.003 |
1.003 |
0.405 |
AGE |
-0.296 |
0.744 |
3.357* |
TINC |
-0.005 |
0.995 |
2.803* |
EDUC |
-3.343 |
0.035 |
2.036 |
SEX |
-3.073 |
0.046 |
0.718 |
IRGN |
-8.290 |
0.000 |
4.393** |
Pearson Chi-square 107.07***
- 2 Log likelihood
20.54
Correctly Predicted (Count R2)
97.4
Sensitivity
98.9
Specificity
92.9 |
Note: ***, ** and * is
significant at 1%, 5% and 10% probability level, respectively.
Out of the thirteen variables
hypothesized to influence household food insecurity, seven were found to be
statistically significant. The maximum likelihood estimates of the logistic
regression model showed that family size, annual household income, amount of
credit received, irrigation use, age of the household head, cultivated land
size and total livestock owned measured in Tropical Livestock Unit (1 TLU = 250
kg live weight of livestock) were important factors identified to influence
household food insecurity in the study area.
DISCUSSION
Family size is found to be
highly significant to determine household food insecurity in the study area.This household factor revealed a positive relationship with food insecurity
indicating that the odds ratio in favor of the probability of being food
insecure increases with an increase in the family size. More specifically, the
odds ratio in favor of food insecurity, cetris paribus,increasesby a factor of 49.77 as the family size increases by one member. The likely
explanation is that in an area where households depend on less productive
agricultural land, increasing household size results in increased demand for
food. This demand, however, cannot be matched with the existing food supply so
ultimately end up with food insecurity.
The amount of household income
was hypothesized to have negative influence on food insecurity. In agreement
with the hypothesis, its coefficient came out to be negative and statistically
significant. Households that have access to better income opportunities are
less likely to become food insecure than those households who had no or little
access. The odds ratio in favor of food insecurity decreases by a factor of
0.995 as income increases by one unit.
The sign of the coefficient of
age of the household head shows a negative relationship with food insecurity
which is statistically significant. This means that an increase in the age of
the household head decreases the likelihood for the household to become food
insecure. This is possible because as rural households acquire more and more
experience in farming operations, accumulate wealth and use better planning,
they have better chances to become food secure. This result agrees with the
prior expectation. The odds ratio, keeping other factors unchanged, in favor of
food insecurity decreases by a factor of 0.744 when age of the household head
increases by one year.
Cultivated land size was
hypothesized to influence food insecurity negatively. The results of the logit
model indicated that sample households which had larger farm size had less risk
of being food insecure. This is confirmed by statistically significant negative
coefficient of the variable. The possible justification is that farm households
which had larger farm size had better chance to produce more, to diversify the
crop they produce and also have got larger volume of crop residues.
The result of the logit model
showed that amount of credit received has a significant and negative influence
on food insecurity in the study area. This result is completely in agreement
with the prior expectation. This might be due to the fact that households which
have the opportunity to receive credit would build their capacity to produce
more through purchase and use of agricultural inputs. It would also be possible
for the households to spend the credit on some other income generating
activities so that the income from these activities position households on a
better status to escape vulnerability to food insecurity.
Use of irrigation showed a
statistically significant and negative relationship with food insecurity. The
negative relationship indicates that using irrigation reduces the risk of food
insecurity among the sample households. This can be justified by the fact that
in moisture stressed areas like the rural areas of Dire Dawa, getting access to
irrigation would improve the situation and help to boost agricultural output.
It is important to note that by definition, odds ratio implies the ratio of the
probability of occurrence to the probability of non-occurrence. In this case,
it is the ratio of the probability of being food insecure to the probability of
being food secure. Here, odds ratio with respect to irrigation variable was
zero. This means that the probability of a household to be food insecurity is
zero if a household has access and uses irrigation.
The relationship between the
amount of livestock holding in tropical livestock unit and food insecurity
turned out to be negative and statistically significant. This is an indication
that ownership of livestock acts as a hedge against food insecurity in the
study area. Livestock, besides its direct contribution to subsistence need and
nutritional requirement, is a vital input into crop production by providing
manure and serves to accumulate wealth that can be disposed during times of
need, especially when food stock in the household deteriorates. The odds ratio
in favor of food insecurity decreases by a factor of 0.704 when the amount of
livestock owned by a household rises by one TLU.
CONCLUSION AND
RECOMMENDATION
A number of
studies have sought to examine the extent and determinants of food security and
poverty in rural Ethiopia [21, 22, 23]. Socio-economic variables such as asset
holding (mainly cultivated land, farm income and livestock holding) and access
to services like credit are found to be important correlates which affect
household food security favourably. While controlling for all other variables,
households with better access to irrigation are found to have significantly
higher wellbeing and so more likely to be food secure. However, among demographic
variables considered in this study only household size was found to have a
negative and statistically significant effect on household food security. Contrary to usual
expectation, the coefficient of education level of the household head was not
statistically significant. This may imply that education of household
head has not yet enhanced households’ capabilities to adopt better production
technologies, accept technical advice from extension workers and diversifying
their source of income than the illiterate ones which would have reduced the
risk of food insecurity among households. The results also suggest that both food
secure and food insecure households have the same access to food aid resources.
Thus, food aid targeting should be a concern during intervention. The
statistically insignificant coefficient for oxen ownership clearly points out
to the difference in livelihood activities between the highlands of Ethiopia
and the study area. As stated elsewhere in this paper, the rural areas of Dire
Dawa are largely moisture stressed and drought prone where cultivation of crop
is rudimentary. Therefore, it is the number of total livestock which is
dominated by cows and goats that makes a difference rather than owning oxen for
plowing.
REFERENCES
- World Bank. Agriculture for Development.
World Development Report 2008. Washington DC: The World Bank. 2007.
- Denning G, Kabambe P, Sanchez P, Malik A, Flor
R, Harawa R, Nkhoma P, Zamba C, Banda C, Magombo C, Keating M, Wangila J and D
Sachs Input subsidies to improve smallholder maize productivity in Malawi:
toward an African Green Revolution. PLOS Biology 2009; 7(1):e23.
- Anonymous. “L’Aquila” joint statement on
global food security. L’Aquila Food Security Initiative (AFSI): Food Security
2009; 1(3):235–237.
- Negin J, Remans R, Karuti S and J Fanzo Integrating
a broader notion of food security and gender empowerment into the African Green
Revolution Food Security 2009; 1(3):351–360.
- Sanchez A, Denning L and G Nziguheba The
African green revolution moves forward. Food Security 2009; 1(1):37–44.
- Gezahegn K Agricultural Marketing Policies and Food Security in
Ethiopia. In: D Mulat, A Wolday , S Ehui and Z Tesfaye (eds.). Food
Security, Nutrition and Poverty Alleviation in Ethiopia: Problems and
Prospects Proceedings of the Inaugural and First Annual Conference of the
Agricultural Economics Society of Ethiopia. Addis Ababa. 1995.
- Kidane W, Maetz M and P Dardel Food
Security and Agricultural Development in sub-Saharan
Africa: Building a case for more public support (Main Report).
Subregional office for the southern and east Africa, Food
and Agriculture Organization of the United Nations, Rome.
2006.
- MoFED. Ministry of Finance and Economic
Development. Ethiopia: Sustainable Development and Poverty Reduction
Program. Addis Ababa. 2002.
- World Bank. Poverty and Hanger: Issues and
Options in Developing Countries. A World Bank Policy Study, Washington, D.C. 1986.
- Maxwell S and TR Frankenberger Household
Food Security: Concepts, Indicators and Measurements. A Technical Review.
United Nation Children's Fund and International Fund for Agricultural
Development, New York and Rome. 1992.
- Hoddinott J (ed)Method for
Rural Development Projects. Food Security in Practice, Volume 1, International
Food Policy Research Institute, Washington DC. 2001.
- Shimelis A and A Bogale Dimensions of
Food-insecurity and Livelihood Strategies among Rural Households in Dire Dawa,
eastern Ethiopia. Tropical Science 2007; 47(2): 73–80.
- Braun J von, Bouis H, Kumar S and R Pandya-Lorch Improving Food Security of the Poor: Concept, Policy, and Programs.
International Food Policy Research Institute. Washington, DC. 1992.
- Kifle L and G Yosef The Food Security
Situation in Ethiopia. Concept, Status and Trends. In: T Assefa (ed.)
Food Security through Sustainable Land Use. Proceedings of the First National
Workshop of Novib Partners (Forum on Sustainable Land Use). Addis Ababa. 1999.
- FDRE. (Federal Democratic Republic of
Ethiopia) Food Security Strategy. Updated version. Addis Ababa.2001.
- Gassmann F and C Behrendt Cash Benefits in
Low-Income Countries: Simulating the Effects on Poverty Reduction for Senegal
and Tanzania. Discussion Paper No. 15, Issues in Social Protection. Geneva,
Switzerland: International Labour Office.2006.
- Gujarati DN Basic Econometrics. Fourth
Edition. McGraw- Hill, New York. 2003.
- Hosmer DW and S Lemeshew Applied Logistic
Regression. A Wiley-InterScience Publication, New York. 1989.
- Pindyck S and L Rubinfeld Econometric Models
and Economic Forecasts, Second Edition. McGraw-Hill, New York. 1981.
- Maddala GS
Limited Dependent and Quantitative Variables in Econometrics. Cambridge
University Press. 1997.
- Bigsten
A, Kebede B, Shimelis A and M Taddesse Growth and poverty reduction in
Ethiopia: Evidence from households panel surveys. World Development 2007; 31 (1): 87-106.
- Dercon S Economic reform, growth and the
poor: Evidence from rural Ethiopia. Journal of Development Economics 2006;
81 (1): 1-24.
- MoFED. Ministry of Finance and Economic
Development. Ethiopia: Building on Progress - A Plan for Accelerated and
Sustained Development to End Poverty (PASDEP) (2005/06-2009/10) Volume I: Main
Text, Addis Ababa. 2006.
© Copyright 2009 - Rural Outreach Program
|
