 |
| About Bioline | All Journals | Testimonials | Membership | News |
|
||||||
|
||||||
African Journal of Food, Agriculture, Nutrition and Development, Vol. 10, No. 7, 2010, pp. 1-20 Article NUTRIENT INTAKE AND ADEQUACY OF BATSWANA ELDERLY Maruapula SD1* and K Chapman-Novakofski2 1Department of Home Economics, University of Botswana, P/Bag 00702, Gaborone,
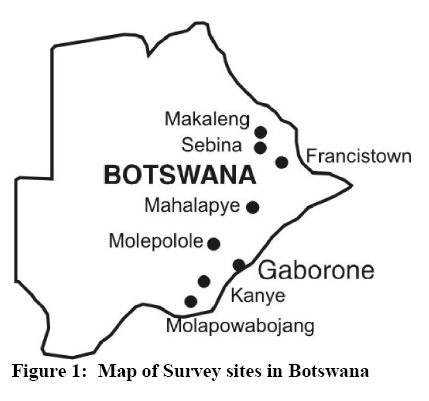
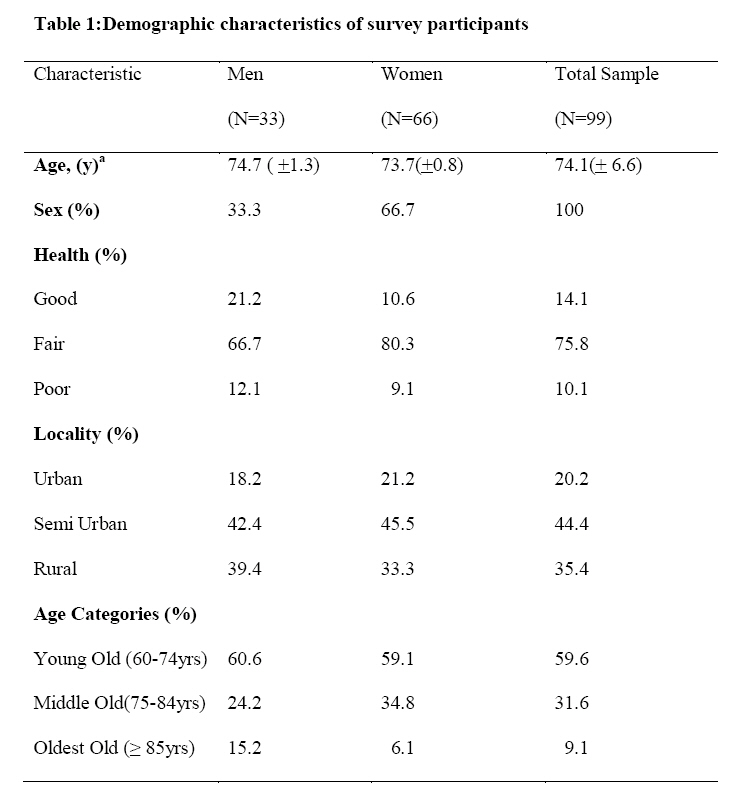
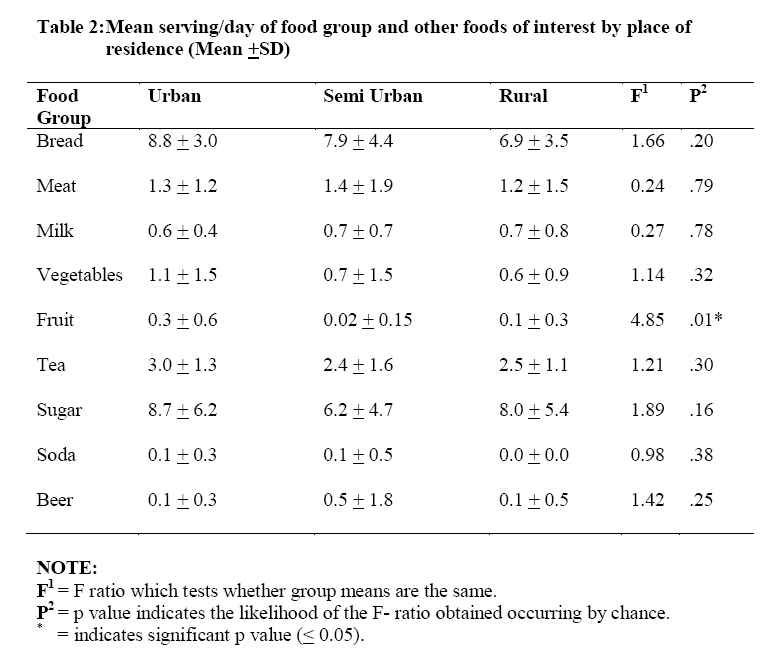
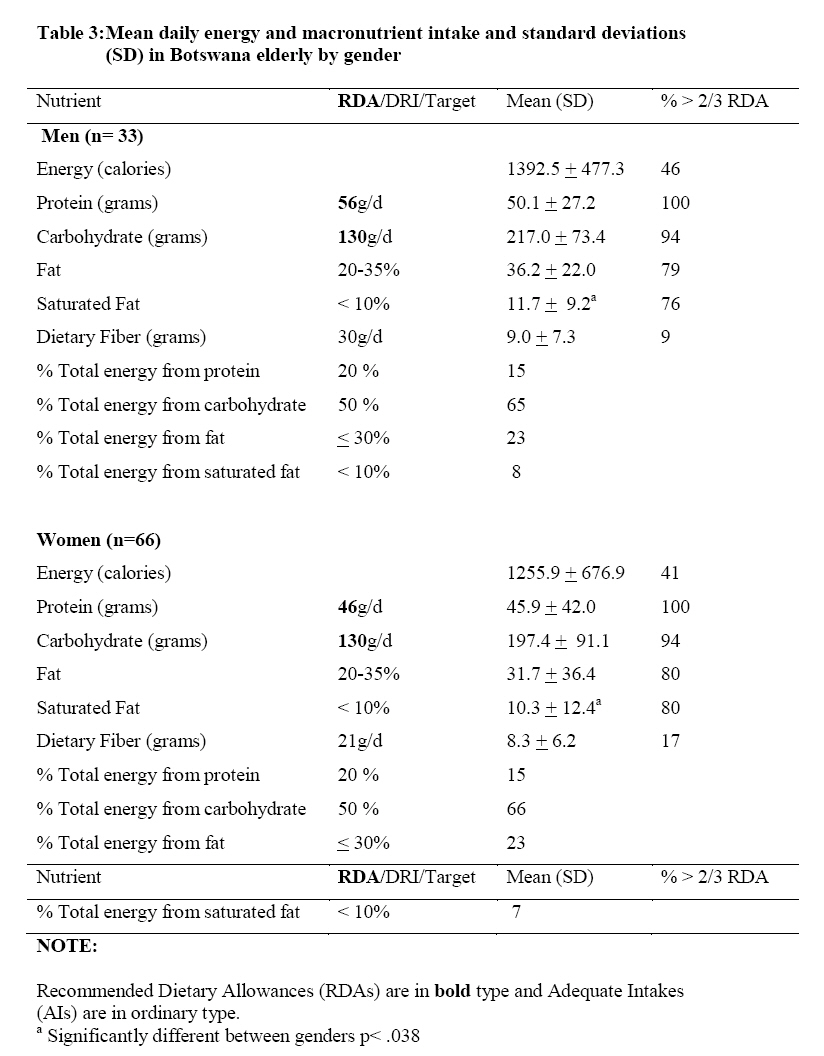
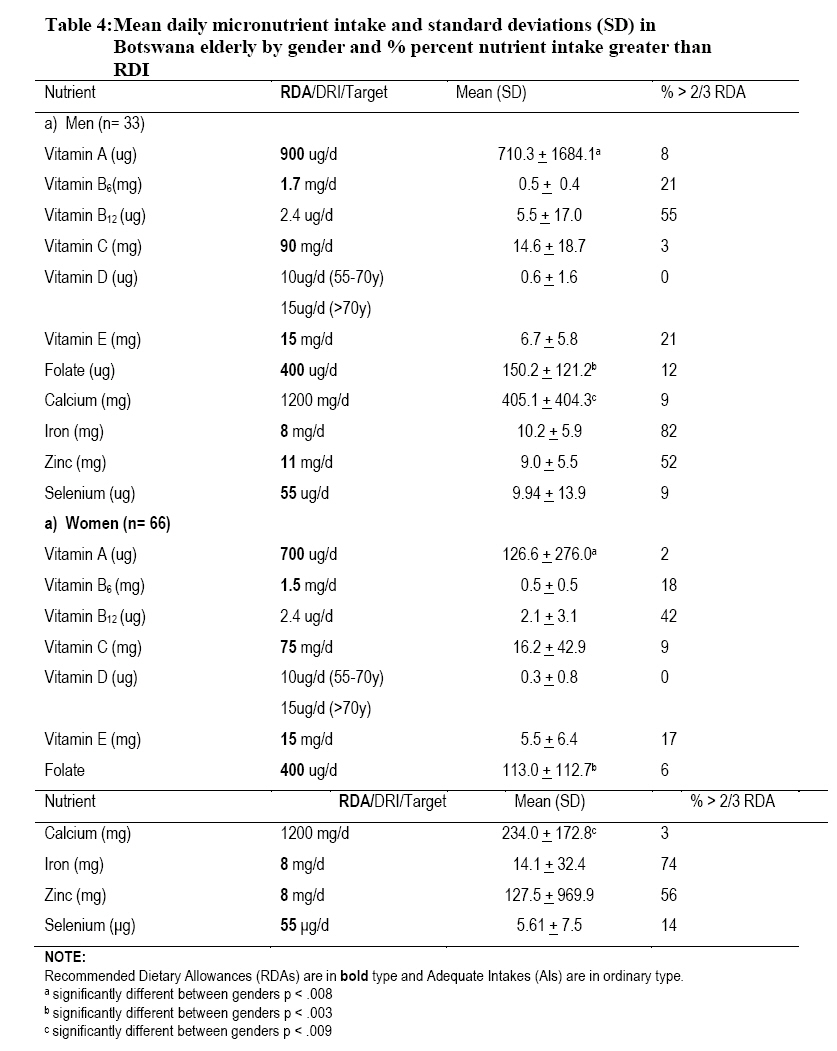
Botswana. *Corresponding author email: maruapu@mopipi.ub.bw Code Number: nd10068 ABSTRACT The purpose of this study was to determine the adequacy of nutrient intakes of the elderly in Botswana and to further assess intake by age, gender, and locality and others. The study was a cross-sectional survey with a convenience sample in purposively selected urban, semi-urban and rural settings in Botswana. Data collection included self-reported assessments of health status and food intake. Analyses compared demographic strata and health status with the intake and adequacy of self-reported consumption. A total of 99 elderly aged 60 to 99 years completed a 24-hour food recall instrument and in addition, demographic, health status, and cooking responsibilities data were collected from each respondent. Results from the survey show that 14% of the elderly rated their health as good, 76% indicated they were in fair health and 10% in poor health. The mean number of servings of food groups and some individual foods common in the daily diet show that the Grains group was the only food group whose mean intake (7.7 servings /day) was within the US recommended 6-11 servings per day. Fruit consumption was very poor (0.1 servings/day) and differed significantly by locality (p< .01), as the urban elderly had a higher consumption of fruits, but still much lower than the recommended intake. The contributions of protein, carbohydrate and fat to total energy were 15%, 66%, and 22% respectively. Adequate energy intake did differ significantly (p < .049) by self-health rating. Mean macronutrient intake differed significant by gender only for saturated fat (p< .038). Micronutrient intake differed by gender for vitamin A (p< .009), calcium (p < .01) and folic acid (p< .027). Consumption of adequate vitamin A was significantly associated with gender and cooking responsibilities. Self-health rating was also significantly associated with adequate consumption of vitamin B12 (p< .027), selenium (p< .001) and zinc (p< .009). In conclusion, Batswana elderly had poor nutrient intake associated with self-health rating, gender, and cooking responsibilities. Key words: Elderly, Botswana, diet, nutrient, health INTRODUCTION The process of ageing exposes older people to health, social, psychological, and economic problems that may compromise nutritional status, and affect the quality of their life [1]. Choosing a nutrient-dense diet is one of the many challenges faced by the elderly. It is important to assess nutrient intake and adequacy in the diet of the elderly in order to appropriately address their health and nutritional needs [2]. Many developing countries have little information concerning the nutritional status of the elderly. Most programs in these countries are focused on health and nutrition interventions for women of child-bearing age and children and only a few programs, if any, are targeted to the increasing and yet vulnerable elderly population. In a few African countries that have conducted research on nutrition and diet of the elderly population, many elderly had low energy, protein and vitamin and mineral intakes [3, 4, 5]. Botswana, like her African counterparts, has limited information on nutritional status of the elderly population, with most effort focusing on infants and children. According to a study of elderly in Botswana, whose aim was to investigate whether food variety is associated with physical and cognitive functioning among older persons in Botswana, and to develop a set of screening questions to predict diet variety, the diet of elderly Batswana lacked variety [6]. The elderly had one or two meals, 59% and 22% did not consume any of the listed fruits and vegetables, respectively, at least once weekly, while 33% did not consume foods from the milk and dairy group. A limitation of the Clausen study was that it could not determine nutrient adequacy due to the use of a food frequency questionnaire which was not quantified. In assessing the elderly Botswanan’s diet with the Healthy Eating Index, researchers found adequate intake of grains, but poor variety and intake of milk, vegetables and fruit [7]. A secondary analysis of dietary data found six dietary patterns using factor analysis. Church-goers, older females, and the elderly who lived with grandchildren were less statistically associated with the Beer pattern. Those living with grandchildren were associated with the Vegetable and Bread pattern as were those living in towns. Those who reported being widowed were less likely to consume meat/fruit (P < .005) [8]. These findings were parallel to those found in South African elderly where the primary food consumed were the grains but the diet was otherwise nutrient deficient [9] These researchers also reported zinc deficiency among these 170 elderly South Africans [10]. Other researchers have reported a lower nutrient intake as the amount of added sugars increased in the elderly South African [11]. Other studies have focused on the health and welfare of the elderly [12, 13, 14, 15]. Clausen et al. [12, 15] concluded that while most reported their health as fair or good, about 25% reported serious health problems, the major conditions being related to the musculoskeletal system. Fry [13] found that self-reported well-being, health and physical capacity declined with age in Botswana, with the consequence of it being difficult to obtain food without relying on others. Shaibu and Wallhagen [14] reported that although the elderly could receive a pension from the government, the amount was not sufficient to provide adequate support, and that families also may not be able to provide adequate and acceptable support. Hence, there is need to elicit additional information on the health and nutritional situation of elderly in Botswana, given such an information gap. This concept is in line with the Framework for a Long Term Vision for Botswana [16] whose one strategy among others is to build “a just and caring nation”. Under the auspices of this strategy, Batswana should have access to quality health care, and in addition, adequate nutrition, quality sanitation and an adequate supply of potable water. Furthermore, Vision 2016 perceives the elderly as a human resource who are custodians of the country’s culture, values and wisdom and its history. In addition, one of the identified themes of the National Plan of Action on Nutrition [17] is to care for the socio-economically deprived and nutritionally vulnerable groups in society. Older persons fit this category as they are nutritionally vulnerable and also socio-economically deprived. Given that there are no documented studies on the nutrient intake of the elderly, the objectives of this study therefore, were to describe nutrient intakes of the elderly in Botswana, to compare differences in intake by age, gender, and locality, and to evaluate adequacy of several nutrients of particular concern to the elderly. SUBJECT AND METHODS Study Design and Subjects The current study was a cross-sectional survey using focused interviews, and was conducted 2003 in southern, eastern and central Botswana in several villages, urban villages, and town/cities as a follow-up to the 1998-1999 study on the Health and Nutrition of the Elderly in Botswana conducted by University of Botswana’s National Institute of Research and Documentation and the University of Oslo, Norway. Participants were recruited based on geographical strata. Two towns were chosen to represent the urban stratum: Gaborone, the capital city of the country, and Francistown to represent other towns. The urban village stratum was represented by Kanye, Molepolole, and Mahalapye. Finally, Makaleng, Molapowabojang, and Sebina represented rural villages. All theses towns and villages are in eastern and southern Botswana (figure 1). Due to time limitations no villages and towns were selected from north and west Botswana. A convenience sample of 99 males and females, aged 60 years and above was recruited through post offices and other places where the elderly collected pension monies. The elderly gave verbal consent to participate in the study. The University of Illinois’ Institutional Review Board and the Office of the President of the country of Botswana approved the study protocol, while Post Office authorities gave permission for the use of their premises to carry out interviews. METHOLODGY Dietary Intake Assessment Food consumption was assessed using 24-hour food recalls through face-to-face interviews conducted primarily in Setswana and occasionally in English privately within the post office premises different from privately outside the post office or at the kgotla (the village meeting place). Individuals were asked to recall all foods they ate the previous day from the time they woke up to bedtime. Household measures such as cups, bowls, and spoons were used to help estimate quantities of foods consumed. Quantities were recorded according to the amount of a particular bowl, for instance, ½ of the small brown bowl. In cases of casseroles or combined foods, respondents were asked to estimate the individual food constituents. When interviewees gave answers like “I used a little or a lot of milk in tea”, and were asked to show on the cup about how much was used, the cup volume was later measured to estimate a ‘little’ and a ‘lot’ of milk. After the interviews were completed, most commonly eaten foods were reproduced in the university kitchen to improve accuracy of estimation. Interviews were conducted in Setswana, the local language between June and August 2003 by an investigator who is fluent in both languages, and were recorded and transcribed into English. The nutrient composition of foods from Botswana was determined mainly from the Medical Research Council (MRC) Food Composition Tables [18]. The South African food composition tables were used as Botswana imports almost all of her food from South Africa. For foods and nutrients not present in the South African food composition tables, other food composition tables were used [19]. Dietary data were added to the Nutritionist Five Data Base (Version 2.3; First Databank, San Bruno, CA, 2000) as part of its international foods. Nutrient intake was computed using the Nutritionist Five Software. Demographic and Health Data In addition, demographic information was obtained including gender, age, place of residence, self-reported health, and cooking responsibilities. Birth dates for the elderly were obtained from the National Identity Card (OMANG card), issued to all citizens of Botswana aged 16 years and older. This eliminated the burden on the elderly to recall their birth date. Health status was assessed using a self- reported health evaluation. Respondents were asked to rate their health by choosing from three health states, which ranged from being healthy to being incapacitated. Statistical Analysis The food intake data and demographic information were analyzed using SPSS/PC software (version 13; SPSS Inc, Chicago, IL). Mean and standard deviation (SD) of the five food groups, energy, macronutrients, and micronutrients were determined from dietary intake data. The vitamins and minerals selected are those known to be significant for the older population [20]. In addition to food groups and nutrients of interest, foods frequently consumed that did not fit into a food group were as assessed from the diet recalls were also analyzed [8]. The US Dietary Reference Intakes (DRI) were used because Botswana has no nutrient recommendations for the elderly or the general population [21, 22, 23, 24, 25]. A comparison of the World Health Organization/ Food and Agriculture Organization (WHO/FAO) nutrient recommendations [26] to the US/Canada nutrient recommendations for older men and women are similar [27]. The lack of recommended intakes for the elderly in general and those in developing countries in particular requires additional research. Disparities between the WHO/FAO and US/Canada recommendations that may affect our results are discussed in limitations. However, use of the US DRI has been acceptable with nutrient intake studies of African people [28, 29, 30] Mean intakes and servings were evaluated for normality (Levene’s test) and equality of variance (Kolmogorov-Sminorf test). If the distributions of means were normal and of equal variance, the t-test for independent samples was used to assess differences between two means and ANOVA was used to examine differences between multiple means. For distributions that violated the assumptions of normality and homogeneity of variance, the Mann-Whitney and Kruskal Wallis non-parametric tests were used to compare two or three independent means respectively. The Mann-Whitney test was used as a post-hoc procedure for statistically significant results (p< .05) for the Kruskal-Wallis test. A Benferroni correction was applied to control for Type 1 error, therefore, all effects are reported at the level of significance obtained by dividing the p value of .05 by the number of groups being compared. Odds ratios were calculated to explain significant differences between gender when they existed. The percentage of elderly with adequate nutrient intake was ascertained. Adequate consumption was considered to be 67% or more of the DRI for a particular nutrient. The Pearson Chi Square test (X2 ) was used to establish the association of adequate intake with gender, age categories, locality, cooking responsibility and self-reported health. For all tests, a p value less than .05 was considered significant. RESULTS Demographic characteristics of the participants of the study are summarized in table 1. There were more females than males in the study (2:1 ratio). The mean age for the study population was 74 years ± 6.6 SD, with ages ranging from 66 to 99 years. The percentage of the elderly by geographic location was 44% semi-urban, 35% rural and 20% urban. Only 14% of the elderly rated their health as good, 76% indicated they were in fair health and 10% in poor health. Dietary intake and nutrient adequacy Food and Food Groups Mean servings of food groups and some individual foods common in the diet of participants are presented by locality in table 2. The mean daily servings per food group were: grains, 7.7 servings (SD = 3.9); meat, 1.3 servings (SD = 1.7), milk, .7 (SD = .7); vegetable, 0.8 serving (SD = 1.3); and fruit, 0.1 serving (SD = .4). Grains were the only food group whose mean intake met the US recommended 6-11 servings per day [31]. Consumption for all other food groups was below the recommended servings per day. The mean intakes for other foods commonly consumed by the elderly were sugar, 7.7 tsp (SD = 5.3); tea, 2.6 cups (SD = 1.4); beer, 0.3 servings/day (or 102 ml) (SD = 1.3); and soda, 0.1 servings/day (or 34 ml) (SD = .4). Most elderly drank about 3 cups of tea and used about 8 teaspoons of sugar per day. The mean servings of vegetable were higher for those elderly who had someone else cooking for them (p< .017). Fruit consumption differed significantly by locality (p < .003), with urban elderly consuming more fruits compared to those in urban villages/semi-urban (p<.004). Meat consumption differed significantly by self-reported health only for those reporting poor health (p< .01). Beer consumption differed by gender (p<.046) with men drinking more beer than women. Macronutrient intake The mean daily intake of energy, macronutrients (carbohydrates, protein and fat) and selected nutrients important for elderly nutrition as stratified by gender are presented in table 3. The contribution of protein, carbohydrate and fat to total energy were 15%, 66%, and 22% respectively. There were no gender differences in energy and macronutrient intake except for saturated fat (p< .038). Elderly males had higher intakes of saturated fat than females. Most elderly (54% males, 59% females) did not have adequate energy intake. Both protein and carbohydrates were consumed in adequate amounts by the elderly. Fiber consumption was inadequate by both gender (91 % males and 83 % females). Most elderly did meet the US recommended intakes for fat (calories from fat < 30% of total calories), saturated fat (calories from saturated fat < 10% of total calories), and cholesterol (intake < 300 mg/day). Although there were no gender differences in macronutrient intake, energy intake did differ significantly with self- health rating (p < .046). Micronutrient intake Table 4 presents intakes of minerals and vitamins. Gender differences were found for calcium intake (p < .009). There was a tendency for mean intake of selenium to differ by who cooked for the elderly (p< .054), and for mean iron intake to differ with self reported health (p< .051). Males had significantly higher mean folate (p < .003) and vitamin A (p < .008) intakes than females. Also, the elderly who cooked for themselves had less folate intake than those who had other people cooking for them (p < .029). More that two-thirds of the elderly had adequate iron intake, slightly more than half had adequate intake of zinc and 55% of the males had adequate vitamin B12. There was a significant association between gender and whether the elderly consumed adequate vitamin A (p < .002). Based on the odds ratio, elderly men were 18 times more likely to have adequate vitamin A than females. The elderly who had others cooking for them were more likely to have adequate vitamin A intake than those who cooked for themselves (p< .002). Self-health rating was significantly associated with adequate consumption of vitamin B12 (p< .027), selenium (p< .001) and zinc (p< .009). The elderly who reported their health to be poor were more likely to have inadequate vitamin B12, selenium and zinc intake. DISCUSSION The food group analysis supports the conclusion that the diet of the elderly is poor, lacking in variety as only the grain group met the US recommended intake. A study by Clausen, et al found similar results for Botswana elderly documenting very low fruit (1.7 times/week, SD = 2.6) and vegetable intake (3.5 times/week, SD = 3.8). He also found that the elderly ate meat (2.5 times/week, SD = 3.2) and did not drink milk frequently [6]. Poor fruit and vegetable intake was possibly exacerbated by the seasonality effect as the study was conducted in the dry season. Traditional vegetables are in low supply in the dry season compared to the rainy season when most households have access to vegetables and fruits they grow and those growing in the wild. The mean energy intake for males (1393, SD= 477) and females (1256, SD = 677) are much lower than reported intakes for other African elderly. The mean energy intake for the elderly participating in a study in Tanzania was greater than 2000 kcal/day [32]. In another study of an urban black population in Cape Town, the mean energy intakes were 1732 kcal/day and 1228 kcal/day for males and females respectively [4]. Low energy intake is a cause for concern, as studies have shown a high relationship between energy intake and diet quality. It is impossible to meet micronutrient requirements on energy deficient diets. Low energy intakes and poor fruit and vegetables consumption are highly correlated with micronutrient intake [33, 34]. The contribution of 65% carbohydrate, 23% fat and 15% protein to total energy is comparable with diets of elderly in South Africa [4, 35] and Tanzania only for carbohydrates and protein [32]. In these diets more than 50% of energy was supplied by carbohydrates, total fat was less than 30% and protein was less than 15%. The distributions show that carbohydrates are still the main source of energy for African elderly. Despite low energy intakes, both men and women had adequate protein intake. This is surprising given the low intake of 1.3 servings and 0.7 servings per day of meat and dairy respectively, the major sources of protein. A possible explanation could be additional proteins contributed by sorghum and maize which are the main sources of carbohydrates for the elderly. Low micronutrient intake by the elderly is comparable to that found in other elderly studies in Africa. According to a study by Charlton and others, mean micronutrient intake for several groups of older persons in South Africa did not meet the RDA for vitamin D, calcium and zinc. Furthermore, South African blacks from Cape Town had low micronutrient intakes compared to whites and colored groups [36]. The low intakes of micronutrients in this study are attributed to low energy intakes and poor consumption of fruits and vegetables. Low micronutrient intakes of vitamin B6 , vitamin E, selenium and zinc are of concern as these nutrients are important in the immune function. Aging also affects the functioning of the immune system, contributing to increased morbidity and mortality from cancers and infectious diseases [37]. Therefore, it is important that the elderly have adequate intake of these micronutrients so that their immune function is not compromised. A properly functioning system is also important for the elderly in Botswana, a country with high prevalence of HIV/AIDS, a disease due to impaired immune function [38]. Iron is the only micronutrient with intake above the recommended two-thirds of the RDA. Adequate iron intake is important to prevent iron deficiency which is implicated in an impaired immune system and also tiredness in the elderly [39]. Adequate iron intake in this study is probably due to beef and sorghum grain as its major sources, because the contribution of fruits and vegetables were low. Previous studies have attributed high plasma iron levels for Southern African blacks due to the using cast iron pots which leak iron into foods, and the consuming traditional beer brewed with sorghum [40]. Alcohol consumption could not have contributed any significant iron as it was minimal, and the use of iron pots was not verified in this study. Meats and grains are also the primary sources of iron in American diets. Iron obtained from meat plays an important role as it is better absorbed than other forms of iron found in the diet [39]. Zinc and vitamin B12 intakes were consumed in moderate amounts as 50% of the elderly had adequate of these nutrients. A limitation of the study is that mineral and vitamin supplementation was not determined. Low calcium intake is also similar to intakes of elderly blacks in South Africa, Tanzania and the US. South African blacks in Cape Town were found to consume 424 mg/day of calcium, far less than the RDI [4]. Another study of black elderly in the Free State found their mean intake of calcium to be 513 mg/day, still below the RDI. African American elderly were also found to consume less calcium than non-Hispanic whites and Mexican American elderly [41]. Such low intake was corroborated by Mineral Intakes of Elderly Adult Supplement and Non-Supplement Users in the Third National Health and Nutrition Examination Survey, which found that more than 80% of elderly African American had calcium intake below the RDI [42]. Poor calcium intake is a probably due to low consumption of foods from milk and dairy group and the vegetable and fruit groups. The implications of inadequate calcium intake are serious given the important role of this mineral in maintaining bone health and blood pressure. The elderly are thus at increased risk for osteoporosis, a debilitating bone disease that increases with aging and affects elderly women more than men [43]. Although low consumption of vitamins and minerals prevails among the elderly, males had higher mean intakes for calcium, folic acid, and vitamin A than females. This gender differential in micronutrient intake needs to be investigated as no differences were found secondary to overall calorie differences. Some studies have suggested that the differentials between men and women are due to the greater likelihood of elderly women than men living alone [44]. Living and eating alone are thought to influence diet quality in adults aged 50 years and above [45]. Another reason for the gender differential in nutrient intake is attributed to high prevalence of morbidity among women. Women even in this study were more likely to report poor health status than men [46]. A few limitations to this study include the use of one-day diet recalls instead of two or three days of diet recall. A single day recall may not give full information on habitual intake of elderly given the day to day variation in food selection. Future research should try a three day recall including a weekend day to provide a more complete picture of the elderly diet. Again, seasonality was not accounted for in this study although food intake especially fruits and vegetables might differ by wet or dry season. Although seasonality was not a factor in intakes of the elderly in Tanzania [32], it might be a factor in a country like Botswana with poor rainfall, contributing to different intake of fruits and vegetables depending on the season. The convenience sample we used also may not truly reflect all elders in Botswana. The nutrient recommendations for comparison were those of the US/Canada. Those developed by the WHO/FAO differ slightly, with lower recommendations for vitamins A and C, magnesium, zinc, and selenium. Thus, our results may have over-emphasized any intake deficiency for these nutrients. However, WHO/FAO recommendations for vitamin D, calcium, and iron are higher, and our results may have minimized the true levels of deficiency. Unfortunately, WHO/FAO recommendations do not cater for the older persons as far as macronutrients are concerned. Finally, self-reported health may not reflect true health status but has been used by others [12, 13, 14, 15]. When the focus is overall health status, additional measures should be used to validate the results by triangulation [47]. In conclusion, nutrient intake for the elderly is inadequate in both energy and micronutrients. Elderly Batswana, although consuming diets high in carbohydrates, have inadequate energy intake. It is difficult to meet nutrient requirements when energy intake is low. The large number of the elderly with inadequate intake of most micronutrients places them at risk of deficiencies for most of these nutrients. This has implications for a country where HIV/AIDS is pandemic. Further research is needed to investigate micronutrient malnutrition in the elderly, especially the gender differences in intake. In addition, nutrition education, food fortification and supplementation strategies are needed to improve nutrient adequacy for the elderly. These strategies need to be investigated for feasibility and efficacy to make better the diet of elderly Batswana. ACKNOWLEDGEMENT Many thanks go to the post office officials and staff at post offices in the towns/cities and villages visited for allowing us to perform the study there, and to older persons who agreed to participate in the study. The College of Agricultural, Consumer, and Environmental Sciences, University of Illinois at Urbana Champaign sponsored the study. REFERENCES
Copyright 2010 - African Journal of Food Agriculture, Nutrition and Development The following images related to this document are available:Photo images[nd10068t3.jpg] [nd10068t4.jpg] [nd10068f1.jpg] [nd10068t2.jpg] [nd10068t1.jpg] |
| |||||||||
