 |
| About Bioline | All Journals | Testimonials | Membership | News |
|
||||||
|
||||||
African Journal of Food Agriculture, Nutrition and Development, Vol. 10, No. 9, September, 2010, pp. 4016-4031 Article Micro level impact of national Fadama 11 project on rural poverty in IMO state, Nigeria CI Ezeh1, IN Nwachukwu2 1 Department of Agricultural Economics and Extension, Abia State University, Umuahia Campus, Umuahia, Abia State, Nigeria Correspondence Address:C I Ezeh, Department of Agricultural Economics and Extension, Abia State University, Umuahia Campus, Umuahia, Abia State, Nigeria chimaezeh@yahoo.com Code Number: nd10093 Abstract The issue of poverty in Nigeria has been described as pervasive and palpable on the people especially the rural dwellers. This is in spite of the country's vast natural and human resources. Poverty is not only a state of existence but also a process with many dimensions and complexities. It has been estimated that poverty in Nigeria will increase by two-thirds with the possibility of 60% of the population living below poverty line in ten years. Consequent upon the foregoing, this study determined the micro level impact of national Fadama II project on rural poverty in Imo State, Nigeria. Specifically, it sought to describe the socio-economic characteristics of the beneficiary and non beneficiary farmers in Imo state; determine the poverty line, poverty incidence and poverty gap between the Fadama II and non Fadama II farmers; determine the effect of the programme on participants' farm income, output and farm size A multi-stage random sampling technique was used to select 240 (120 apiece for Fadama II and non Fadama II farmers) respondents from which input-output data were collected. Instrument of data collection was through a set of structured and pre-tested questionnaire. The study employed mean and frequency counts, poverty parameters and paired t-test statistic as analytical tools. The results of the analyses showed that poverty incidence was 0.5367 and 0.3215 for Fadama II and non Fadama II farmers respectively while the poverty gap was 0.0337 and 0.1113 for Fadama II and non Fadama II farmers respectively. The result of the Paired t-test showed that the national Fadama II Facility impacted positively and significantly on the beneficiaries' output level, income level and labour use level at given levels of significance. It was however recommended that Farmers should be given increased access to Fadama lands to help boost agricultural output and reduce endemic poverty. Keywords: Impact, Fadama, Poverty Analysis, Nigeria Introduction In Nigeria, poverty and its excruciating impact are pervasive and palpable on the people, especially the rural dwellers [1]. With the projections made by the World Bank that poverty in Nigeria will increase by two-thirds, with the possibility of 60% of the population living below the poverty line in ten years, the Government of Nigeria adopted the concept of poverty alleviation as a major thrust of its annual budget since 1996 [1]. In order to raise the standard of living of the people and instill in the poor people some sense of belonging, several Nigerian governments have adopted and implemented various poverty alleviation programmes. Fadama, the Hausa name for irrigable land, refers to flood plains and low-lying area underlined by shallow aquifers and found along Nigeria′s river systems. Fadama also refers to a seasonally flooded area used for farming during the dry season. As such, all year round agricultural production could be achieved. Crops grown on the Fadama include rice, maize, leafy vegetables, okra to mention but a few. Fadama II is a follow up to Fadama I (phase I of the National Fadama Development project), which was implemented during the period 1993-1999. Fadama I focused mainly on crop production and largely neglected support of post production activities such as commodity processing, storage and marketing (downstream agricultural sector). The emphasis was on providing boreholes and pumps to crop farmers through simple credit arrangements aimed at boosting aggregate crop output. The project was World Bank assisted and aimed at sustainably increasing the income of all users of Fadama resources and to reduce conflict amongst them [2]. It is believed that the provision of this facility should not only boost agricultural production but enhance the income of the farmers and thereby lift them out of the vicious cycle of poverty [3]. For effectiveness, Fadama has five components viz capacity building, pilot asset acquisition support, rural infrastructure investment, demand-driven advisory services and project management, monitoring and evaluation. For the success of any poverty alleviation programme, however, knowledge of the profile of poverty in that society is essential. Studies have shown that agriculture is the locus of majority of poverty alleviation programmes in Nigeria [4]. This is obvious because agriculture remains the mainstay of Nigerian economy, contributing about 40% of the total GDP, and employing about 77% of the working population [3]. Although oil earns the greatest revenue for the federal government, its employment capacity is small compared to the agricultural sector. It is thus imperative that appropriate policy measures aimed at alleviating poverty must take agriculture into consideration. In fact, studies have shown that poor families are in higher proportion in farming households who are mainly in the rural areas. Regions where agriculture is the major source of employment have the higher incidence of poverty [5],[6]. One of the suggested ways of reducing poverty is utilizing the unimproved resources of the farmers for improved income earnings and living standard. In other words, it will enable the rural poor to increase their level of production of economic goods as well as their income level which translates into enhanced standards of living. This can be achieved by enabling the poor farmers to increase their agricultural output, so as not only to improve their incomes but to lift them above subsistence level. By achieving these objectives, the welfare of the rural households will be improved with the attendant multiplier effect on the participating community as a whole. The specific objectives of the study were therefore to:
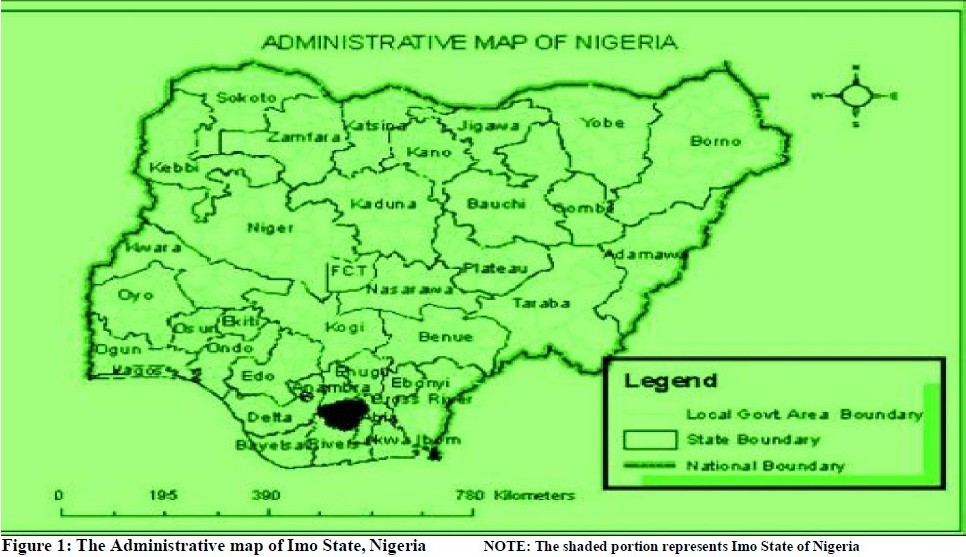
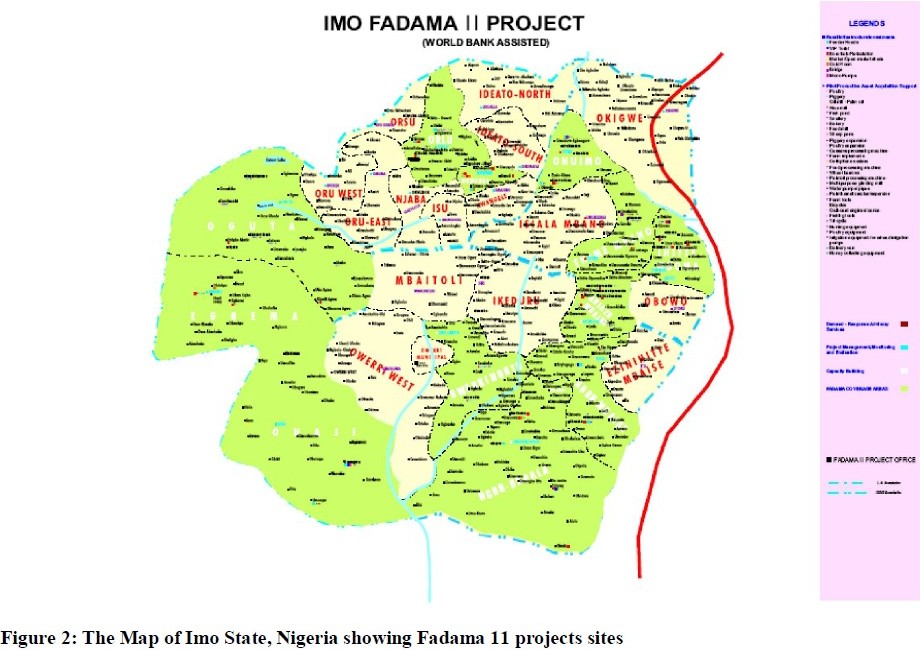
Methodology The study area was Imo State and conducted in 2007. The state was purposively chosen because it was the only State in the whole of South South and south-eastern political zones of Nigeria that benefited from the National Fadama II facility. Imo state lies between latitudes 5 o 10′ and 6 o 35′ north of the equator as well as between longitude 6 o 35′ and 7 o 35′ east of the Greenwich meridian [7]. All the three agricultural zones (Orlu, Okigwe, and Owerri) were involved in the study. Multi-stage random sampling technique was used in the selection of sample. In stage one, one local government area (LGA) was selected at random from each agricultural zone. The selected local government areas were Onuimo (Okigwe zone); Aboh Mbaise (Owerri zone) and Oguta (Orlu zone). In the second stage, 4 Fadama practising communities were chosen randomly from each of the selected local government areas, thus giving a total of 12 communities. The third stage involved random selection of 10 Fadama II participating farmers from each of the 12 communities, thus giving a final sample size of 120 respondents. To provide for the non-fadama II participating farmers, another set of 120 farmers were randomly selected from the communities where the Fadama farmers were chosen, bringing the cumulative sample size to 240. The data for this study were collected using cost route technique, which is simply described as the collection of data at the time the farmer is performing each operation. It also involved the use of two sets of detailed, pre-tested and structured questionnaire administered on the two selected groups of farmers. The various analyses carried out include the use of mean and frequency counts, poverty parameters, and paired t-test. Mean and frequency counts were used to achieve objective one; Poverty parameters were used to analyze and draw inference on objective two while paired t-test was used to achieve and realize objective three. In estimating the extent of poverty among the two groups of farmers, the following equations were used according to other studies [8],[9]. H = q/n ……….. (1) where H = head count ratio (Poverty incidence) q = number of poor farmers in each group (that is those earning below the poverty line) n = total number of rural farmers in each group Poverty depth was measured with poverty gap index Q = [(Z – Y)/Z] …………..(2) Where: Q = Poverty gap Z = Poverty line Y = Average income of the poor rural farmers in each group NB: Poverty line was estimated in this study by using mean household expenditure in line with previous studies. The national minimum wage is pegged at N 7,500 (~US$62.5) and applies to only urban wage earners, civil servants and those in formal employment. There is a wide disparity in wage between the rural and urban Nigeria. The national minimum wage does not apply to the rural areas. More so, quantification of minimum rural wage is difficult because of lack of data, unwillingness of the ruralites to disclose their wage and tax status. As such, a number of studies in Nigeria resort to the use of mean expenditure as poverty line. This is also consistent with the simple Keynesian theory which stipulates use of income as a function of consumption [10]. Paired treatment test (paired "t" test) was used in line with an earlier study [11]. It is stated as follows:
where t = paired t statistic S21 = Variance of parameters of Fadama farmers S22 = Variance of parameters of non Fadama farmers n1 = number of selected Fadama farmers n2 = number of selected non Fadama farmers Hypothesis Tested Ho: There is no significant difference on effects between the income level, output level, farm size and labour use level of the Fadama farmers and non Fadama farmers. Results The mean values of the socio-economic variables are shown in [Table - 1]. The table shows that the mean age of Fadama II participating farmers was 44 years while that of the non Fadama II participating farmers was about 45 years. The mean number of years spent in school [Table - 1] shows that Fadama II farmers spent about 13 years in school while the non - Fadama II farmers spent a mean of 8 years in school. [Table - 1] also indicates that the respondents involved in Fadama II farming had a mean farming experience of 14 years compared 11 years for those non Fadama II farmers. The mean size of farmland cultivated by the households was 0.86ha for Fadama II farmer participants and 0.84ha for non Fadama II participants. However, household size of both groups of farmers was 6. The distribution of the respondents′ farm income shows that the mean farm income for Fadama II farmers was N160, 333.53 (~US$306.11) while that of the non Fadama II farmers was N8, 433.83 (~US$75.29) per annum. Furthermore, the result [Table - 1] on the output levels indicates that the Fadama II farmers had a mean output of 7538.63 kg of farm output while the non Fadama II farmers had a mean output of 5427.97 kg of farm output. [Table - 2] shows the distribution of the respondents according to value of monthly expenditure pattern while the Poverty indicators of Fadama II farmer participants and non Fadama II farmers in Imo State, Nigeria are shown in [Table - 3]. The mean monthly household expenditure of the Fadama II farmers and non Fadama II farmers were The Poverty gap (Poverty depth), also known as the income shortfall allows for the assessment of the depth of poverty among the Fadama II and non Fadama II farmers in Imo State, Nigeria. The poverty gap for the Fadama II farmers was 0.0337 while that of the non Fadama II farmers was 0.1113. The result on the paired t-test for differences in farm output, farm incomes, farm sizes and labour use level between the Fadama II and non Fadama 11 farmers in Imo State, Nigeria is shown in [Table - 4]. The table reveals that the mean output of Fadama II farmers (Pair I) was 7538.6333 kg while that of the non Fadama II farmers was 5427.9667 kg. The mean difference was 2110.6667 kg. This is statistically significant at 5 percent probability level with a calculated t-value of 2.157. Also, the mean value of farm income for Fadama II farmers (Pair 2) was Discussion The implication of the result with respect to age implies that both groups of farmers were within the middle-aged groups which were still energetic and productive. This segment of the respondents within these mean ages is rational decision makers and time is still at their disposal to establish indelible reputation within the community [12],[13]. This result indicated a rather decreasing number of the very old and aged population in our rural areas [9]. This will impact positively on agricultural production because this segment of the population can effectively withstand the rigours, strain and stress involved in agricultural production. The results further showed that literate farmers in both categories of farmers grossly dominate the study area. The level of education attained by a farmer not only increases his/her farm productivity but also enhances ability to understand and evaluate new production technologies [14]. The ability to read and write would enable both groups of farmers to better utilize effectively and efficiently whatever resources exist in the area. It could be deduced that both groups of farmers had reasonable wealth of years of farming experience. Experience has been shown to enhance more efficient use of scarce resources by smallholders in Nigeria [9]. Farmers in Nigeria are predominantly smallholders with average farm size of between 1 and 2 hectares [15]. It is even small in Eastern states of Nigeria where population pressure is more acute, with reference to Abia state where average farm size was 0.2 ha. The paucity of the units of production leaves the farmers little or no chances of taking advantage of modern agricultural techniques. Although land is a constraint in some communities, inadequate finance for the acquisition of farm resource inputs and for payment of hired labour has been identified as a major constraint to increased farm land in most communities where land is not a limiting factor. Hence the proportion of cultivated area in a given season may be relatively small [16]. Household size has major implications in the provision of labour for farm work [13]. Although emerging economic realities and deepening poverty levels have forced rural households to embark on family planning measures, the tradition of marrying many wives with the associated large household sizes for the provision of enough farm labour is still in existence. This had been responsible for the high rate of malnutrition, mortality, illiteracy and unemployment especially in the rural economy [9],[16],[17],[18],[19]. Despite the fact that these amounts are significant for the average farmer, all mean incomes below Output per hectare cannot be maximized with the low yielding, disease prone local varieties. Increased output per hectare can only be met through the adoption of the high yielding disease resistant improved varieties. The head count ratios of 53.67% and 32.15% for the Fadama II and non Fadama II farmers in Imo State respectively show that these proportions of farmers were poor because their incomes fell short of the mean household expenditure used as poverty line. This result on poverty gap implies that the poor Fadama II farmers require 03.37% of the poverty line to get out of poverty while the poor non Fadama II farmers require 11.13% of their poverty line to get out of poverty. This amounts to Income coefficient was statistically significant at 1.0% risk level. These results on farm output and income compared favourably with earlier studies [1],[11]. In terms of farm size, the mean difference was not statistically significant at given levels. Hence the null hypothesis of no difference in farm size between the two groups of farmers is accepted. The difference in mean labour use between Fadama 11 and non Fadama11 farmers was statistically significant at 1.0% level of probability hence the null hypothesis of no difference in labour use level of the two groups of Fadama II farmers is rejected. The mean differential shows that Fadama farming is more laborious given the nature of the terrain. This result is consistent with the outcome of previous studies in terms of statistical significance and difference in labour use [9],[11]. Conclusion and Recommendations Based on the findings of this research, the following recommendations will suffice: 1. The governments at all levels (Federal, State and Local Government) should as a matter of deliberate policy initiate moves towards removing all institutional, customary and traditional inhibitions to Fadama land. This calls for the full operationalization of the land use Act of 1978. Increased access to Fadama land will boost agricultural output and reduce endemic poverty. 2. On the basis of the economic indices of the project participants, the scope of subsequent phases should be enlarged to accommodate more willing farmers and ensuring that other states are incorporated. 3. Considering the laborious nature of Fadama farming, more labour saving implements should be provided under the productive asset acquisition component of the project. Figure 1 , Figure 2 References
Copyright 2010 - African Journal of Food Agriculture, Nutrition and Development The following images related to this document are available:Photo images[nd10093t2.jpg] [nd10093t4.jpg] [nd10093t1.jpg] [nd10093f1.jpg] [nd10093t3.jpg] [nd10093f2.jpg] |
| |||||||||

![[Table - 1]](/showimage?nd/photo/nd10093t1.jpg)
![[Table - 2]](/showimage?nd/photo/nd10091t2.jpg)
![[Table - 3]](/showimage?nd/photo/nd10091t3.jpg)
![[Table - 4]](/showimage?nd/photo/nd10091t4.jpg)