 |
| About Bioline | All Journals | Testimonials | Membership | News |
|
||||||
|
||||||
African Journal of Food, Agriculture, Nutrition and Development, Vol. 10, No. 10, 2010 pp.4219-4234 Article YIELD ANALYSIS AT A POULTRY PROCESSING PLANT IN HARARE, ZIMBABWE Benhura C*1, Makamba F2, Mushanguri G1, Gumiro N1 and I Muzivi1 1Institute of Food, Nutrition and Family Sciences, University of
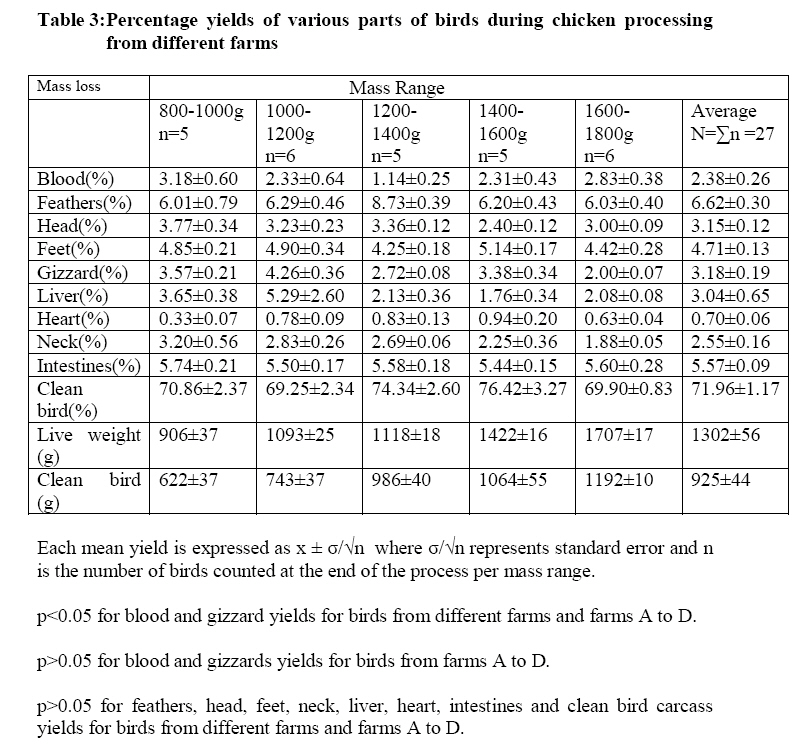
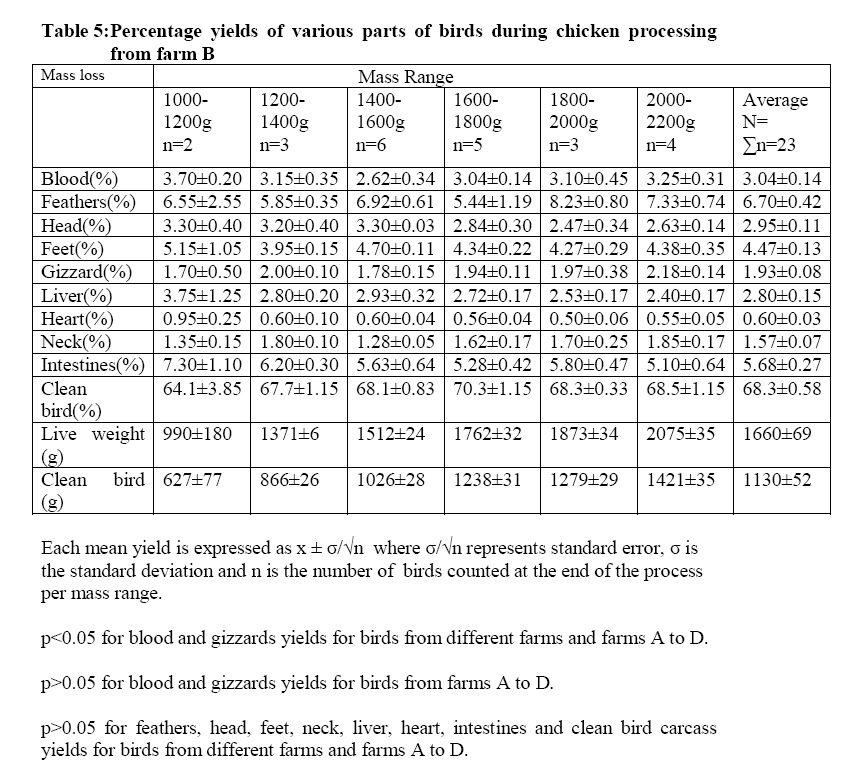
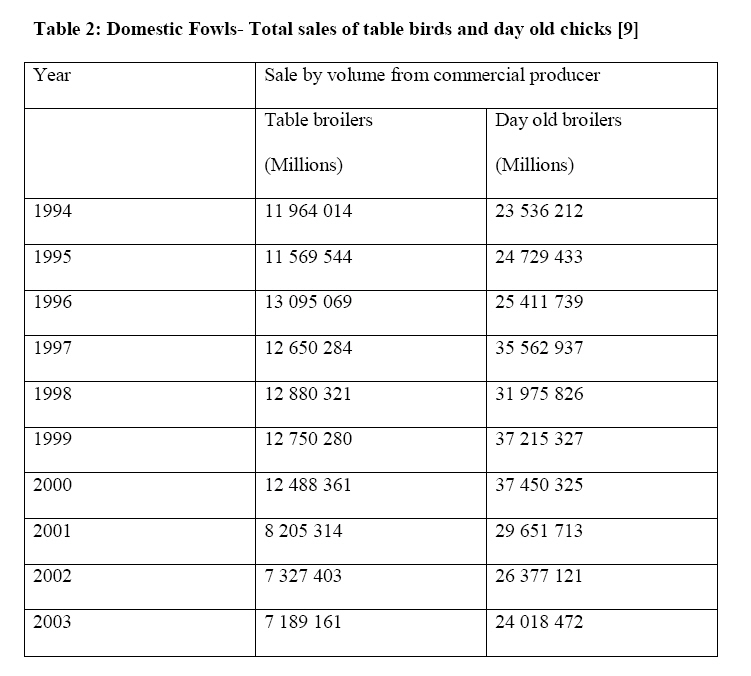
Zimbabwe. P.O. Box MP 167 Mount Pleasant, Harare, Zimbabwe. Code Number: nd10108 ABSTRACT This investigation was conducted to establish the yield of parts or organs of chickens brought for slaughter at a poultry processing plant in Harare. Results of the study will furnish management and other poultry farmers with information that will enable them to identify yield losses and sustainable ways of minimizing resultant costs. To determine the yield, a sample of 50 live birds of different mass range was taken and their masses recorded. The birds used in the first run were obtained from different growers and mixed to form the batch. The bird weights were grouped in the following categories: 800-100g, 100-1200g, 1200-1400g, 1400-1600g and 1600-1800g. Ten samples per each mass category were taken and the live masses of the birds were recorded before the commencement of the operations. The mass of each carcass was recorded at the various levels of processing that included bleeding, plucking, removal of head, feet, offals and neck to obtain the clean carcass. The processes were repeated with bird batches from four different growers, namely farms A, B, C and D in order to make broader comparisons and assessments. Calculations were carried out to determine percentage losses at various levels of processing activities. The mass of the clean bird was found to be directly proportional to the mass of the live bird. The percent yield of feathers, neck, head, blood and offals was almost independent of the mass of the bird. Percent yield for similar organs was comparable from one grower to another (p> 0.05). On average, 70% of the live mass of the bird was utilizable while 30% was lost on removal of visceral organs, feathers and blood. Feathers constituted a by-product with the highest percentage followed by the intestines. Other uses of feathers, besides rendering, should be identified to maximise on income generated from their utilization. Key words: Yield, Poultry, Feathers, Live, Birds INTRODUCTION Poultry production is an important source of livelihood for communities in Africa [1] and the developed world [2]. The poultry industry in Kuwait is one of the leading industries in the country and consists of several companies that vary between large, medium and small size poultry producers and processors [3]. In Britain, chicken has now been top of the retail meat league for three consecutive years and new research indicates that it has become an even more important part of the diet as the decade progressed [4]. Smallholder farmers in Kenya ranked poultry keeping as the most important household occupation affecting their livelihoods in several ways [5]. Poultry eggs and meat were used for home consumption where they contributed to the family nutrition while income from the sale of live birds was used to obtain inputs for crops and livestock. [5]. Poultry production is widespread in Zimbabwe, comprising large-scale and small- scale commercial poultry production units [6]. Large- scale chicken production units in Zimbabwe are not different from large production units in the Western world [7]. They are characterised by large capital investments, mechanization, specialization and hybrid stock [7]. These systems are located in peri-urban areas. Small-scale chicken production units are found in both peri-urban and communal areas. The smallholder chicken sector is traditionally based on extensive production systems where the birds find most or all of their feed through scavenging [7]. Broiler meat producers utilize stockfeeds for feeding the birds to allow them to grow to expected weights within a specified time frame. Poultry breeding and production in Zimbabwe is based on commercial strains and thousands of indigenous flocks in the communal farming sector and backyard flocks in urban areas [8]. Some trends in broiler and day-old chicks’ production in Zimbabwe are as outlined in table 1. The latest edition of data on table broiler and day old broiler chicks sales were published by the Central Statistical Office (CSO), Zimbabwe [9]. Broiler meat has been found to dominate the world’s poultry consumption constituting over 70% and is, therefore, of particular interest for raw material yield efficiency [10]. A broiler processing company was identified where about 69% of the overall business costs were used to purchase raw materials [2]. Efficient utilization of the raw materials will, therefore, lead to a substantial and immediate reduction of the production costs. The growth of the poultry industry has created a huge amount of waste namely blood, feathers and offal which are collected separately and can be processed into blood meal, feather meal, poultry offal meal and fat [11]. The feathers and offals are rich sources of protein. Feathers can be a profitable by-product in slaughtering of waterfowls, chicken and geese. Small differences in production yield have been found to result in significant financial benefits in large volumes operations [12, 13, 14]. It has been demonstrated that the average live weight of a flock of broilers could be used to predict the maximum production yield of the parts for example fillet, legs or wings [2]. For all parts, a good linear relationship between the weights of the different parts with respect to the average live weight was observed [2]. The poultry processing company falls under a large national conglomerate carrying out agricultural activities. Among the group members is Hubbard Breeders who were named after specific breeds they produce. It is, therefore, mandatory that all chickens slaughtered at the abattoir are Hubbard breeds. Growers apply for contracts, which make them eligible to supply the company with their produce and as such they must meet certain standards that are set by the plant for them to be accepted. The growers procure broiler chicks from the named certified breeding company. As a result the birds that enter the plant are almost uniformly sized, since they are raised in a similar environment. This condition is taken as another control point, which removes variation in the quality of products produced. The company processes an average of 4000 birds per day from raw state to finished products. No portion of the birds is allowed to go to waste. Products derived include whole bird carcasses, mixed chicken pieces, and giblets. Birds that are dead on arrival at the plant, feathers, and blood are conveyed to the rendering mill and used to produce stock feeds. Fresh heads and sundry items like popnoses and fresh trimmings are processed into pet food. The major problem experienced by management at the plant was the increasing number of under weight birds. It was found necessary to determine if the live mass of the birds had an effect on the final weight of the clean bird after the normal processing operations. The effect of mass of live bird on mass of the clean bird is investigated by conducting a process called yield analysis. Yield analysis involves the determination of the amount of products formed taking into account the losses and gains that occur at each stage of processing. The primary objective of this study was to establish the yield of parts or organs of broiler chickens brought for slaughter at a poultry processing plant in Harare. Results of the investigation will furnish management and poultry farmers with information that will enable them to identify yield losses and sustainable strategies of minimizing resultant costs. The plant’s primary role is the processing of raw chickens from different growers to good quality meat products that are safe for use in preparation of wholesome food. In this paper, we report the results of a yield analysis conducted at the poultry processing plant during the periods of June to August 2006 and January to March 2007. MATERIALS AND METHODS Birds were collected by plant staff from accredited breeders within 30km radius from the factory in Harare. Live birds were loaded into plastic crates normally carrying 10 to 12 birds per crate followed by loading of crates into trucks that carry them to the plant. At the factory, the gross vehicle mass was recorded at a weighing bridge. The crates containing live birds were destacked and offloaded and the birds rested for an hour in a shed. The birds were placed on a conveyor belt and directed to the stunning compartment where they were electrically stunned. Birds found dead on arrival at the plant were sent to the rendering plant or pet food section for further processing. The following mass ranges were chosen for birds to be weighed during the study: 800-1000g, 1000-1200g, 1200-1400g, 1400-1600g and 1600 to 1800g. For each range, 10 birds were selected and tagged on their feet for convenience of identification since they were going to be traced from inbound to despatch section. The tags used were labelled 1A-J to 5A-J, where 1 to 5 represented the five mass ranges while A to J stands for 10 different birds. After selection of mass ranges, the birds were selected randomly followed by weighing and sorting into respective mass ranges. The selection and mass measurement of live birds was repeated until the number of birds in a mass range reached ten. The tagged birds for the study were processed at the same time with unlabelled birds not meant for the experiment. The mass of each live bird was recorded followed by subsequent weighing at every stage of processing to try and identify the mass loss. A portable battery powered electronic balance model ICP-WP manufactured by Ishida Company Limited in China, was used to weigh the birds at each stage. The difference of mass after every process indicated the mass of the part removed. For example, the difference between the mass of a whole bird and that of one without a head gave the mass of the head. The results obtained were used to calculate the percentage of blood, feathers, head, feet, neck, gizzard, heart, liver and clean bird with respect to the mass of live bird. The percent mass loss calculated for each part or organ of the bird is referred to as the yield for the organ. Due to loss of labelling tags for some birds in plucking and spin chilling, the remaining identifiable birds were in some instances less than the original ten in each mass range. The first batch of birds consisted of a mixture of birds from different growers. From January 2007 to March 2007 the measurements were repeated with four batches of birds from farms A, B, C and D. The following mass ranges of birds were used: farm A; 1400-1600g, 1600-1800g, 1800-2000g, and 2000-2200g; farms B and C, 1000-1200g, 1200-1400g, 1400-1600g, 1600-1800g, 1800-2000g and 2000-2200g ; farm D 1000-1200g, 1400-1600g, 1600-1800, 1800-2000g, 2000-2200g, 2200-2400g and 2400-2600g. Similarly, as in the first batch of birds, the tags used were labelled as follows: 1A-J to 4A-J for birds from farm A, 1A-J to 6A-J for birds from farms B and C and 1A-J to 7A-J for birds from farm D. In each case the numerical figures 1 to 4, 1 to 6 and 1 to 7 represent the mass ranges while the alphabet letters A to J represent 10 birds used per mass range. The data were statistically analysed using Graph Pad Prism 4 software package. A one- way analysis of variance (ANOVA) was employed to determine the significance of differences among yields of organs and tissues of birds from different farms, farms A, B, C and D [ 15]. RESULTS Blood and Feathers The blood contents for birds from different farms (Table 3), farm A (Table 4), farm B (Table 5), farm C (Table 6) and farm D (Table 7) were significantly different( p< 0.05). There was no significant difference for blood content of birds from farms A, B, C and D (p> 0.05). The mean value of 2.38% from table 3 is too low when compared with mean values in Tables 4, 5, 6, and 7 where the values are above 3%. There is no significant difference in the percentage of feathers from tables Table 3, 4, 5, 6, and 7 p>0.05. The yields of feathers of birds from the farms are comparable. Heads, Feet and Necks The mean percentage yields for heads ranged from 2.74 to 3.15% for birds from farms A to D (Tables 4, 5, 6, and 7 ) and from different farms (Table 3).The head yields for birds from the farms were found to be comparable (p> 0.05). Analysis of data for feet yields showed that there was no significant difference for birds from different farms (Table 3) and farms A to D (Tables 4, 5, 6, and 7 ). Similarly no significant difference was noted for yields for necks of birds from the different sources (Tables 3 ,4, 5, 6, and 7). Gizzards, Liver, Heart and Intestines The mean percent yields for gizzards of birds from the different farms (Table 3), farms A, B, C and D (Tables 4, 5, 6, and 7 ) were found to be significantly different (p< 0.05). Birds from farms A, B, C and D had comparable percent yields for the gizzards (p> 0.05). The mean yield for gizzards in table 3 (3.18%) is higher than mean values in Tables 4, 5, 6, and 7 which range from 1.93 to 2.25%. This explains why mean yield values for gizzards in table 2 do not compare with levels in Tables 4, 5, 6, and 7 . There is no significant difference in the percent yield for liver of birds from the different sources (Tables 3 ,4, 5, 6, and 7) (p> 0.05). Similarly, in each case for heart and intestines the respective percent yields for the organs in birds from the sources were not significantly different, p> 0.05. This indicates that there are no significant differences in the yields of each organ in birds from each source. Clean birds and live birds The mean percent yield values for clean carcass for birds from the farms range from 64.10 to 74.34% (Tables 3 ,4, 5, 6, and 7). Statistical analysis showed that there were no significant differences in the mean percent yields of clean birds from the different sources (p> 0.05) (Tables 3 ,4, 5, 6, and 7). The results showed that the mass of the clean bird increased with increase in the live weight of the birds (Tables 3 ,4, 5, 6, and 7). Tables 3 ,4, 5, 6, and 7 show the percent yields of various parts of chickens from the different growers or farms. DISCUSSION Feathers are the by-products with the highest percent yield followed by intestines (Tables 3 ,4, 5, 6, and 7). Most of the weight besides clean bird is lost as feathers, which are used in the production of stock feeds. The percentage of feathers was almost the same regardless of the mass of the bird (Tables 3 ,4, 5, 6, and 7). Similar trends in percent yields were observed for blood, head, feet, gizzards, liver, heart, neck and intestines. Yields of heads, feathers and blood are transported to a rendering plant where they are processed into a powder used in the manufacture of stock feeds. The percent yields for feet ranged from 4.26 to 4.71% (Tables 3 ,4, 5, 6, and 7) and are comparable to a previously measured value of 4.23% [16]. As shown in the same tables, head yields fell between 2.74 and 3.15% and compared well with an earlier measured result of 2.55% [16]. Neck yields obtained fell between 1.57 and 2.55% and are close to a literature value of 1.67% [16]. Slaughter yields of the chicken carcasses obtained ranged from 64.1 to 74.3% (Tables 3 ,4, 5, 6, and 7). Comparable slaughter yields of carcasses ranging from 73.3 to 74.5% were obtained in a similar study conducted in Poland [17]. In another study, a carcass yield range of 67.84 to 70.03% was recorded for chickens of slaughter weight ranging from 2.30 to 2.38kg [18]. Carcass yields obtained in this study compared well with results of previous similar studies. The mass of the clean bird (carcass) increased with increase in the live weight of the birds (Tables 3 ,4, 5, 6, and 7). These results compare with findings from previous work where a linear relationship was obtained for weight of clean bird carcasses against the live weights [16]. CONCLUSION The results of the study showed that, on average, 70% of the live bird is the utilisable mass of the clean bird as 30% was lost due to removal of visceral organs, blood and feathers. Feathers constituted the highest unwanted yield. Percent yields for feathers, blood and organs of birds from different sources were found to be consistent and independent of the masses of the birds. RECOMMENDATIONS Due to the high yield of feathers, it is important to identify an alternative to rendering use of feathers. Other possible areas where feathers can be used are as cushion stuff in pillows, chairs and bed mattresses. Investigation on the use of feathers in countries such as the United States of America, Brazil, Argentina and Netherlands with expanded poultry industries need to be conducted to help in coming up with a sustainable plan on utilization of feathers. Large and small- scale poultry producers and processors need to be trained on the concepts and importance of yield analysis in the poultry industry. ACKNOWLEDGEMENTS The authors acknowledge the support offered by the staff and management of the poultry processing plant towards the success of this study. The authors thank Professor M.A Benhura for reading and suggesting corrections on the manuscript. The study was funded by Suncrest Chickens Private Limited and the University of Zimbabwe. REFERENCES
Copyright 2010 - African Journal of Food Agriculture, Nutrition and Development The following images related to this document are available:Photo images[nd10108t3.jpg] [nd10108t5.jpg] [nd10108t4.jpg] [nd10108t2.jpg] [nd10108t1.jpg] [nd10108t6.jpg] [nd10108t7.jpg] |
| |||||||||
