 |
| About Bioline | All Journals | Testimonials | Membership | News |
|
||||||
|
||||||
African Journal of Food, Agriculture, Nutrition and Development, Vol. 10, No. 10, 2010 pp.4235-4253 Article DETERMINANTS OF NUTRITIONAL STATUS OF CHILDREN IN FARMING HOUSEHOLDS IN OYO STATE, NIGERIA Lawal BO*1 and SF Olukemi 2 1Farming Systems Research and Extension Programme, Institute of Agricultural
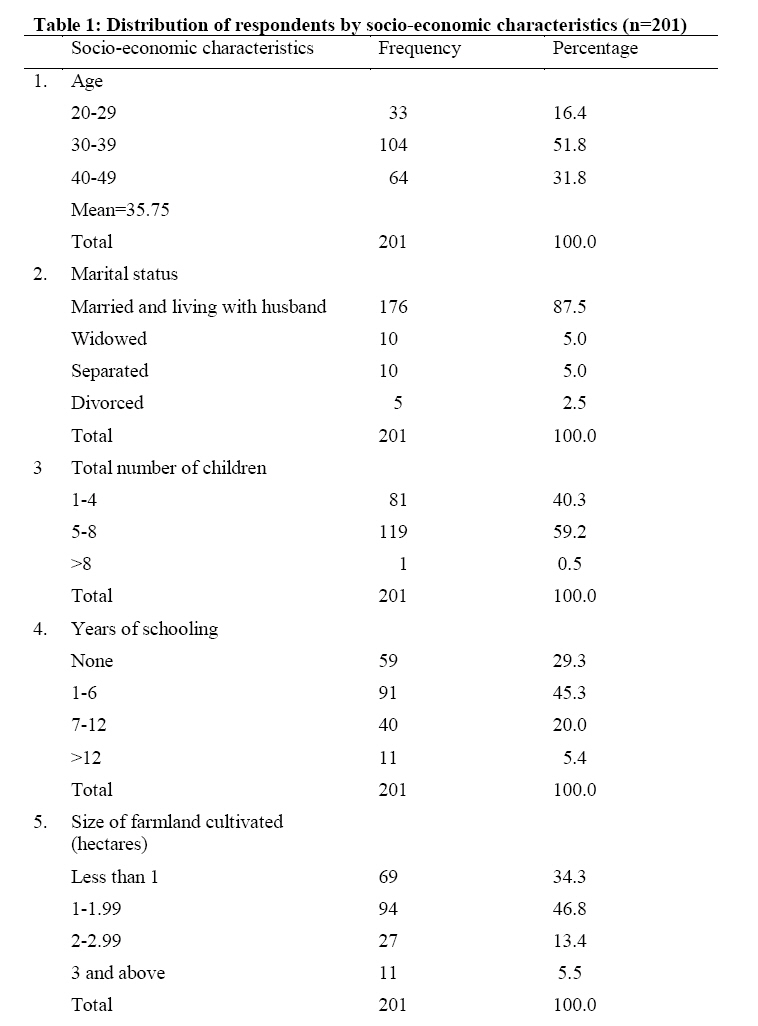
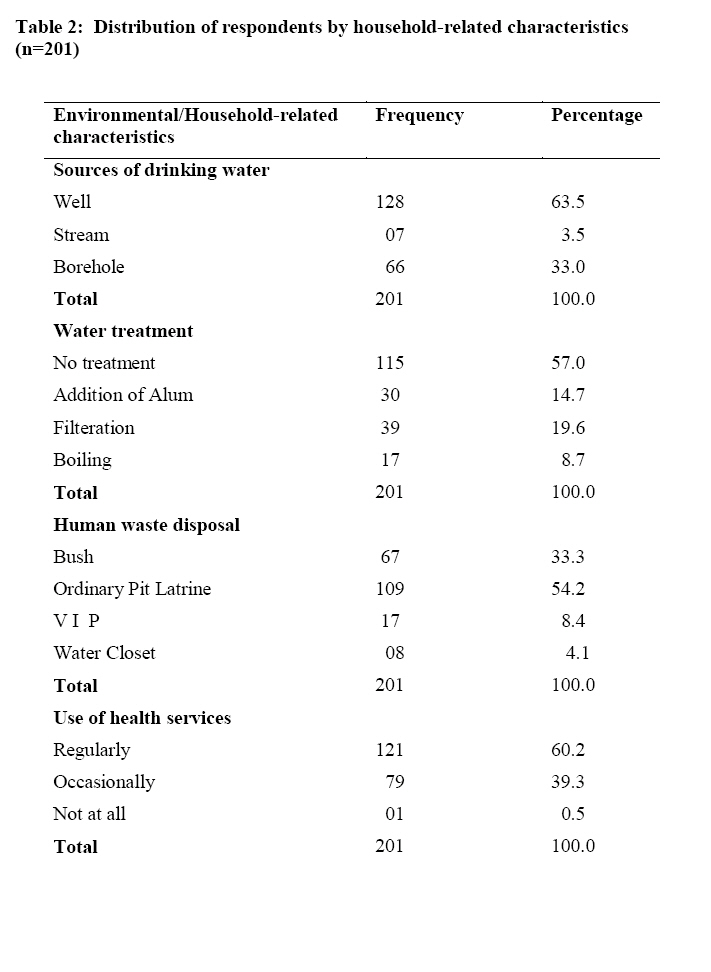
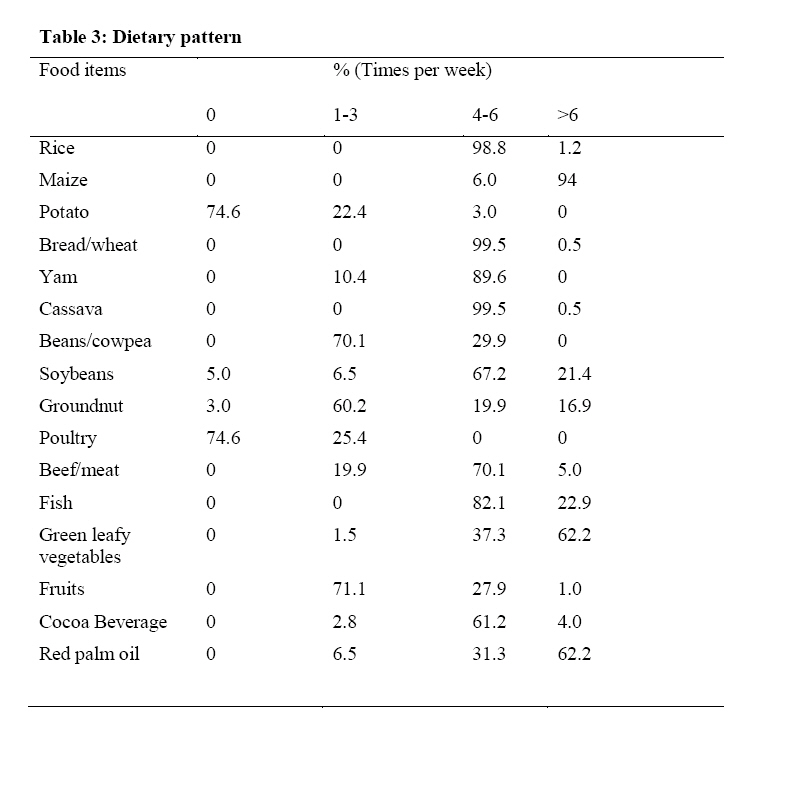
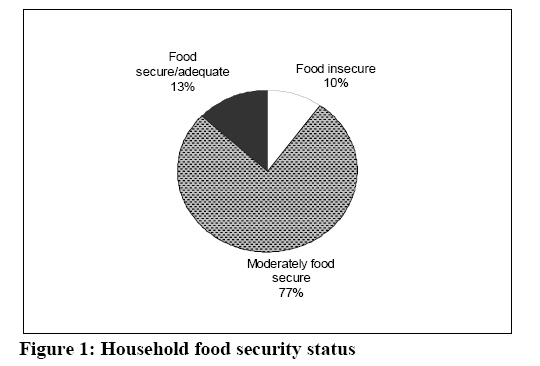
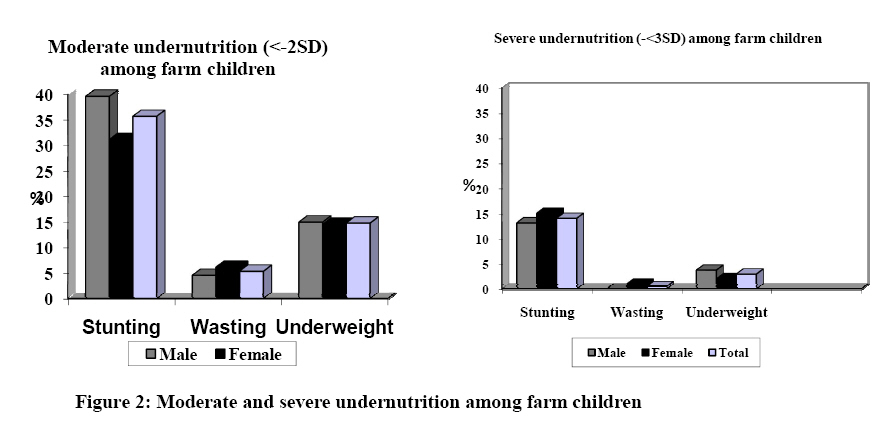
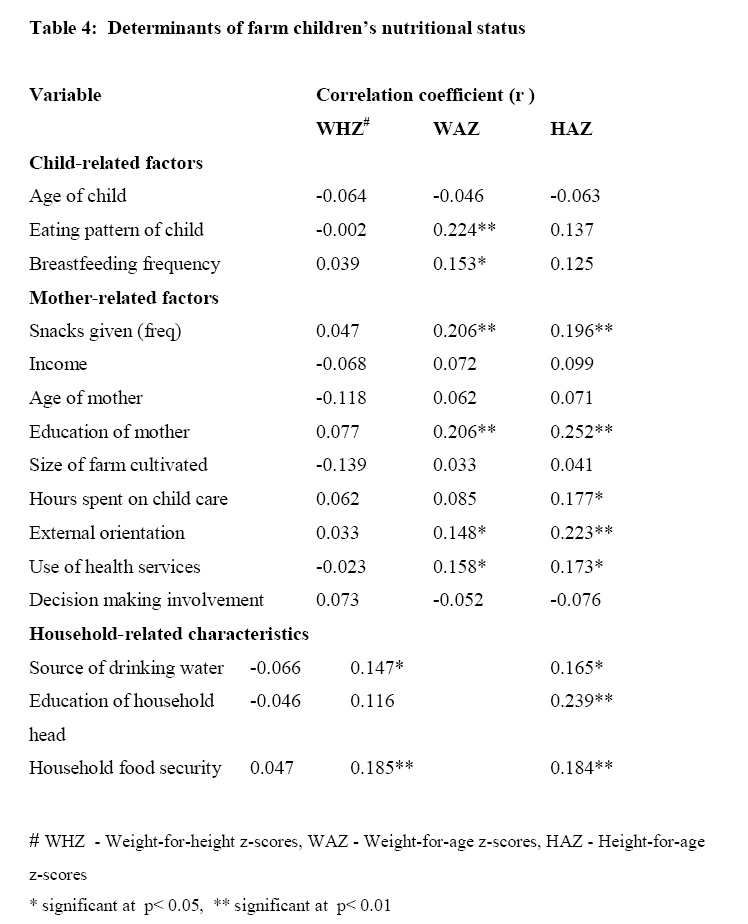
Research and Training (I.A.R&T), Ibadan. Nigeria. Code Number: nd10109 ABSTRACT This descriptive cross-sectional survey determined the influence of socio-economic, household and child-related factors on the nutritional status of children (0-5yrs) in farming households of Oyo State, Nigeria. The study was conducted using a multi-stage sampling technique to select 201 mother-child pairs from 18 farming communities in the state. Data were collected from the mothers, using a structured interview schedule and anthropometric measurements of their children were taken to determine the prevalence of stunting, underweight and wasting. The data obtained were analyzed using frequency distribution, percentages, mean and standard deviation. Pearson Product Moment Correlation was used to determine the influence of the underlying determinants of nutritional status. The mean age of women was 35.75 years, while that of the children was 22.20 months. Majority (59.0%) of the women had between 5 and 8 children, 42.7% of the respondents were primarily farmers, while 57.3% combined farming with trading, agro-processing, artisan and paid jobs. The average farm size was 1.86 hectare. Women with some form of education constituted 70.7%, while 29.3% had no education at all. The most frequently consumed food items in the households (consumed at least 4 times a week) included bread (99.5%), cassava/cassava products, rice (98.8%), yam/yam products (89.6%) and meat (70%). Fruits were, however, not frequently consumed. Household food security data showed that 77.2% were moderately food secure while 9.9% were food insecure. Only 12.8% were food secure. The results indicate that the nutritional status of children in the farming households in the study area was generally sub-optimal. Overall stunting prevalence was 35.7%, underweight 14.9% and wasting 5.5%. Factors which were significantly associated with nutritional status of the children included age of child, frequency of breastfeeding, eating pattern of child, provision of snacks, household food security status, number of hours mother spends on childcare, mother’s use of health services, mother’s education, frequency and scope of travel of mother beyond the immediate locality and source of drinking water. It is recommended that the primary intervention strategies should be to address poverty among subsistence farmers’ households, promote sustainable livelihoods, and provide primary health care services which will in turn improve the nutritional status of children. Key words: Children, anthropometry, nutrition, farming, households INTRODUCTION Childhood undernutrition remains a public health problem in Nigeria, as the status did not improve substantially during the last two decades. The implications of this unrelenting situation for the well being of children and for the development of the nation as a whole are unacceptable because undernutrition contributes to the high rates of morbidity and disability and mortality among children [1,2,3]. In addition, undernutrition constrains people’s ability to fulfill their potential, as it is also associated with impaired growth, mental development and school performance, reduced adult size and reduced work capacity, which in turn impacts on economic productivity at the national level [4, 5]. The National Demographic and Health Survey of 1990 provided information on the nutritional status of children 1-59 months old and recorded the prevalence of stunting as 43%, underweight, 36% and wasting 9% [6]. The Participatory Information Collection (PIC) study [7], which provided another assessment of the situation, showed that stunting or chronic undernutrition was the most prevalent form of undernutrition in Nigeria, with one out of every two children under the age of five years being stunted (52.3%). The prevalence rate of underweight was 28.3%, while that of wasting was 10.8%. Later on, the 2003 National Demographic and Health Survey gave the following figures: stunting 38.3%, wasting 9.2% and underweight 28.7% [8]. Further, nationally representative data, which emanated from the Nigeria Food Consumption and Nutrition Survey (2001-03) showed that among under-fives, 42% were stunted, 25% underweight, and 9% wasted [9]. From the review of these past national data, it appears that there had been little progress in improving child nutrition in Nigeria. Another matter arising from the data is that consistently, all the national surveys have shown that the prevalence of child undernutrition in Nigeria is higher in the rural than in the urban areas. Hence, it appears that rural communities in Nigeria are nutritionally more vulnerable than those in the urban areas. Most rural dwellers depend directly on agriculture for their food and livelihoods, and farming households abound in these areas. However, studies documenting the nutritional status of young children in farming households are scarce in Nigeria. Generally, children constitute the most nutritionally vulnerable group in any community. In this study, it is hypothesized that children from farming families are at special nutritional risk, and this justifies the need for an investigation of the underlying causes of malnutrition in children living under such circumstances. The objective of this study was to assess the influence of socio-economic, household and child-related factors on the nutritional status of children (0-5yrs) in farming households of Oyo state, Nigeria. MATERIALS AND METHODS The study was carried out in Oyo state, located in south western Nigeria. It is located between latitude 7o and 9o north of the equator and bounded by longitude 2o and 4o east of the Greenwich Meridian. The population of Oyo State is 5,591,589 persons [10]. The state has a land area of approximately 32,249.1 square kilometers out of which 27,107.93 km2 is cultivable [11]. Agriculture is the predominant means of livelihood of the people with about 70% rural population. There are threes types of vegetation within the state: rain forest, derived savannah and savannah. The major perennial crops cultivated include cocoa, citrus, timber and tobacco, while the annual crops include yam, maize, cowpea, cassava, melon, and millet. Livestock raised include sheep, goats, pigs, rabbits, poultry and snails. The state comprises 33 Local Government Areas (LGAs), which are grouped into four administrative divisions: Ibadan-Ibarapa, Oyo, Ogbomoso and Saki. Sampling Procedure and Sampling size Stratified sampling technique was used to select six Local Government Areas (LGAs) from the four administrative zones of the state. Three farming communities were randomly sampled from each of the selected Local Government Areas. Within the farming communities, households were selected using systematic sampling procedure with a random start. The main target in each household was a mother having at least one child below the age of six. In case of non-availability of a mother in this category in a targeted household, the next household in the list was selected to replace the sampled household. In all, two hundred and one women farmers with children (201 mother-child pairs) were selected for the study. Data collection procedure Data were collected in 2007. A structured interview schedule was developed and used to elicit information from the selected women farmers. The test retest method was used to determine the consistency of the research instrument. A reliability coefficient of 0.86 was obtained. The assessment of the nutritional status of the children was done by means of anthropometric measurements; weight was measured with portable floor bathroom scales (Hanson, model 89), while a locally constructed length board/heightometer was used for height [12]. The length/ height measurements were made to the nearest 0.5cm. For weight, children were weighed wearing light clothes on a bathroom scale. Children who were not able to stand by themselves were weighed while being held in their mother’s arms, and then the mother’s weight was subtracted to give the child’s weight to the nearest 0.1 kg. Age in months was calculated from the date of birth to the date of the survey. Two measurements were taken for each of the anthropometric parameters. The scale was checked each time a subject was measured to minimize error. Dietary pattern was assessed using a food frequency questionnaire containing a comprehensive list of food items consumed in the locality. Household food security status was conceptualized as access to food at all times by members of the respondents’ households. Respondents were required to indicate what best describe their household members’ access to food throughout the year. This was rated on a 5-point rating scale as follows: “have more than enough food to eat (5), have enough food to eat (4) , sometimes do not have enough to eat (3), often, do not have enough to eat (2), never have enough to eat (1). Respondents were also asked to indicate the number of days during the past 3 months that members of the household skipped at least one meal. Responses were also rated on a 5-point scale as “never” (scored 5), “monthly” (4), “once in a week” (3), “three days in a week” (2), and “daily” (1). The maximum score for a respondent was 10 while the minimum was 2. The women were categorized into three classes of household food security status (HHFS) using the mean score and the standard deviation: Food secure (8 and above), moderately food secure (5-7) and food insecure (1-4). The other independent variables were operationally defined as follows: Measurement of Independent variables Age of child refers to the actual age in months. Eating pattern of child refers to actual number of meals eaten by child per day. Frequency of snacks given refers to actual number of times snacks are given to child in a day. Number of hours mothers spend on child care refers to actual number of hours spent by mothers on child care in a day. Mother’s use of health services refers to the number of times mothers make use of health services in the six months prior to the survey. Mother’s education refers to number of years of formal schooling of mother, which is the actual number of years spent by a mother in school. External orientation or Cosmopoliteness is the degree of inclination of the respondents beyond the social system to which she belongs. It is measured in terms of frequency of visits to outside her village and the purpose of such visits. Cosmopoliteness was expected to have positive relationship with the dependent variable since it provides more chance of exposure to external information regarding childcare. The number of times respondents have travelled outside the community in the past one year for the purpose of obtaining information onchild care and nutrition was taken as their degree of orientation. Involvement in decision making in farm and home activities refers to the extent to which the respondent is at liberty to decide on issues at home and on farm, the extent of their involvement in a list of 12 farm and home activities, whether they were: main decision maker (scored 2), shared decision maker (1) or not involved (0) in decision making in 12 farm and home activities. Possible maximum scrore was 24 while minimum was 0. Education of household head refers to the years of schooling of household head, which is the actual number of years spent by household head in school. Size of farm cultivated refers to the actual hectarage of land cultivated by respondents. Actual heaps were converted to standard hectares. Annual income refers to actual income in Nigerian Naira per annum. Sources of drinking water refers to safe and unsafe sources which include pipe borne water, bore hole, well and stream water. Households with pipe borne water/borehole source of water was scored 4; deep well was scored 3; rainwater was scored 2; stream and shallow water was scored 1. Data analysis The data were analyzed using World Health Organisation Anthro 2005 PC software and SPSS computer software version 11.0. Descriptive statistics such as frequency distribution, percentages, means and standard deviation were used to describe the data. Inferential statistics (Pearson Product Moment Correlation) was used to determine the relationship between the indices of nutritional status and the independent variables considered in the study. Justification of the statistical techniques Pearson’s Coefficient of Correlation (r) was applied to analyze the data. The degree of relationship or correlation between two variables X and Y is answered by the use of correlation analysis [13, 14]. Pearson’s coefficient of correlation (r) is also known as the Product Moment Correlation Coefficient. The value of ‘r’ lies between +1 and -1. Positive values of ‘r’ indicate positive correlation between the two variables (that is, changes in both variables take place in the same direction), whereas negative values of ‘r’ indicate negative correlation that is, changes in the two variables taking place in the opposite directions. A zero value of ‘r’ indicates that there is no association between the two variables. When r = (+) 1, it indicates perfect positive correlation and when it is (-) 1, it indicates perfect negative correlation. The value of ‘r’ nearer to +1 or -1 indicates high degree of correlation between the two variables [14]. RESULTS Socio-demographic characteristics of mothers Table 1 shows the socio-demographic characteristics of the mothers. Most of them were between the ages of 30 and 39. The mean age of women was 35.75 years. All were married and majority (87.9 %) of them at the time living with their husbands. Majority (59.0%) had between 5 and 8 children. This has implication for farming hands since women farmers would readily augment their farm labourers with such children. Mothers with some form of education constituted 70.7%, while 29.3% had no education at all. About half (53.4%) of respondents earned an income of between 20, 001 - 40, 000 naira while 36.3% earned more than ?40, 000 (150 naira= 1 USdollar; conversion rates for 16/03/2010 apply) per annum. While 42.7% of the respondents were primarily farmers, 57.3% combined farming with trading, agro-processing, artisan and paid jobs. The average farm size was 1.86 hectare. Less than half (46.8%) of the women cultivated between 1 and 1.99 hectares of farm land while 34.3% cultivated less than 1 hectare of farmland. Crops cultivated by women farmers included maize, yam, cassava, vegetables and melons. Majority of the women reared livestock such as goats (95.5%) and chickens (81.6%), which were reared for both consumption and income generation to enhance livelihood and food security. Farming systems prevalent in the area were maize/cassava intercrop and maize/yam/cassava intercrop, which were practiced by most of the women farmers. The women took part in social organizations; for example 72% were members of cooperative societies. They, however, hardly took part in political organizations and village councils as only 15.9% and 6.7% of the women, respectively indicated their membership of such organizations. The data on external orientation of respondents showed that nearly everyone of the respondents (99.0% and 97.5%) traveled beyond their Local Government Areas and outside their states of residence on a monthly basis. This shows a relatively high orientation of respondents within and outside their state of residence. Business trip was a major reason given by the respondents while religion and family matters constituted other reasons for such traveling. Household environment and access to health facilities Mean household size was 8.3. Data in Table 2 further revealed that water and sanitation facilities were inadequate in the farming households. Dug wells were the most common source of drinking water (63.5%), and other sources included borehole (33%) and stream (3.5%). While 8.7% boiled their water prior to drinking, majority (57%) failed to treat their water before drinking. None of the households had access to a public tap. The predominant toilet facilities were pit latrine (54.2%) and the bush (33.3%). The establishment of health posts and clinics within the closer reach of the communities has facilitated the delivery of various maternal and child survival interventions. Majority (60.5%) of the women farmers utilized health services on a regular basis while a lesser proportion (39.1%) utilized it occasionally. Child characteristics Among the children studied, there were slightly more males (52.7%) than females. More than one-third (35.7%) of the children were in the age group of between 13 and 24 months, with a mean age of 22.0 ± 13.82. The major diseases prevalent among children in the study area included malaria, diarrhea (59%) and respiratory infections (cold and catarrh) (28%); almost all (97.1%) the women indicated the occurrence of malaria in their children in the past six weeks prior to the survey. While 82.1% of women had no record of a dead child, 17.9% had records of at least one dead child. Breastfeeding was nearly universal and majority of the children were breastfed throughout the first year of life. The duration varied from less than 6 months to >26 months; 73.9% of the women breastfed their children for a duration of 20-26 months, while 14.9% breastfed for more than 26 months. Dietary pattern and household food security Data from the food frequency questionnaire showed that the staples which formed the basis of the diet were consumed by majority of the households between 4 and 6 times per week. These staples included rice (98.8%), bread/wheat (99.5%), yam (89.6%) and cassava products (99.5%). Protein-rich food items particularly animal products such as meat and fish were also consumed, with 70% of the households indicating consumption of meat between 4 and 6 times a week. However, poultry was consumed less frequently (Table 3). While green leafy vegetables were consumed on a regular basis by majority of the households, fruits were seldom consumed on a daily basis. Sixty-two percent of the women included red palm oil in their families’ diets between 4 to 6 times a week. Concerning household food security, the data showed that 77.2% were just moderately food secure while 9.9% were food insecure. Only 12.8% were food secure (Figure 1). Nutritional Status of Children The prevalence of stunting (low height-for-age), wasting (low weight-for-height) and underweight (low weight-for age) of children in the study area is shown in figure 2. For both sexes, 35.7% of the children fell below minus two standard deviations (-2SD) from the median of the reference population for the height- for- age index, this prevalence is high, according to World Health Organization classification[15]. In relation to wasting, 4.7% of male children and 6.3% of female children fell below minus two standard deviations (-2SD) from the median of the reference population for the weight-for- height index (Figure 2). This shows that wasting prevalence was higher for female than for male children. This, however, fell within the medium prevalence for both sexes. For underweight, 15.1% and 14.7% of male and female children respectively were underweight; this also falls within the medium prevalence classification. Correlation analysis showing relationships between nutritional status and selected mother, household (environmental and health) and child-related characteristics The results in Table 4 show that certain variables influenced the nutritional status of children in the study area. Significant relationships existed between the number of meals given children daily and the child’s current nutritional status (weight-for-age) (r=0.224; p<0.01) as well as breastfeeding pattern and child’s weight-for-age (r=0.153; p<0.05). Provision of snacks to children was positively and significantly associated with improved nutritional status especially height- for- age and weight-for-age indices (r=0.196 and 0.206; p<0.01). There were also significant relationships between the number of hours spent on childcare and the nutritional status especially weight-for-age and height-for-age (r=0.183 and 0.210; p<0.01). With regard to mothers’ characteristics, mother’s level of education had positive relationship with children’s weight-for-age and height-for age (r=0.266 and 0.246, respectively; p<0.01). Similar to education of mothers, better education of household head also had a positive relationship with the weight-for-age and height-for-age indices of the nutritional status. External orientation of the mother, as measured by frequency and scope of travel beyond the immediate locality was also positively correlated with height-for-age (r=0.223; p<0.01. Positive relationship was found between the use of health services by mothers and weight-for-age and height-for-age measures of nutritional status (r=0.158 and 0.173; p <0.05). On the other hand, there was a negative relationship between farm size and children’s nutritional status. Household/Environmental Characteristics Better source of drinking water was positively associated with height-for-age (r=0.165; p< 0.05) and weight-for-age (r=0.147; p<0.05). Higher household food security scores also had a positive relationship on weight-for-age and height-for-age (r=0.185 and 0.184; p<0.05, respectively). Household size, water treatment and waste disposal means and status of mothers in the household were, however, not significantly correlated with the nutritional status of children. DISCUSSION The results indicate that generally, the socioeconomic status of the respondents was low. The income levels reveal that a greater proportion of the women were poor, particularly when compared with the poverty line of one dollar per day as the poverty line that could consume minimum FAO recommended calories per person per day and a minimal basket of non-food items [16]. The level of education was also low, and subsistence farming was the main means of livelihood for the women. Few of the households were food secure, while household water and sanitation facilities were substandard. The nutritional status of children in rural subsistence farming households in the study area is poor. This may be a reflection of the current overall child nutrition situation in the country as presented in the preliminary report of the 2008 Nigeria Demographic and Health Survey , which reported that the percentage of children in Nigeria who are stunted (below -2 SD) is 41 percent, with 14% and 23% being wasted and underweight, respectively [17]. The findings agree with previous studies carried out in farming households such as a recent study in Nigeria, in which the nutrient intake of female peasant farmers in selected communities of Gombe State was assessed, and it was found that energy, protein, calcium, iron, thiamine and vitamin C were inadequate [18]. These findings in Nigerian farm households are also similar to findings from other countries such as South Africa [19,20] and Malawi [21] , that farming households in rural areas appear to be more food insecure and nutritionally vulnerable and undernourished compared to their rural and urban counterparts from non-farming households. According to the National Food Consumption Survey (NFCS) South Africa of 1999, at the national level moderate stunting affected nearly one in ?ve children, while on commercial farms, this disorder affected nearly one in three children. Similarly, the prevalence of severe stunting was higher in children living on commercial farms (12.5%) when compared to others in the rural (8%) areas, as well as the national average (6.5%). Also, the households in the rural areas had a lower energy intake than national averages, the lowest of which was recorded in children living in households on commercial farms [19]. The findings of Phometsi et al. [20] also indicated that for children living on commercial farms in the North West province of South Africa, their social, economic and psychological environment played a key role in determining the nutritional status of these children. It has also been reported that in rural subsistence farming households in Malawi, the rates of underweight (23%) and stunting (52.5%) are high to very high [21]. Similar studies from America have identified and documented a variety of factors limiting farm workers’ access to an adequate diet, with its consequent nutrient-specific dietary adequacies. Available literature indicates that these groups of people often suffer from nutritional deficiencies and malnutrition-linked health disorders, often compounded by chronic parasitic infestation [22]. From this study, the determinants of malnutrition in under- fives from farming households include frequency of breastfeeding, eating pattern of child, provision of snacks, household food security status, number of hours mother spends on childcare, mother’s use of health services, mother’s education, frequency and scope of travel of mother beyond the immediate locality and source of drinking water. Improved household food security will lead to improved nutritional status; the more access a household has to food the better the nutritional status of household members. Children who are provided with frequent meals and snacks are more likely to meet their nutritional requirements and consequently experience improved nutritional status. Also, a child who received regular supply of breast milk especially during the early months of life is less likely to suffer from childhood infection and undernutrition. Concerning time for childcare, increase in the amount of time available for childcare can improve the nutritional status of the child. However, as shown in this study, there was a negative relationship between farm size and children’s nutrition; a possible explanation could be that with increase in farm size, there was the tendency for mothers to spend more time in agricultural activities that would eventually leave less time for adequate child feeding and care. Education of mothers as measured by number of years of formal schooling had a positive relationship with children’s nutritional status. The effect or relationship could be explained by the superior abilities of mothers with more years of schooling to provide their children with better feeding, medical care and good sanitation. This finding corroborates findings from earlier studies that show that women with schooling have been found to have healthier children than those who have none [23,24]. Some authors have opined that educated mothers tend to follow instructions about feeding and child care much better than their less or uneducated counterparts and also, are less antagonistic to new ideas and teaching on child care. This may be related to their having better access to information. In addition, they use curative and preventive healthcare services more than uneducated mothers [25], therefore having positive impact on their children’s nutritional status. In the present study, use of health services had a positive association with nutritional status of farm children. Education of women increases their knowledge and skills, and this enables them to earn higher incomes, and thus enhances household food security, and also education improves the quality of day-to-day care women give to their children [26,27]. External orientation was also associated with nutritional status, which may imply that mothers with wider external orientation tend to be exposed to and acquire improved care, dietary and health practices as a result of their cosmopoliteness. Good source of drinking water is of benefit to children’s nutritional status by reducing their exposure to infection, in particular diarrhoeal diseases; this improves child health and nutritional status over a long period of time. CONCLUSION AND RECOMMENDATIONS This study attempted to provide insights into the possible factors that could particularly make the Nigerian farm children who were understudied nutritionally vulnerable. The findings, which aptly fit into the well-known UNICEF conceptual framework of the causes of child undernutrition, include food insecurity and inadequate diets, inadequate care for children, poor educational status of mothers, poor access to health services, and unsanitary household environments. Invariably, the root cause of these deficiencies in the children's social, economic and sanitary environment is poverty. Therefore, the primary intervention strategy should be to address female education as well as poverty among subsistence farming households, promote diversified and sustainable livelihoods, and provide basic sanitary infrastructure and primary healthcare services Nutrition education is also a workable strategy and should aim at addressing the preparation, processing, and combination of various types of inexpensive, locally available indigenous food sources which have potential in improving nutritional status in rural communities. REFERENCES
Copyright 2010 - African Journal of Food Agriculture, Nutrition and Development The following images related to this document are available:Photo images[nd10109t4.jpg] [nd10109t3.jpg] [nd10109t1.jpg] [nd10109f1.jpg] [nd10109t2.jpg] [nd10109f2.jpg] |
| |||||||||
