 |
| About Bioline | All Journals | Testimonials | Membership | News |
|
||||||
|
||||||
African Journal of Food, Agriculture, Nutrition and Development, Vol. 11, No. 1, 2011 pp. 4558-4581 OBTAINING EVAPOTRANSPIRATION AND SURFACE ENERGY FLUXES WITH REMOTELY SENSED DATA TO IMPROVE AGRICULTURAL WATER MANAGEMENT Khaldi A1, Hamimed A1*, Mederbal K1 and A Seddini2 1 Laboratoire de recherche sur les systèmes biologiques et la géomatique,
university of Mascara / P.O. Box 305, Mascara, 29000, Algeria. *Corresponding author email: hamimed@dr.com ABSTRACT The quantification of evapotranspiration from irrigated areas is important for agriculture water management, especially in arid and semiarid regions where water deficiency is becoming a major constraint in economic welfare and sustainable development. Conventional methods that use point measurements to estimate evapotranspiration are representative only of local areas and cannot be extended to large areas because of heterogeneity of landscape. Remote sensing based energy balance models are presently most suited for estimating evapotranspiration at both field and regional scales. In this study, SEBAL (Surface Energy Balance Algorithm for Land), a remote sensing based evapotranspiration model, has been applied with Landsat ETM+ sensor for the estimation of actual evapotranspiration in the Habra plain, a semiarid region in west Algeria with heterogeneous surface conditions. This model followed an energy balance approach, where evapotranspiration is estimated as the residual when the net radiation, sensible heat flux and soil heat flux are known. It involves in the input the remote sensing land surface parameters such as surface temperature, NDVI and albedo. Different moisture indicators derived from the evapotranspiration were then calculated: evaporative fraction, Priestley-Taylor parameter and surface resistance to evaporation. These calculated indicators facilitate the quantitative diagnosis of moisture stress status in pixel basis. The study area contains extremes in surface albedo, vegetation cover and surface temperature. The land uses in this study area consists of irrigated agriculture, rain-fed agriculture and livestock grazing. The obtained results concern the validation of the used model for spatial distribution analysis of evapotranspiration and moisture indicators. The evaluation of daily evapotranspiration and moisture indicators are accurate enough for the spatial variations of evapotranspiration rather satisfactory than sophisticated models without having to introduce an important number of parameters in input with difficult accessibility in routine. In conclusion, the results suggest that SEBAL can be considered as an operational method to predict actual evapotranspiration from irrigated areas having limited amount of ground information. Key words: Evapotranspiration, Remote sensing, SEBAL, Irrigation INTRODUCTION Monitoring the transfers of mass and energy at a surface is crucial for hydrological and vegetation resources management. It is also necessary for a better comprehension of hydrological and climatic systems as well as their predictions. Remote sensing is an excellent tool for this monitoring as it provides information related to mass and energy transfers and particularly to evapotranspiration fluxes. Evapotranspiration is one of the fundamental processes controlling the equilibrium of our planet. It constitutes the link between the hydrological and energetic equilibrium at the soilvegetation-atmosphere interface and its knowledge is crucial for climatic and agrometeorological studies. Depending on the geographical location on the earth’s surface, evapotranspiration represents about 70 % of the precipitation return to the atmosphere [1]. Consequently, it constitutes one of major phenomena in the hydrological budget, especially in arid and semi-arid regions. Furthermore, estimation of actual evapotranspiration using satellite data in the visible and infrared has been at the centre of several methodological approaches during the last two decades [2]. Three such methods are mentioned:
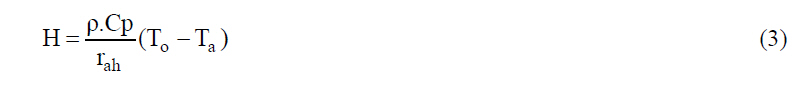
1) single-source models that do not distinguish between soil evaporation and transpiration, but treat the land surface as one homogeneous surface [10-12]. Their simplicity and yet physically sound basis has made the single-source models widely used. 2) dual-source models that discriminates the soil and vegetation component, aiming at a more physical description of heterogeneous surfaces when dealing with radiative and aerodynamic properties. However, they have limitations related to the difficulty of obtaining temperatures for the soil and vegetation [13]. SEBAL (Surface Energy Balance Algorithm for Land) [10] and S-SEBI (Simplified Surface Energy Balance Index) [11] are considered as single-source models. They have been developed to solve the energy budget equation using minimum ground data and a spatial approach assuming the existence of sites in extreme hydrological conditions (very dry and very wet). Properties from these sites are used to determine some variables at the soil-vegetation-atmosphere interface not possible to obtain through remote sensing. The overall intent of this study is to explore means for obtaining evapotranspiration maps for irrigated areas in Algeria, where ground data are scarce and hard to collect. A remote sensing approach is required to be routinely applied as a tool for providing both historical and near-real time evapotranspiration and surface energy fluxes for performing a better management of the agricultural water resources of the area. In this study, we propose a methodology based on SEBAL to solve the energy balance and monitor the surface moisture status from the Enhanced Thematic Mapper Plus (ETM+) aboard the NASA’s Landsat-7 Spacecraft. THEORETICAL BACKGROUND Currently, the energy balance equation at the surface is formulated as: Rn= G + H + LE (1) This equation expresses the partition of the net radiation (Rn) between soil heat flux (G), sensible heat flux (H) and latent heat flux (LE), corresponding to evaporation for a bare soil and transpiration for vegetation canopy. The net radiation is found from the various components of radiation exchanges: Rn= (1 -ro) · Rg + L↓ -L↑ (2) where Rg is the incoming global radiation, partly reflected depending on the albedo ro, L↓ and L↑ are the down-welling and the upwelling long wave radiation, respectively. The soil heat flux (G) is usually low in comparison with the other terms. Currently, we tend to neglect it, or to give it a fixed proportion of the net radiation (0.1 for example). The sensible heat flux H is expressed as a function of the near-surface air temperature difference (To -Ta) as:
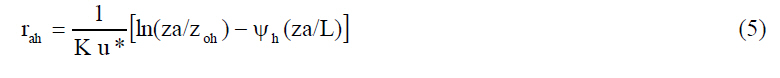
This expression involves (outside constants r and Cp, air density and specific heat, respectively) the aerodynamic resistance to heat transport rah which is a function of wind velocity, thermal stability effects of the atmosphere and surface roughness. To estimate the aerodynamic resistance to heat transport, some theoretical approaches have been used especially by Paulson [14]. They are essentially based on the use of logarithmic profiles of mass and energy transfer in the surface boundary layer and the coupling surface/boundary layer which operates in the level of fluxes in the basis of the convective boundary layer. The integration of speed profiles leads to two similarities functions ym and yh parameterized by the turbulent regime of momentum and heat. u* = K u/[ln(za/zom ) - ψm (za/L) ] = (4)
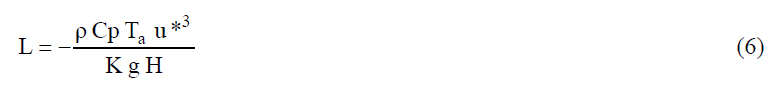
where u is wind speed at reference height (usually equal to 2 m), ym and yh are, respectively, stability correction for momentum transport and stability correction for heat transport and L is the Monin-Obukhov’s length, expressed as:
where u* is the friction velocity, K is the von Karman constant (»0,41), g is the acceleration due to gravity, zom is the roughness length for momentum transport. LE is the latent heat flux, expressed as:
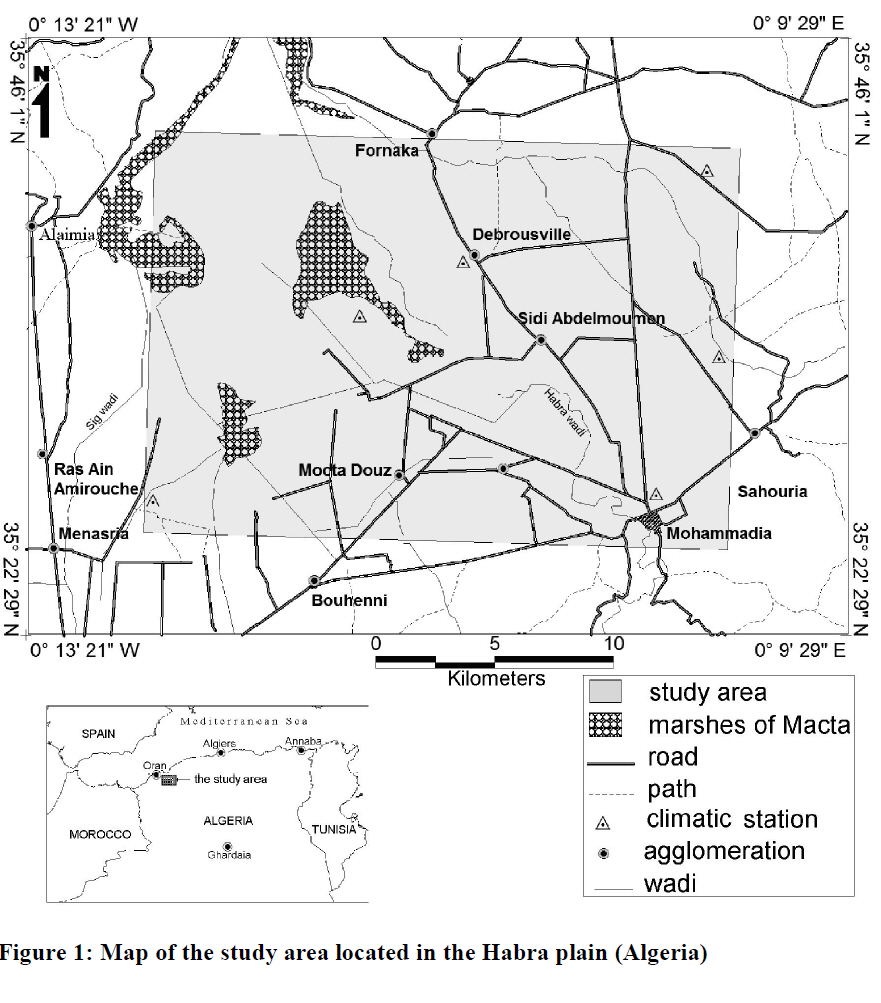
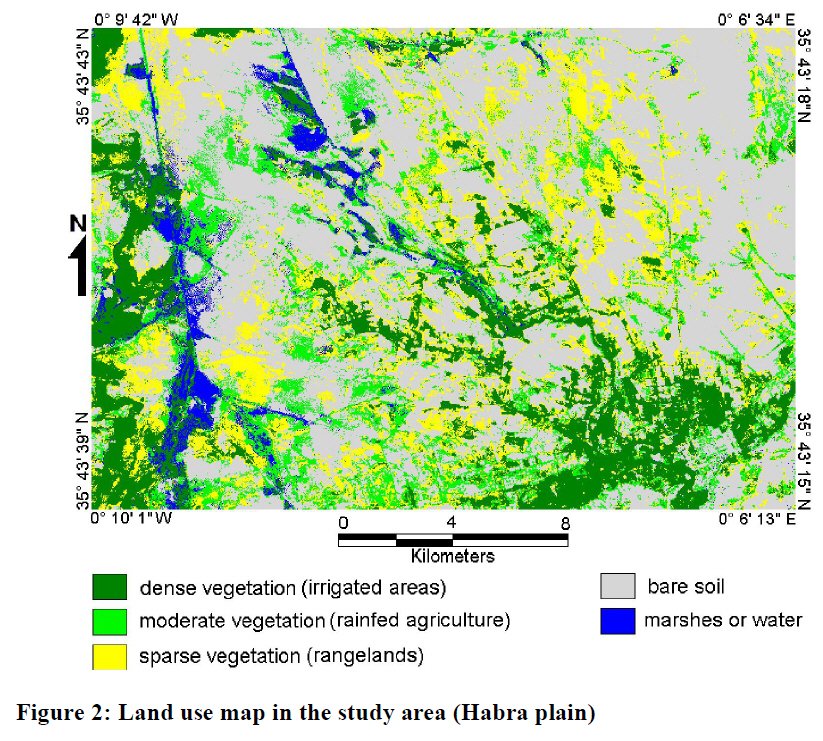
where γ is the psychrometric constant, rs is the surface resistance to evaporation, ea is the water vapour pressure at reference height (za) and esat(To) is the saturated vapour pressure at surface temperature. MATERIAL AND METHODS The study area The study area corresponds to the agricultural plain of Habra, which houses the irrigation area of Mohammadia. It is located in northwestern Algeria (Oran) between longitudes 0° 9' W and 0° 6' E and latitude 35° 34' N and 35° 43' N. It covers an area of 413 km2 (Figure 1). The selected area is part of the great interior plain of Macta, which is the receptacle of the second watershed of Algeria by its area (14500 km²) and only communicates with the Mediterranean Sea by a narrow channel. The average altitude is about 40 m. The soils in the plain of Habra are sedimentary formation with variable texture intake alluvial and alluvio-colluvial. They are distributed in the plain into entities more or less uniform and regular. Soil salinity is between 8 and 16 mS.cm-1 at a depth of more than 50 cm with low rate of leaching. The climate in the study region is Mediterranean semi-arid with mild winter. Two main periods characterized this region, a rainy period during the months of autumn (September, October and November), winter (December, January and February) and early spring (March and April), and a dry and hot period during the months of summer (June, July and August). The absolute minimum air temperature during winter down to 6 to 8° C. Summer is usually dry and warm. The absolute maximum air temperature is equal to 42° C. The average annual rainfall for the period 1980-2005 is about 450 mm [15]. The rural areas with rich soils are suitable for agriculture but where the soils are poor, livestock grazing is dominant (Figure 2). Irrigated agriculture is dominant in the study area and the main crops include fruits mainly citrus and garden crops such as artichoke. Rainfed agriculture occupies a small part and the main crops include cereals mainly barley. Water resources for irrigation are from Fergoug’s dam located eight kilometres south of Mohammadia city. Data sources The data set used in this study consists of seven spectral bands of Landsat-7 ETM+ (Enhanced Thematic Mapper Plus) sensor acquired on May 29th, 2000 at 10 H 30’ GMT. Optical bands (bands 1, 2, 3, 4, 5 and 7) are used for albedo and vegetation index calculations. Thermal band (band 6) is used for surface temperature. Spatial resolution is 30·30m on the optical bands and 60·60m on the thermal band. This high spatial resolution is well suited for monitoring evapotranspiration on heterogonous landscapes. The spectral bands of ETM+ sensor are supplied in digit numbers (encoded into an 8bit value) which are converted into radiances in the optical (visible, near and medium infrared) and thermal ranges using the linear relationship: Lλ = α · DN + β (8) where DN is the digit number and α and β are calibration coefficients. The spectral radiances in the optical range are converted into reflectances after correction for atmospheric effects using MODTRAN radiative transfer code [16]. These reflectances are then used to calculate the albedo (ro) and vegetation index (NDVI). The albedo (ro) is defined as a surface reflectance in the shortwave range (0.3-3 µm). It is calculated using the formula suggested by Liang et al. [17]: ro = 0.356 r1 + 0.13 r3 + 0.373 r4 + 0.085 r5 + 0.072 r7 -0.0018 (9) where r1, r3, r4, r5 and r7 are respectively the reflectances in channels 1, 3, 4, 5 and 7 of ETM + sensor. The vegetation index (NDVI) is calculated from the reflectances in the red (r3) and the near infrared (r4):
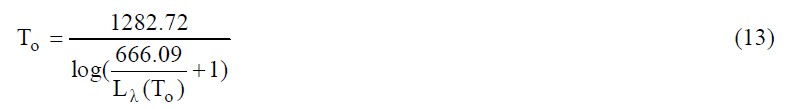
The spectral space-reaching radiance measured by the sensor in the thermal infrared (L&↑ sat(l)) is expressed by the following relationship: L↑ sat (λ ) = [ ελ Lλ (To) + (1-ελ )L↓ atm (λ )]τ l + ↑ atm (λ) (11) where Lλ (To) is the radiance of a blackbody target of kinetic temperature To, tλ is the atmospheric transmission, L↓ atm(λ) is the down-welling or sky radiance, L↑atm(λ) is the upwelling or atmospheric path radiance and ελ the emissivity of the surface which is estimated from the vegetation index (NDVI) [18]: ελ =1.0094 + 0.047log(NDVI) (12) The atmospheric parameters are estimated at time of satellite overpass by the web atmospheric correction parameters calculator [19]. They allow deducing the spectral radiances leaving the land surface by inversion of equation 11. Surface temperatures are finally obtained based on these radiances according to Planck's Law:
ESTIMATING OF SURFACE ENERGY FLUXES To access the evapotranspiration, SEBAL model is based on the estimation of the latent heat flux (LE) through the energy balance equation assuming that for Landsat image scale the local horizontal advection is ignored: LE = Rn -G -H (14) The estimation of net radiation (Rn) requires evaluation of: - incoming global radiation (Rg) obtained from exo-atmospheric solar radiation K↓ exo taking into account the transmissivity of atmosphere tsw: Rg = K↓ exo τsw (15)
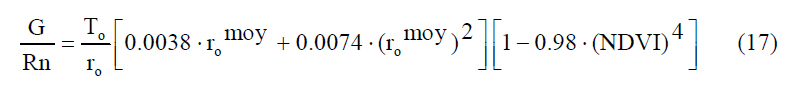
The soil heat flux G is empirically estimated using the expression suggested by Bastiaanssen et al. [21]:
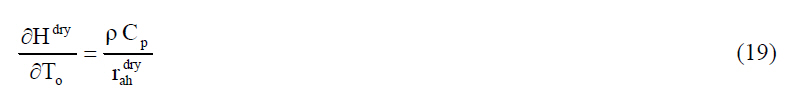
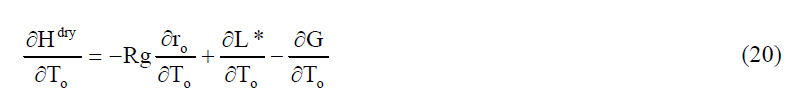
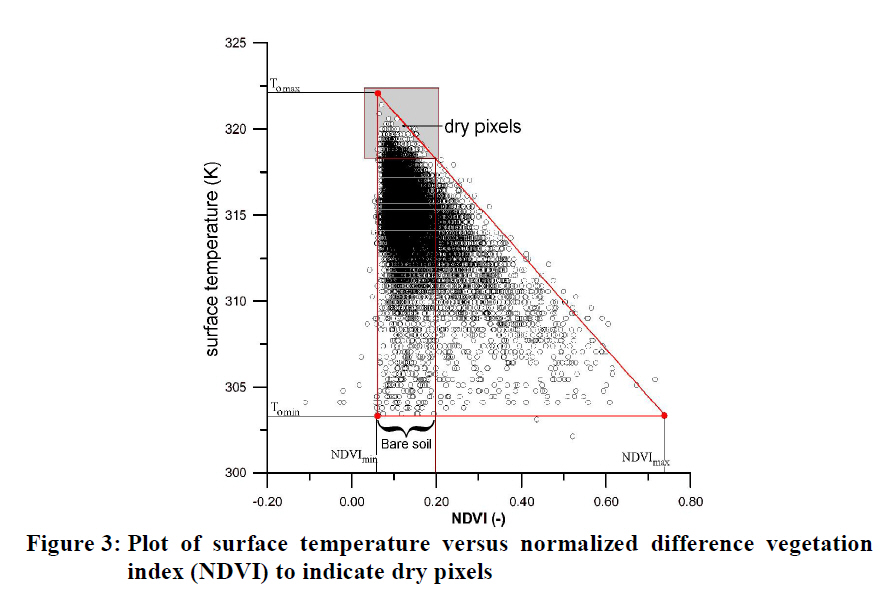
involving albedo, vegetation index, surface temperature and net radiation. It is then possible to estimate the sensible heat flux according to the near-surface air temperature difference and the aerodynamic resistance to heat transport (rah). This later takes into account the atmosphere thermal stability effects, which represents a delicate point. Indeed, the original approach suggested in SEBAL [10] for estimating rah is based on the use of averages profiles in the atmospheric boundary layer in which vertical fluxes (momentum flux, friction velocity, wind speed) can be considered constant even over heterogeneous terrains. It is, therefore, possible to assume that, for dry pixels, the latent heat flux is zero and the energy balance equation is expressed as: Hdry = Rn – G (18) The dry pixels are indicated at bare soils (NDVI values close to zero) having high surface temperature according to the triangle method [22] (Figure 3). On these pixels, the aerodynamic resistance to heat transport (rahdry) is determined according to:
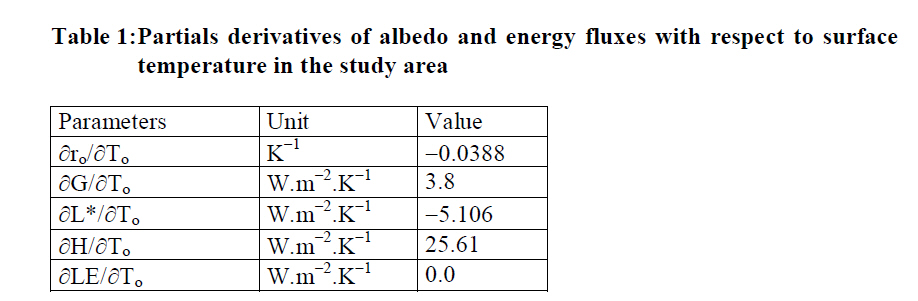
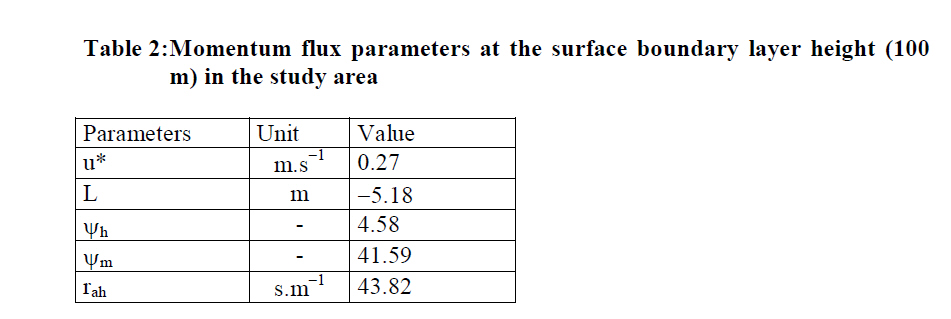
corresponding to a combination of equations 1 and 2 followed by differentiation with respect to surface temperature To. L* is the net longwave radiation (L* = L↓ -L↑). The determination of Equation 19 enables us assessing the effective aerodynamic resistance to heat transport for dry pixels at blending height (generally set to 100 m) [21]. Using rahdry into an iterative process allows obtaining the effective friction velocity u*100 at this height (Table 2). We can then obtain the wind speed (u) at reference height using the logarithmic profiles. The integration of aerodynamic momentum roughness zom into a second iterative process enables us mapping the friction velocity u* at reference height. Finally, the use of Monin-Oubukhov’s similarity hypothesis allows us mapping aerodynamic resistance to heat transport following equation 5. The near-surface air temperature difference (To-Ta) is computed using a linear relation between air and surface temperatures. The slope and offset are estimated inverting the sensible heat flux expression over wet areas (To = Ta) and dry areas (H = Rn -G) [23]. The use of equation 3 enables us computing the sensible heat flux in pixel basis and solving the energy balance equation. This step leads mapping the latent heat flux. This should help interpreting accurately the behaviour of a surface with respect to water stress [24]. It is therefore preferable for an easier interpretation to deduce moisture indicators such as evaporative fraction (Λ), Priestley-Taylor parameter (α) and the surface resistance to evaporation (rs). MAPPING ACTUAL EVAPOTRANSPIRATION The actual evapotranspiration is one of the most useful indicators to explain whether the water is used as intended or not. Evapotranspiration variations, both in space and time, and from different land use classes (particularly from irrigated lands) are thought to be highly indicative for the adequacy, reliability and equity in water use. The knowledge of these terms is essential for judicious water resources management. Among the existing approaches on the estimate of actual evapotranspiration from remotely sensed data, we can retain that based on evaporative fraction assumption. This one is estimated from instantaneous measurements according to:
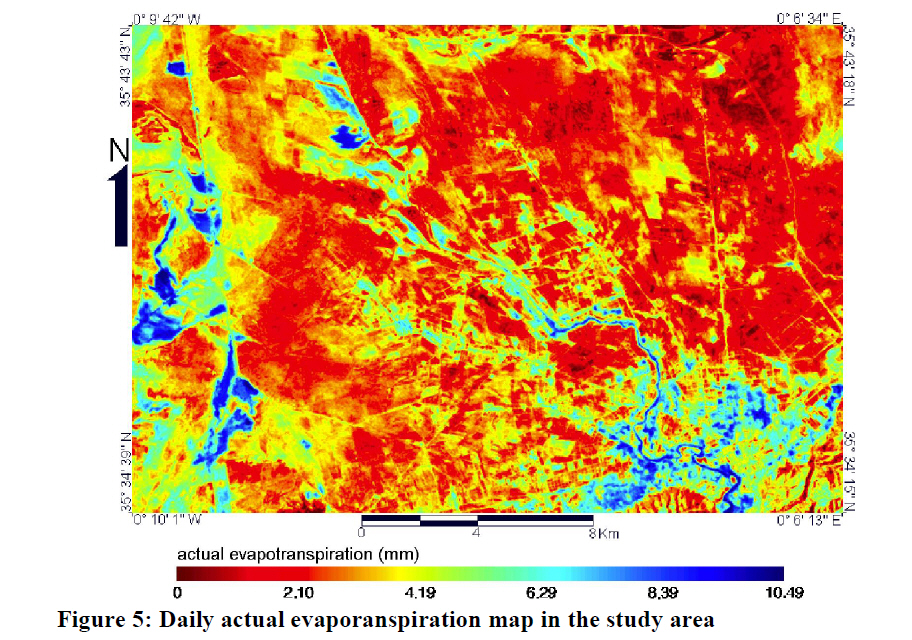
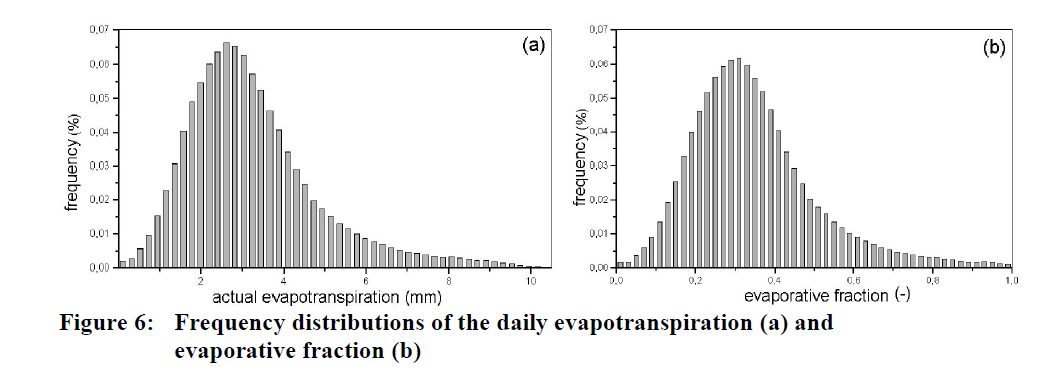
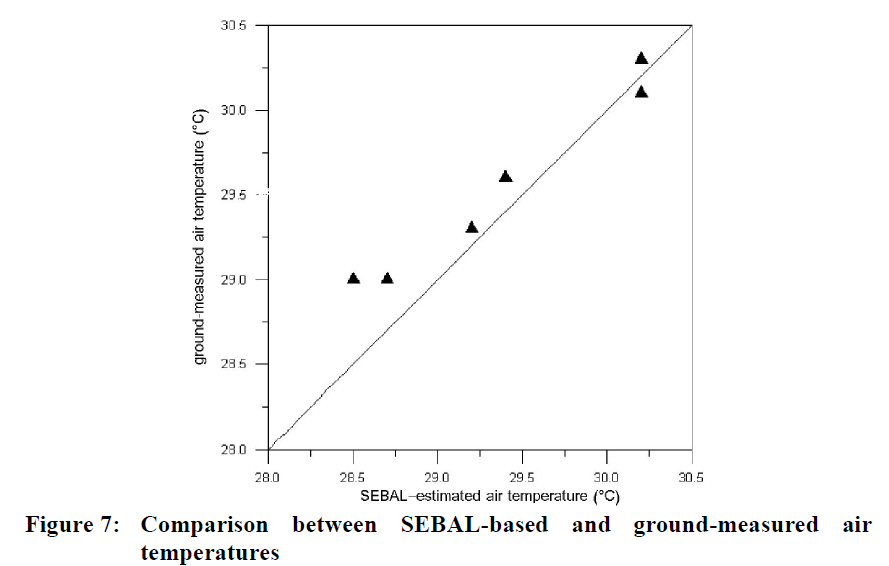
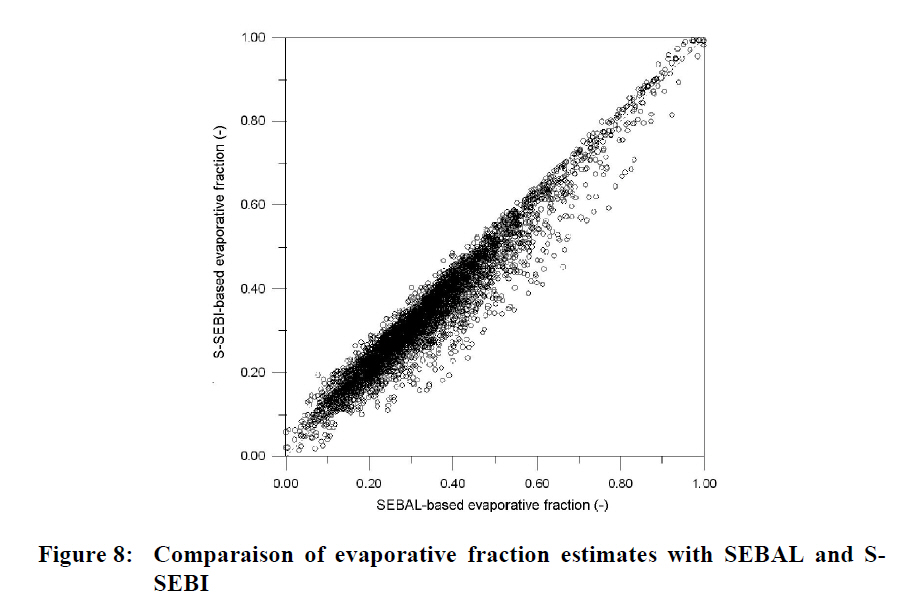
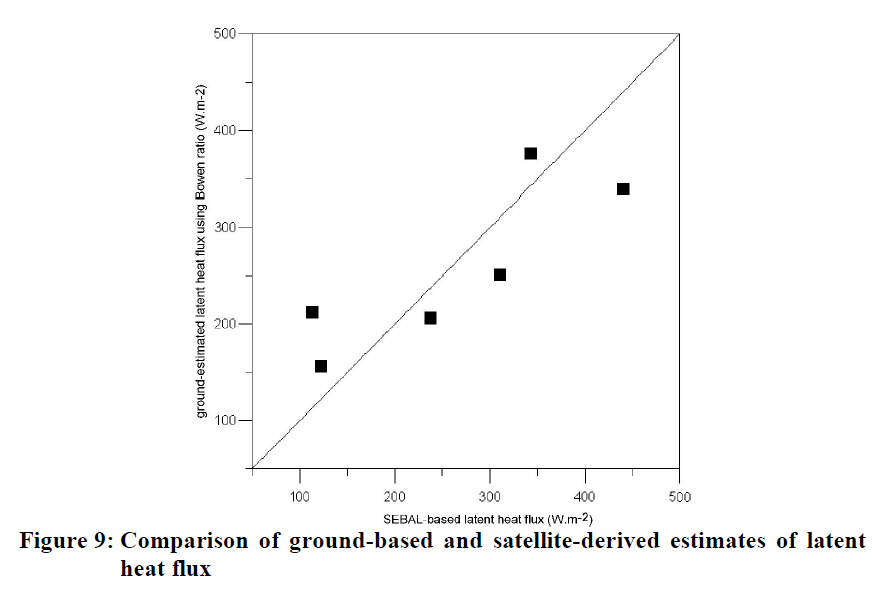
which is considered similar to its daily counterpart [25-27], and is used to compute the daily actual evapotranspiration ETRd from instantaneous latent heat fluxes. Ignoring the soil heat flux on a day basis [21], the daily actual evapotranspiration can be computed from daily net radiation and instantaneous evaporative fraction: ETRd= Λ · Rnd (22) The daily net radiation can be computed according to Slob [28] where the surface albedo is assumed to be similar to the surface albedo during the morning overpass, and the daily global radiation and atmospheric transmittance are taken from the field measurements: Rnd = (1 -ro) Rgd -110 τswd (23) RESULTS Through modelling the energy balance equation with SEBAL, it has shown that the basic parameters (albedo, vegetation index and surface temperature) obtained from the satellite imagery leads to determine the latent heat flux (LE) as the residual term of this equation. The albedo is derived from a combination of reflectance in the short wavelengths bands. It varies for canopy on the image between 0.15 and 0.19, which seems acceptable. The surface temperature is calculated from the radiance in the thermal infrared band using the vegetation index for estimating surface emissivity. An error of 1% on the emissivity value leads to an underestimation of the surface temperature of about 0.4 - 0.8 °C [5]. It would therefore be desirable to conduct advanced physical studies to increase the accuracy of the emissivity estimates. Indeed, surface temperature (To) is indirectly linked to the latent heat flux (LE) through the energy balance equation. It provides important information on surface water status. The analysis of correlation between To and LE shows a strong dependence between these two variables (r = -0945) (Figure 4). However, the NDVI and albedo, although they provide interesting information in interpretation of thermal data [22,29], are less significant in the discrimination of surface water status because their correlation coefficients with the latent heat flux are respectively 0.55 and 0.49. The surface temperature varies on the image between 302.1 and 326.7 K. The higher values correspond to areas where bare soil are dominant, while low values are associated with areas where vegetation cover is dense. Similarly, the average surface temperature on dry pixels is higher than that on wet pixels (Table 3). We note also on the table 3 that rah for dry pixels is low, causing the release of sensible heat to the atmosphere. This is justified by high differences between surface and air temperatures. However, rah values for wet pixels are high because the net available energy (Rn-G) is mainly used in evapotranspiration. The results presented in table 4 summarize the energy fluxes and moisture indicators for different land use units. It note that high values of evapotranspiration are observed on the irrigated areas with dense vegetation (8.73–0.9 mm) and water bodies (8.91–1.75 mm), while low values are on the bare soils (0.95–0.44 mm), corresponding to high values of albedo. This allows emphasizing that the spatial distribution of SEBAL-derived evapotranspiration is correlated to the water regimes of the different land use units. In SEBAL, the evapotranspiration is estimated as the residual term of the energy balance equation involving the net radiation, the soil heat conduction and the atmosphere convection. However, other factors as the advection of sensible heat flux from dry areas, both local and regional, constitutes a significant source of energy that has a major impact on evapotranspiration from wet areas by augmenting evapotranspiration in excess of the available energy rather frequently. In this study, the maximum SEBAL-obtained evapotranspiration (10.49 mm) is close to the groundmeasured evaporation (10.8 mm) which means that the horizontal advection is very low (around 0.31 mm). In figure 5, daily actual evapotranspiration varies between 0 and 10.49 mm with a clear dominance of surfaces subject to water stress more or less strong. However, the optimal water condition is only observed on a small area. The dominance of water stress is clearly observed in the frequency distributions of daily evapotranspiration and evaporative fraction (Figures 6a and 6b). DISCUSSION The estimated evapotranspiration should be considered with caution and have only a relative value, because there is no method of validation over wide scales of time and space. However, the originality of SEBAL, as for the spatialization of the air temperature and determination of wind speed, gave relatively realistic estimates of these two parameters, which is a very positive point for validating SEBAL outputs. The result of comparison between SEBAL-based and ground-measured air temperatures is shown in figure 7. It shows that the model provide results close to references, with a RMSE about 1.4 °C. This showed that the assumption of a linear relationship between surface and air temperature is valid. In addition, the SEBAL simulated wind speed (2.9 ms-1) is close to the ground-measured wind speed at time of satellite overpass (3 ms-1). This showed that the model provide good estimates of wind speed. The used approach gave a maximum value of the actual daily evapotranspiration of 10.49 mm which is slightly lower than 10.8 mm of the daily evaporation measured by the Piche evaporimeter. Another simplified approach to solve the energy balance equation is based on the S-SEBI concept [11] that allows expressing the partition of available energy (Rn-G) into sensible and latent heat fluxes through the evaporative fraction (Λ) :
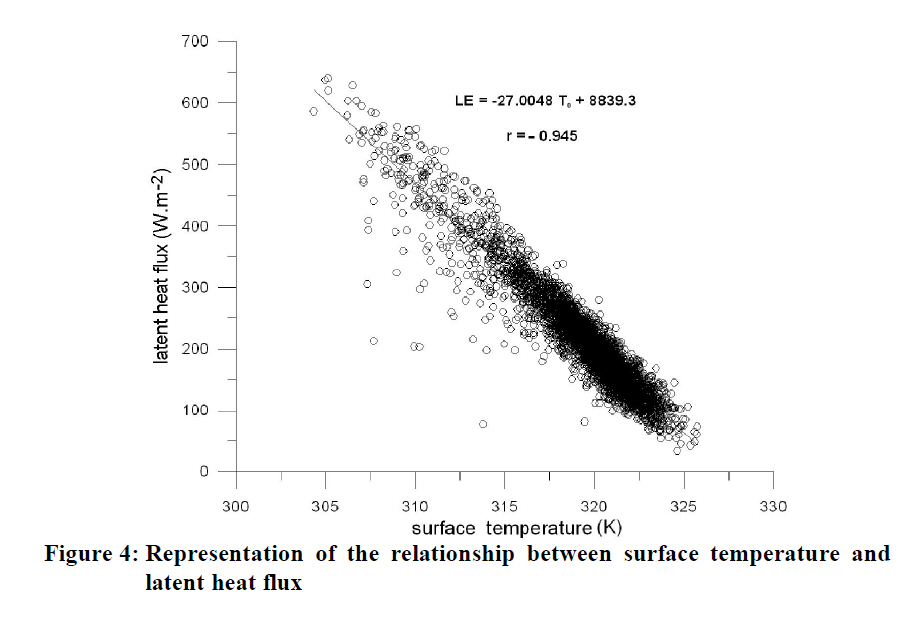
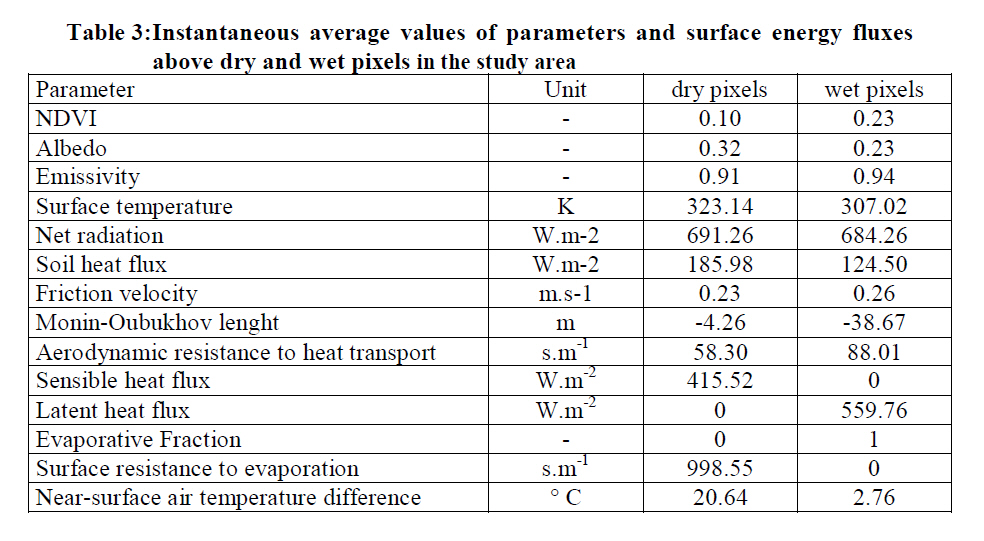
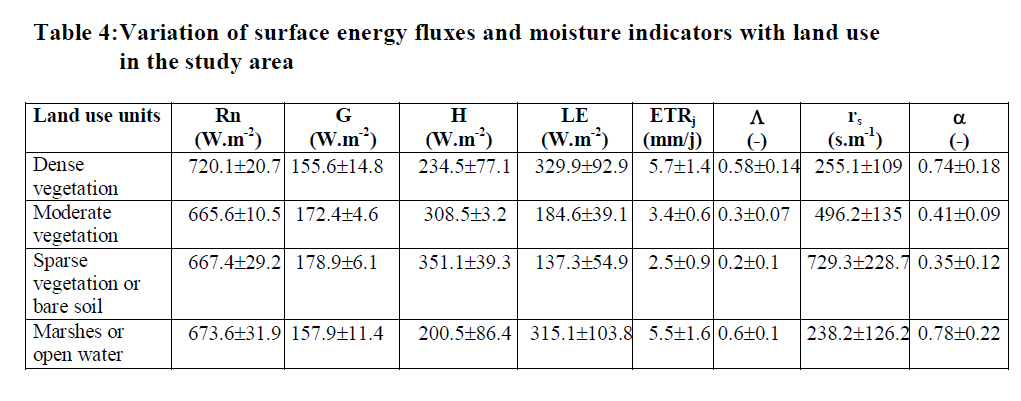
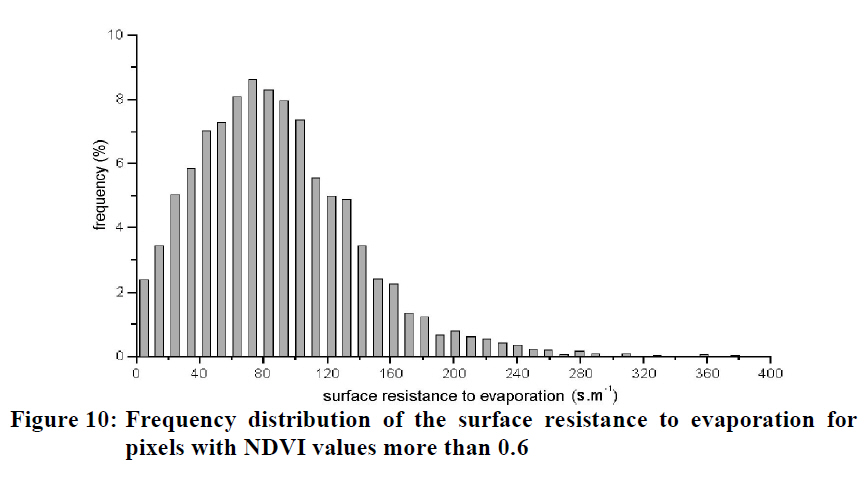
where TH and TLE are the temperatures corresponding to dry and wet conditions for a given albedo value. The comparison of the evaporative fraction estimates with SEBAL and S-SEBI shows good agreement (Figure 8) which justifies the validity of the used approach. Another method can be used for validating the obtained results. It is to compare latent heat flux values obtained by SEBAL from the image with those estimated on the ground using Bowen ratio. The result of this comparison is shown in figure 9. It shows a significant discrepancy between remote sensing and ground estimates of latent heat flux, with a RMSE about 72 W.m-2 and a correlation coefficient of 0.70, that is ascribed to inaccuracies on the intermediate variables such as surface emissivity, soil heat flux, roughness length and air temperature. The analysis of frequency distribution of surface resistance to evaporation is considered another way to validate results. Bougeault et al. [30] and Bastiaanssen et al. [31] showed that for most crops covering entirely soil, values of this resistance vary between 10 and 400 sm-1 with generally peaking around 80 s.m-1 [31]. The result shown in figure 10 is approximately consistent with this indication. CONCLUSION Recent developments in remote sensing techniques have resulted in many new applications. One of these applications is the study the interactions between land surface and atmosphere at a regional scale. The remote sensing radiances in the visible, near infrared and thermal infrared ranges can be used to determine albedo, vegetation index and surface temperature. By incorporating various models, these parameters can be used to estimate evapotranspiration and surface energy fluxes. The aim of this study is to map evapotranspiration from Landsat-7 ETM+ data using SEBAL model. The results obtained confirm the opportunities presented by high resolution remote sensing satellites, such as Landsat ETM+ or ASTER, to solve the energy balance equation, assess the water stress degree and clearly differentiate the parcels subject to different water systems. However, the evapotranspiration and surface energy fluxes estimates can not be regarded as very accurate compared to data points. This shows a significant discrepancy between remote sensing and ground estimates of latent heat flux, with a RMSE about 72 W.m-2 and a correlation coefficient of 0.70, that is ascribed to inaccuracies on the intermediate variables such as surface emissivity, soil heat flux, roughness length and air temperature. Despite these inaccuracies, the used approach is quite suitable for a real exploitation of satellite data to estimate a number of parameters at the soil-plant-atmosphere continuum. These parameters have the advantage of being spatialized and provide a spatiotemporal coverage better than the data points measured operationally. However, they pose the problem to be indirect and require the use of radiative transfer modelling within the atmosphere and at the surface for their interpretation in terms of physical parameters. ACKNOWLEDGEMENT The authors thanks are addressed to the national meteorology office (ONM) in Oran (Algeria) for having made available climatic data and to AJFAND reviewers for their pertinent comments. REFERENCES
Copyright 2011 - African Journal of Food Agriculture, Nutrition and Development The following images related to this document are available:Photo images[nd11009f7.jpg] [nd11009f2.jpg] [nd11009f3.jpg] [nd11009t3.jpg] [nd11009f5.jpg] [nd11009t1.jpg] [nd11009f10.jpg] [nd11009t4.jpg] [nd11009t2.jpg] [nd11009f9.jpg] [nd11009f4.jpg] [nd11009f6.jpg] [nd11009f8.jpg] [nd11009f1.jpg] |
| |||||||||


 Remote sensing data are supplemented by meteorological measurements for temperature and humidity of air, wind speed, global radiation, relative sunshine duration and daily evapotranspiration. These measurements are collected from six weather stations (Mohammadia, Debrousville, Sidi Abdemoumen, Sahouria, Menasria and Elghomri) located in the study area.
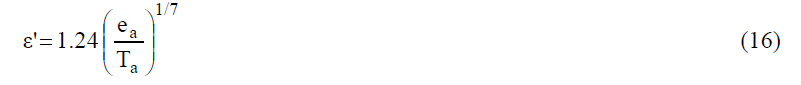

