 |
| About Bioline | All Journals | Testimonials | Membership | News |
|
||||||
|
||||||
African Journal of Food, Agriculture, Nutrition and Development, Vol. 11, No. 2, 2011 pp. 4632-4646 Assessment Of Protection And Comparative Advantage In Rice Processing In Nigeria Oguntade AE1* Department of Agricultural Economics and Extension, Federal University of Technology, Akure, Nigeria. *Corresponding author email: oguntadeade@yahoo.co.uk Code Number: nd11013 ABSTRACT This study was carried out to determine
the contributors to value-addition in the processing of paddy rice into basic
milled rice and value-added rice as well as analyze the comparative advantage
and competitiveness of rice processing in Nigeria. The extent of policy distortion and agricultural protection was also
determined by the study. The data were collected from Ebonyi State,
Nigeria, a major rice processing state with 850 registered small-scale
processors. Data from other secondary sources were also used. The main analytical framework used was the Policy
Analysis Matrix (PAM). The policy distortions were measured through Nominal
Protection Coefficient (NPC) and Effective Protection Coefficient (EPC). Private
Profitability Coefficient (PPC) was used to measure the comparative advantage a
processor has in producing value-added rice while the Domestic Resource Cost ratio (DRC) was selected as the
measure of the comparative advantage Nigeria has in producing the commodity.
The results show that the total value addition in the processing of paddy rice
into basic milled rice was Key words: rice processing competitiveness, comparative, advantage INTRODUCTIONRice is an important staple food in Nigeria. Many Nigerians have developed tastes for polished and size-sorted medium to long-grained rice. Local production of paddy rice has been increasing over the years. The estimated annual paddy rice output rose from 2.75 million tonnes in 2001 to 3.19 million tonnes in 2007. In spite of this, imports of rice have also been increasing. The annual imports of rice into Nigeria rose to about 1.77 million tonnes in 2001 before declining to 1.04 million tonnes in 2005 [1]. In 2008, rice imports were 1.6 million tonnes and were estimated to remain at this level per annum up to 2010 [2]. Government policies affecting rice production have been directed at protecting the local industry through tariffs and providing extension support to rice farmers. The import tariff on value-added rice was 100% in 1995, 50% in 1996 through 2000 and 85% in 2001 [3]. With effect from May 2008, rice imports into Nigeria were declared free from all duties and charges, including customs duty, 7% surcharge, Value-Added Tax and levies. However, by March 2009, a 50% rice levy has been instituted [4]. With this tariff level, local production of rice is expected to be expanded through increased production of paddy by farmers responding to higher paddy price. Local processors are expected to increase capacity utilization and use improved processing equipment. The continuous increase in rice production and processing will depend on the international competitiveness and effects of policy intervention. The removal of all forms of tariffs as the government did in 2008 will change the structure of economic incentives. This, in turn, will cause major adjustments in the pattern of production, allocation of resources and trade flows. The analysis of competitiveness and comparative advantage will provide an indication of the effects of policy. Comparative advantage of a country in a commodity usually results from relative superiority in resource endowments required by the commodity. It puts the country in a vantage position to specialize in the production of the commodity. Competitive advantage is created through appropriate combination of knowledge and other critical resources to gain significant share of the world market for a particular commodity. Competitive environment and the capability of firms in the industry to innovate and improve their technologies contribute to the achievement of competitive advantage. The use of comparative advantage analysis covers not only on-farm production but incorporates downstream collection, processing and wholesaling activities as they relate to a particular commodity [5]. The objective of this paper is to assess the comparative advantage and competitiveness of rice processing in Nigeria based on data collected from rice processors in Ebonyi State, a major rice-processing centre in Nigeria METHODOLOGY Sources of data and data collection technique Ebonyi state, located in southeast Nigeria, is one of the paddy rice producing states in Nigeria [6]. It also has a major concentration of rice processors. The Abakaliki rice industry, located in the state, has been a major player in the local rice sector. The industry has 850 registered millers all situated in single well laid out industrial locations. Each miller has 0.6 tonne per hour milling capacity. Capacity utilization was low ranging from 10% to 35% because of inadequate supply of paddy rice for processing. The data on the costs and returns to rice processors were collected from operators in the industry. A key informant who is a major processor in the industry provided the initial overview of the industry. Based on the overview provided, the industry was categorized into two, namely: basic processing (milling of paddy) and further processing (polishing, size sorting and bagging). Data on costs and returns were collected from purposively selected operators. The basis of selection is the availability of record on milling operations.[1] Data collection was carried out in October 2008 through personal interviews, direct observation and extraction of data from the records kept. Other data collected include exchange rate, cost of paddy and value-added rice at point of embarkation, excluding transportation and insurance costs (FOB). The source of the exchange rate is the Central Bank of Nigeria [7] while the FOB values were obtained from FAO [8]. The FOB values were adjusted for freight and insurance to arrive at the cost of paddy and value-added rice at Lagos ports (CIF). Data analysis Value chain analysis and the policy analysis matrix (PAM) were used to analyse the data collected. Value chainThe value chain analytical approach is used for breaking down the sequence of business functions into the relevant activities through which utility is added to products and services. Value chain analysis is undertaken in order to understand the behaviour of costs and the sources of differentiation [9]. The analysis of basic records kept by the processors formed the basis for analysing the cost structure. Record keeping was basic. Since the processors are situated in one large industrial layout, price variations in the various processing services were little or none existing. Standard charges for milling operations and the related activities reigned. The total cost of processing per tonne of rice was broken into component units and the percentage contribution of each component to the total cost was determined. Policy analysis matrixThe policy analysis matrix (PAM) was used to analyse the data collected. The PAM is a product of two accounting identities. One defines profitability as the difference between revenue and costs while the other measures the effect of the divergences (distorting policies and market failures) as the difference between observed parameters and parameters that would exist if the divergence were removed [10]. The PAM is a framework for presenting the effects of policies and policy changes on incentives applied to production or marketing alternatives [11]. It provides a methodology for assessing the incentives for economic actors in a commodity chain at micro economic level. Central to these incentives are competitive advantages in costs and revenues and how these shift with policy. The PAM also examines relative social profitability of alternative economic activities, the efficiency of resource use in the pursuit of maximising national income [11]. The basis of PAM is a set of profit and loss identities [12]. The PAM, as an empirical framework, provides measures of economic efficiency and of transfer effects of policy on particular commodities, technologies and region. The PAM results, thus, serve as an information baseline for monitoring and evaluating the effects of policy and for identifying policy-relevant research needs [13]. In the accounting matrix of PAM, all measures are given as monetary units per physical unit of some commodity. Following from Monke and Pearson, [10], the basic PAM matrix format is presented as in Table 1. Table 1: Basic Policy Analysis Matrix Format
Source: [10] The average Nigerian’s perception of good quality rice is the American long grain rice, which was first introduced into the Nigerian market under the trade name “Uncle Bens” in the 1970s. All local production and imports are oriented towards this standard. In the Nigerian rice market, there, however, are different brand names all striving to meet this quality and because of local bagging and re-bagging under these brand names, the original sources of the products are obscured irrespective of the claims on the bags. Value-added rice produced in Abakaliki and elsewhere in Nigeria once bagged easily competes with the imported products. Thus, for computing social prices, US FOB prices were used as the reference prices[2]. These were adjusted for insurance and freight to arrive at CIF Lagos prices. Lagos is a major rice consumption centre. The CIF Lagos prices were converted to Nigerian currency (Naira) at the exchange rate of N130.00 to the US dollar, which was ruling at the time of data collection. The private profits (D) indicate competitiveness, given current technologies, prices of input and output, and policy. The social profits reflect social opportunity costs and serve as a measure of efficiency as well as comparative advantage. A positive social profit indicates that the country uses scare resources efficiently and has a static comparative advantage in the production of that commodity at the margin. Similarly, negative social profits suggest that the sector is wasting resources, which could have been utilized more efficiently in some other sectors. In other words, the cost of domestic production exceeds the cost of imports suggesting that the sector cannot survive without government support at the margin. Based on the PAM table, two measures of protection and two measures of comparative advantage were estimated. These are the Nominal Protection Coefficient (NPC) and the Effective Protection Coefficient (EPC) as measures of protection and the Private Profitability Coefficient (PPC) and the Domestic Resource Cost Coefficient (DRC) as measures of comparative advantage. The NPC is the ratio of domestic price to a comparable world (social) price. It can be calculated for both output and input. The NPC for output, calculated as A/E, measures the effects of policy intervention on output prices. The NPC on tradable inputs, defined as B/F, indicates the effects of policy intervention on input prices. The EPC is defined as A-B/E-F. An EPC greater than one suggests that government policies provide positive incentives to producers while EPC that is less than one implies producers are not protected through policies. The PPC measures the comparative advantage an individual producer has in producing the commodity. It is calculated as C/(A-B). A PPC greater than one indicates that the resource cost is greater than the value added. This means it is not profitable for the producer to produce the commodity. This calls for a policy of output tax reduction or input subsidies. The DRC is a measure of the comparative advantage a nation has in producing a commodity. It indicates whether the use of domestic factor is socially profitable (DRC<1) or not (DRC>1). It is calculated as G/(E-F) [15]. RESULTS Functional analysis of rice industry The functional analysis of Abakaliki rice industry is presented in Table 2. Out of the five stages in the chain, only two are directly processing-related: primary processing and further processing. The function in the first stage is cultivation while the functions in the second and the last stage are marketing and transportation, respectively. While most of the paddy rice processed by the millers was the outputs of smallholder farmers, some of the millers integrated backwards into rice cultivation in order to obtain more paddy rice for their mills and increase their capacity utilization. Local traders who procured paddy rice from farmers in Ebonyi, Cross River and Benue States and supplied the millers were largely responsible for the primary marketing function. However, some millers also engaged in this function. They procured rice directly from farmers’ farms and delivered to their own mills and occasionally to others. The major functional constraint to the industry is cultivation, which in spite of backward integration by processors it was not possible to obtain adequate quantities of paddy to meet the processing capacities. Table 2: Functional Analysis of Abakaliki Rice Industry
Source: Output of field data analysis, 2009 Value structure of primary processingPrimary processing converts paddy into basic milled rice. Activities undertaken in this stage are parboiling, drying, milling and bagging. Table 3 presents the value structure for primary processing. The table shows that the value of the primary input into primary processing, that is rice paddy, was N79,444 while the value of the output, basic milled rice, was N100,000. The value addition was about N20,000 or 20% of the output. The important contributors to value addition were finance (6.95%), milling (5.00%), wood (3.13%) and labour (2.78%). The margin was N1,660 (1.66%) of the final output’s value. All values additions are per tonne of basic milled rice. Table 3: Value structure in the transformation of paddy
to basic milled rice
1.527tonne of paddy is required to produce 1.0 tonne of milled rice because the input: output ratio is 1:0.65
Source: Author’s computation,
2009
Value structure of further processing Further processing converts basic milled rice into value-added rice. The processing activities undertaken in this stage are drying, stone removal, polishing, size sorting and bagging. Table 4 presents the value structure for further processing. The table shows that the value of the primary input (basic milled rice) per tonne of output in this stage was N106,500 while the value of the output was N128,000. Table 4: Value structure in the transformation of basic milled rice to value added rice
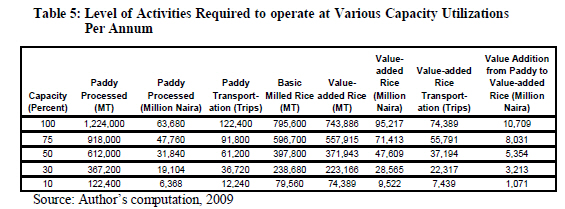
1.065 tonne milled rice is required to produce 1.0 tonne of value added rice because the input: output ratio is 1:0.935 Source: Author’s computation, 2009 The value addition was about N21,500 or 17% of the output. The margin was N7,667 (6.00%) of the final output. The other contributors to value addition are finance (5.10%), size sorting (1.95%) and stone removal (1.30%). All value additions are per tonne of value-added rice. Level of activities at various capacity utilizations Table 5 shows the levels of activities required for the industry to operate at various capacity utilizations per annum. Capacity utilization in the manufacturing sector in Nigeria is estimated at 53.5% [16]. The table shows that for the industry to operate at 50% capacity utilization, smallholder farmers and millers who have integrated backwards will have to produce/supply 612,000 metric tonnes of rice paddy valued at N31.84billion. Agents carrying out primary marketing will make 61,200 trips with standard 10 metric lorries to convey the paddy to the industrial complex while wholesalers will make 37,194 trips out of the industry conveying 371,943 metric tonnes of polished rice valued at N47.6billion out of the industrial complex to different parts of the country. At 50% capacity, the value addition from paddy to value-added rice would be N5.4billion. This amount does not include the value addition due to cultivation, primary marketing which delivers paddy rice to the mills and marketing of the final product which delivers the polished, size-grade (value-added) rice to the city markets. Protection and comparative advantage The policy analysis matrix for rice processing; from paddy to value added rice, is presented in Table 6. The table shows that private profit was positive (N9,445) given current technologies, prices of inputs and output; and existing policy. Social profit, however, was negative (-N26,256) indicating that the cost of domestic production exceeds the cost of imports suggesting that the sector cannot survive without government support at the margin. Table 6: Policy Analysis Matrix for rice processing
The estimated coefficients of protection and comparative advantage are presented in Table 7. The NPC for output was 1.74 while, for tradable inputs, the NPC was 1.27. The fact that these two coefficients, which are the ratio of domestic prices to comparable world (social) prices, were positive and greater, indicates that domestic price of value-added rice has been kept higher than world price through policy interventions. The value of the NPC for output is a reflection of government policy of placing tariff of up to 50% on the imports of value-added rice. The value of the NPC for input is a transmission of policy’s impact on output (value-added rice) to input (rice paddy). Policy has, therefore, succeeded in keeping the price of paddy above world (social price) and hence provided incentive to farmers to cultivate rice. Table 7: Coefficients of protection and comparative advantage
The EPC combines the effects of policy on inputs and outputs. It, therefore, serves as a better indicator of protection than NPC. The EPC was positive (6.41), indicating that government policy provided incentives to those processing paddy rice into value-added rice. The PPC was less than one (0.78) indicating that the resource cost was less that value-added. This implies that it was profitable for a producer to process paddy rice into value-added rice. The DRC was 4.88. This is an indication that it is not socially profitable to process paddy rice into value-added rice, that is, Nigeria has no comparative advantage in processing paddy rice into value-added rice. DISCUSSIONIn this study, the value chain approach was used to present a functional analysis of the rice industry in Abakaliki, Ebonyi State, Nigeria and to estimate the contributions to value-additions in the transformation of paddy rice into value-added rice. Based on the output of the functional analysis and the value additions estimated, the level of activities required to operate at 10%, 30%, 50%, 75 and 100% capacity utilizations were estimated. The Policy Analysis Matrix was applied to the processing of paddy rice into value-added rice in Nigeria based on data collected from Abakaliki rice industry and other secondary sources. It was concluded that the value addition in the transformation of rice paddy to basic milled rice was 20% of the output. Financing and milling contributed 6.95% and 5.00%, respectively to the value-addition. The margin was just 1.66% of the value of basic milled rice. The value-addition in the transformation of basic milled rice into value-added rice was 17% of the output. The margin was 6.00% of the final output while financing was 5.10% of the value of the final output. Financing, which is a major contributor to value-addition, is a reflection of the cost of capital in the country. Policies directed at reducing lending rates will hence reduce rice processing costs. From the study, it can be inferred that rice processing was profitable given the policy environment in which rice processing was undertaken. The study shows that further processing was more profitable than primary processing. The margin per tonne of primary processing being N1,660 while that of further processing was N7,667. Thus, a rational rice processor should strive to process paddy rice beyond basic milled rice to value-added rice, which is the output from further processing. The rice industry is capable of contributing significantly to employment generation and value additions if it can operate at a reasonable level of capacity utilization. If all the rice millers in Abakaliki rice industry were able to operate at about 50% capacity utilization, which is the estimated level operations of the manufacturing industries in Nigeria, the industrial complex would produce 371,943 metric tonnes of polished rice valued at N47.6billion. The value addition from paddy rice to value-added rice would be N5.4 billion. Since under-utilization of capacity is due to inadequate supply of paddy, policies must be directed at increasing the production of paddy. The results from the PAM show that the price of value-added rice has been kept higher than the world price through policy interventions. Government policy has, therefore, provided incentives to processors of paddy rice into value-added rice. This is captured by the NPC for output which was 1.74. The effect of protection policy was also transmitted to farmers producing paddy rice as captured by NPC for tradable inputs which was 1.27; paddy rice being the main tradable input into rice processing operations. The policy of government has, therefore, succeeded in providing incentives to both rice processors and farmers. Although it was profitable for a producer to process paddy rice into value-added rice given the policy environment, Nigeria has no comparative advantage in processing paddy rice into value-added rice. There is, hence, a social cost attached to rice processing as a result of the protection provided by government. The import tariffs policy has resulted in a transfer from consumers to producers and especially processors. It is not certain that this is the intention of policy makers since there is no pronouncement to this effect. It is, however, certain that the government intends Nigeria to achieve self-sufficiency in food production [17]. This policy may, hence, be contributing towards the achievement of this objective in the sense that it provides incentives to processors and farmers. The fact that there is a significant underutilization of capacity by rice processors in Abakaliki rice milling industry in Ebonyi State due to inadequate supply of paddy, also seems to support the policy of providing incentives to paddy producers. This is in line with Monke and Pearson’s argument that distortions are sometimes caused by governments when they consciously trade off efficiency losses against their perception of non-efficiency gains such as changes in income distribution and improvement in the countries' ability to feed themselves [10]. CONCLUSION The production and processing of rice paddy in Nigeria will be negatively impacted by the removal of government protection. Protection policy should, however, not be pursued on a long-term basis because it results in transfer from consumers to producers, which keeps the price of rice higher than it will otherwise be. While it is being applied in the short run, it should be complemented by policies to accelerate technology development and utilization at the farm level to increase the supply of paddy locally and enhance the competitiveness and comparative advantage of the rice industry in Nigeria. This is because there is a significant under-utilization of capacity among processors due to inadequate supply of paddy. There is, therefore, a need to increase output of rice paddy in Nigeria. Technology development for the farm level should be directed at increasing yield per hectare and reducing production cost per tonne of paddy rice, which accounts for about 80 percent of the value of basic milled rice. This will provide a basis for creating competitiveness in the rice industry. [1] Processors that were selected randomly from the list of 850 registered millers who did not keep any form of written records were dropped to avoid dependence on memory recall, which was considered not reliable enough for the level of details required for this study. [2] It is assumed that changes in Nigerian rice imports due to policy changes cannot impact significantly on world price of rice in spite of the volume of rice imports. Nigeria’s rice imports increased significantly between 1997 and 2001 while the world rice price decreased significantly. In 2003 and 2004 Nigeria’s rice imports declined while world price of rice increased [14]
REFERENCES
The following images related to this document are available:Photo images[nd11016t7.jpg] [nd11016t5.jpg] [nd11016t6.jpg] [nd11016t3.jpg] [nd11016t4.jpg] [nd11016t1.jpg] [nd11016t2.jpg] | ||||||||||||||||||||||||||||||||||||||||||||||||||||||||||||||||||||||||||||||||||||||||||||||||||||||||||||||||||||||||||||||||||||||||||||||||||||||
| |||||||||
