 |
| About Bioline | All Journals | Testimonials | Membership | News |
|
||||||
|
||||||
African Journal of Food, Agriculture, Nutrition and Development, Vol. 11, No. 2, 2011 pp. 4664 - 4672 Determination Of Carcinogenic Polycyclic Aromatic Hydrocarbons (Pahs), Anthracene In Different Variety Of Fish Samples In The Bangsai River Of Bangladesh Yeasmin F2, Rahman SMM2, Rana S1, Fatema KJ1, MA Hossain*1 1Chemistry Division,
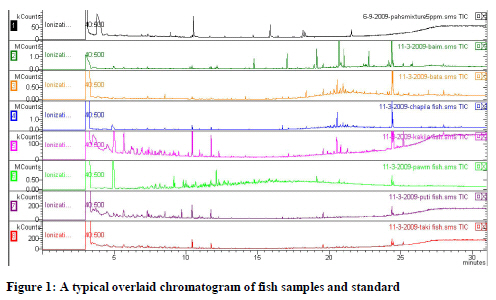
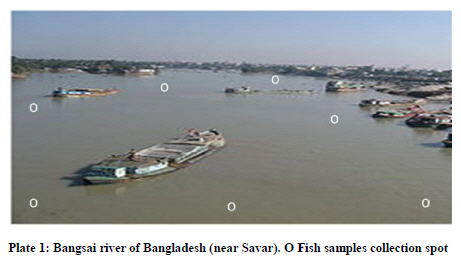
Atomic Energy Centre, GPO Box 164, Ramna, Dhaka-1000, Bangladesh *Corresponding author email. dramzadh@gmail.com Code Number: nd11018 ABSTRACT Carcinogenic polycyclic aromatic hydrocarbons (PAHs), widely scattered in the environment because of inadequate combustion of fuels, are an important class of toxicological compounds. In the past decade, PAHs have drawn considerable attention because of their possible contamination to the environment and foodstuffs. A crude extract of the fish samples collected from the most polluted part of Bangsai river at Saver industrial zone was analyzed for the presence of polycyclic aromatic hydrocarbon, anthracene, by gas chromatography-mass spectrometry (GC-MS). A suitable procedure for the extraction of PAHs from the fish sample was developed. A multi-layer clean-up (silica gel) column was used, followed by glass fiber filter (GFF) paper to eliminate the interfering organic compounds as well as lipids, fat and foreign particles. It was observed that PAHs deposition on the samples takes place in different morphological parts of the biological materials. Analysis was made for environmentally important PAHs and the results, the methods and some associated problems are discussed. Anthracene was found in almost all fish samples with the concentration in edible fishes collected from the Bangsai river being 0.761 to 3.294 µg/g. This concentration is within the range reported for other comparable regions of the world. Thus, it was suggested PAHs is oil contamination originating from the effluents of different industries such as tannery, dye, plastic, chemical, fertilizer or spillage’s and/or heavy ship traffic. However, the high concentration of carcinogenic anthracene encountered in these fishes should be considered serious as it is hazardous to human health. Based on fish consumption by Bangladeshi population, the daily intake of total carcinogens was 0.15 ng/person/day. Recovery studies with fortified samples indicated that the recovery efficiency for anthracene was 85.32%. It is concluded that three fish samples: baim, bata and taki were contaminated by the various aspects such as industrial effluents, air, highway vehicle exhaust and highway tar samples. Key words: Quantification, Anthracene, Fish, GC-MS, Bangladesh INTRODUCTION As a class of well known toxic compounds originating from incomplete combustion [1, 2, 3], polycyclic aromatic hydrocarbons (PAHs), normal hydrocarbons (NHs) are among the most important environmental contaminants in China [4] as well as all over the world. Located at the fastest growing coastal area of China, Bangladesh suffers particularly from severe contamination by PAHs and normal hydrocarbons (NHs) from various sources [5, 6]. Polycyclic aromatic hydrocarbons occur as contaminants in various food categories including vegetables and fish, which are reported to be important contributors to human intake of PAHs [7]. This is particularly true in China and Bangladesh given the fact that vegetables and fish are basic foods in China as well as in Bangladesh. It has been reported that plant, fish and other essential food uptake of PAHs and NHs is primarily from atmosphere through gas and particle-bound depositions and relative importance of these two mechanisms is driven by the gas/particle partitioning of the compound [8]. A framework for identifying the major uptake process of semi-volatile organic compounds based on octane-air partition coefficient (KOA) was developed and two separate tools for interpretation of plant uptake behavior for either gas or particle-bound chemicals were established [8,9]. However, knowledge gap still remains for quantitative relationship between plant accumulation and the level in the air. The aim of the present study was to determine the level of polycyclic aromatic hydrocarbon (PAH), anthracene, in a dichloromethane-hexane crude extract of the flesh of fish by GC-MS. MATERIAL AND METHODS Dichloromethane, hexane and other solvents used in this experiment were of high performance liquid chromatography grade. Anhydrous sodium sulphate (Merck, Germany) was cleaned by heating at 200oC before use. Silica gel (60-120 mesh, Merck, Germany), was activated at 400oC for 12 hr prior to use. Glass fiber filter paper (Merck, Germany) was used for removal of fats and lipids. Anthracene (Sigma-Aldrich) was used as standard in the present study. Fish samples Fish samples were collected from the Bangsai River, Savar, Dhaka, Bangladesh on October 4-16, 2009 and initially identified by morphological features and database present in the library at the herbarium of the Department of Biology, University of Dhaka, Dhaka, Bangladesh. Isolation and preparation of crude extracts Fish samples were at first washed with tap water followed by de-ionized water, flayed to collect flesh and then again washed with de-ionized water to remove blood, dusts and any other foreign particles. The collected flesh samples were ground. The paste samples (2 g) were extracted three times with dichloromethane-hexane (1:1) (40 ml x 3) at 80oC for 30 min. The extract was then filtered by glass fiber filter paper and the filtrate was evaporated to near dryness by Kuderna-Danish evaporator (Sigma-Aldrich). Clean-up procedureThe clean-up column (i.d. = 1 cm) was filled with cotton wool at the bottom. Activated silica gel (17 g) soaked in dichloromethane was loaded into the clean-up column (5 cm), which was then topped up with 1.5 cm of anhydrous sodium sulfate. Dichloromethane (5 ml) was added to wash the sodium sulfate and the silica gel. The dried sample (1 ml) was then transferred into the column; the vessel was rinsed twice with dichloromethane (2 ml), which was also added to the column. Acetone (60 ml) was added to the column and allowed to flow through the column at a rate of 3–5 ml/min, and the effluent was collected. The collected effluent from the clean-up procedure was re-concentrated to 0.5 ml with K-D concentrator. GC-MS Analysis and Program The GC-MS analysis of the crude extract of fish samples was performed using a Varian GC-MS (Model Varian CP 3800) equipped with a VF-5 fused silica capillary column (30m x 0.25 i.d., film thickness 0.25 mm). For GC-MS detection, an electron ionization system with ionization energy of 70 eV was used. Helium gas was used as a carrier gas at a constant flow rate of 1 ml/min. Injector and mass transfer line temperature were set at 250 and 280oC, respectively. The oven temperature was programmed to rise from 50 to 200oC at 8oC/min, and then held isothermal for 20 min. and finally raised to 300oC at 10oC/min. 0.2ml diluted samples (1/100, v/v, in methanol) were manually injected in the split less mode. Identification of compounds in the crude fish extract was based on GC retention time on VF-5 capillary column, computer matching of mass spectra with standards (Mainlab, Replib and Tutorial data of GC-MS systems) and, whenever possible, by co-injection with authentic compounds [9].The system suitability of the method was evaluated by the intra- and inter-day precision and accuracy of replicates. The accuracy was evaluated through recovery studies by adding known amounts of the standard solution to the extract. The recovery experiment was performed at three different standard concentrations. Preparation of standard Calibration graphs for the samples treated according to the described analytical procedure were made using the SIM mode. Different concentrations of anthracene (0.625 ng/ml, 1.25 ng/ml, 2.5 ng/ml and 5 ng/ml) were used for calibration curve. RESULTS Seven fish that were selected for this investigation were different in sizes and all the results were calculated based on weight. Concentrations of the marker in dichloromethane extracts of fish The GC-MS method applied was for the analysis of anthracene present in fish samples. In the present study, a programmed method was used for simultaneous assay of the authentic marker. The standard was determined in a single GC-MS run. The standards were resolved and eluted at 19.55, with respect to anthracene. The marker (0.625, 1.25, 2.50 and 5.00 ng on column for anthracene) showed a good linearity in the range from 0.625 to 5 ng in the calibration curves that were obtained by GC-MS analysis. The reference marker was present in the chromatographic profiles of the samples from various locations when the sample solution was analyzed by GC-MS (Figure 1). The peaks of anthracene were confirmed by comparing their retention times with reference standard. To assess the precision of these methods, standard solution of anthracene was determined six times on the same day and over a six-day period. The results showed good precision. The accuracy of the method was evaluated through recovery studies. The recovery experiments were performed at three concentrations (1, 2 and 5 ng) of the standard added to sample solutions, in which the marker content had been determined, using a sample from the most polluted part of Bangsairiver. The results for the recoveries of anthracene were in the range of 71–85.32 %. The limit of detection (LOD) of the GC-MS method, established at signals three times that of the noise for anthracene was 2.5 ng. Plate 1: Bangsai river of Bangladesh (near Savar). O Fish samples collection spot The quantitative determination of our aim target polycyclic aromatic hydrocarbon compound, anthracene was done by external calibration curve method. Linear responses were achieved for anthracene in the concentration range for fish samples. Over this concentration range, the linear regression analysis of peak areas (y) in function of concentration (x), calculated by least square method, leads to the following equations: y = +8439.5908x + 488.3140 (r2 = 0.983323) for anthracene. Anthracene was identified by comparing its retention time (RT) on the total ion chromatogram (TIC) of the substance in the fish samples with that of the respective compound in a standard solution analyzed under the same conditions. The existing GC-MS library database (NIST) shows the RT of anthracene from the fish samples. DISCUSSION For the experiment, seven different types of small and moderately large fish samples collected from Bangsai river at Savar of Bangladesh were chosen. The collected samples were processed during the winter season. Normally fish is contaminated by various pollutants such as industrial effluents, air, highway vehicle exhaust, and highway tar samples . The concentration of anthracene, a polycyclic aromatic hydrocarbon, in the seven different types of fish samples were measured by GC-MS and the results were calculated from the external curve method (Table 1). Anthracene is a three member fused ring compound and as such is found in the middle of the water. Among the seven different fishes, it is observed that taki fish receives the highest amount of anthracene as it normally stays and lives in the lower part of the water and the lowest concentration of anthracene in baim and it stays inside soil.reword this bolded part Three fish samples such as puti, kakila and prawn did not detect any anthracene. The others have anthracene in their body well above the detection limit with the exception of kakila Table 1: Concentration of anthracene in the seven different types of small and moderate size fish samples
*ND=Not detectable CONCLUSIONS From the experiment, it is concluded that three fish samples such as baim, bata and taki were contaminated by the various aspects such as industrial effluents, air, highway vehicle exhaust, and highway tar . Carcinogenic anthracene found in the three fish samples was above the detection limit with the highest concentration found in the flesh of taki fish. This could be explained by the fact that anthracene is deposited on the surface of the soil where the taki fish normally stays and lives. This leads to bioaccumulation of the PAH. From the findings, it is suggested that awareness should be created among the public on the dangers of consuming fish taken from Bangsai river. ACKNOWLEDGEMENT We are grateful to M. Ali, Chief Scientific Officer and Head, Chemistry Division, Atomic Energy Centre, Ramna, Dhaka for his continuous encouragement during the work and allowing use of all laboratory facilities. We also thank to Mr. Zahidul Islam and Mr. Ayub Ali for their help to prepare the fish samples. REFERENCES
Copyright 2011 - African Journal of Food Agriculture, Nutrition and Development The following images related to this document are available:Photo images[nd11018t1.jpg] [nd11018f1.jpg] [nd11018p1.jpg] |
| |||||||||
