 |
| About Bioline | All Journals | Testimonials | Membership | News |
|
||||||
|
||||||
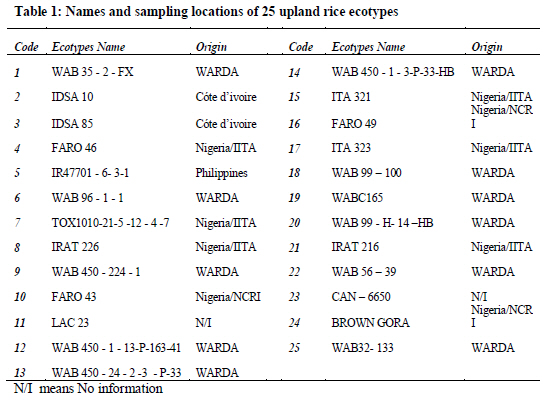
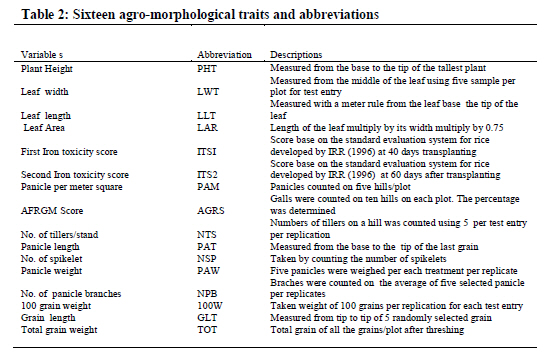
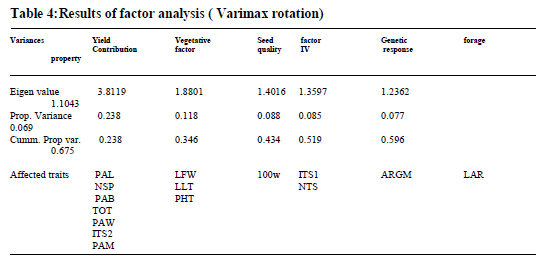
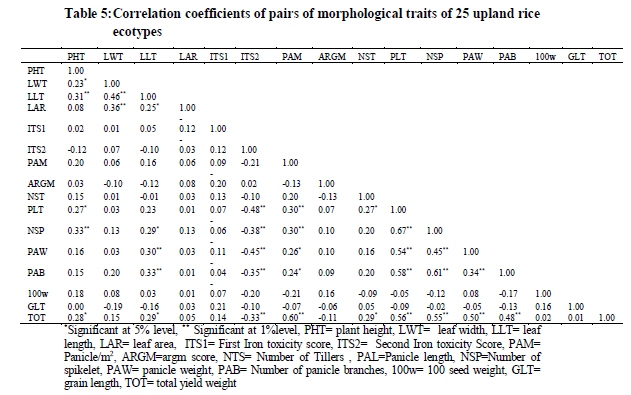
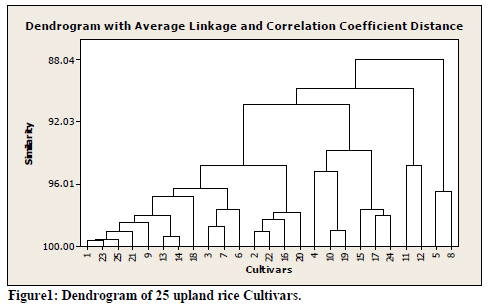
African Journal of Food, Agriculture, Nutrition and Development, Vol. 11, No. 2, 2011 pp. 4673 - 4687 Biometrical Character Interrelationship And Morphological Variations In Some Upland Rice (Oryza Sativa L.) Varieties Adeyemi RA*1, Gana AS1 and ST Yusuf1 1Department of Crop Production, School of Agricultural and Agricultural Technology, Federal University of Technology, P.M.B. 65 Minna –Nigeria. *Corresponding author email: adeyemira@yahoo.ca Code Number: nd11019 ABSTRACT This paper aims to evaluate and classify some upland rice varieties based on their morphological characteristics. The data used in the study was obtained from National Cereal Research Institute (NCRI), Badeggi -Nigeria. The study consists of 25 upland rice cultivars, which were extracted from 100 rice varieties ergo-listed in the institute. The experiment was conducted at Edozhigi in north- central Nigeria. The experiment was laid out in a randomized complete block design with three replications and sixteen agro-morphological characters measured on each of the experimental plots. Preliminary analysis of variance showed that the cultivars were significantly different (p< 0.05) in their plant height and leaf length and highly significant (p<0.01) for first and second iron toxicity score, panicle/m2, panicle length, panicle weight, number of panicle branches, 100-seed grain weight, and total grain weight. However, leaf width, leaf area, African rice gall midge (AFRGM) score, numbers of tillers and grain length were not significant. Factor analysis revealed that yield contribution factor was the most important characteristics, and its components include panicle length, number of spikelets, number of panicle branches, total grain weight, panicle weight, second iron toxicity score and panicle per meter square. The factor analysis characterized the traits into six factors, which accounted for 68 percent of the total variation. The cluster analysis classified the 25 upland rice cultivars into four groups based on characters measured. Cluster I consisted of 15 varieties and the traits whose average (within this class) were found to be higher than mean of all cultivars are considered superior to that overall cultivars for such character selection. These are leaf area, second iron toxicity score, African Rice Gall Midge (AFRGM) score and 100-seed grain weight. Therefore, this class could be used to grain quality selection. The second cluster consisted of 6 varieties, which had their averages higher than all cultivars for traits such as plant height, leaf length, and first iron toxicity score, panicle per square meter, number of tillers/stand, panicle length, number of spikelets, panicle weight, numbers of panicle branches, 100 seed grain weight and total grain weight. This class could be suitable for improving the yield components. Cluster III comprises of cluster II characters in addition to forage properties. Specific attribute of the each class could be used by breeders for rice improvement programs. Key words: Upland rice, Dimensional Reduction models INTRODUCTION In Northern Nigeria, upland rice (Oryza Sativa L.) is an annual crop that is typically cultivated on dry land. Rice is the sixth major crop cultivated in Nigeria after sorghum, millet, cowpea, cassava and yam [1]. It is grown in four major rice growing environments: upland, rain-fed lowland, irrigated lowland and deep water. Rainfed upland is the major rice growing ecology in West Africa, accounting for nearly 60% of the total regional rice area [2]. It is not only consumed by human and fed to livestock, but is also a major raw material to agro-allied industries as it can be processed into acetic acid, glucose and starch while its husks can serve as a fuel and ash use as fertilizers [3]. The morphological method is the oldest and is considered as the first step in the description and classification of germplasm [4]. It had been reported that although agro-morphological characters are often influenced by environmental conditions, the method is still useful and easy to apply for classification, estimating diversity and registration of cultivars. Also, it was reported that morphological data showing continuous distributions or that are polygenically controlled, are particularly useful in inter-group classification below species level [5, 6, 7]. Many researchers had successfully used agro-morphological characters to classify and estimate diversity in a variety of crop species [8- 15]. Likewise, 67 hot pepper accessions had been classified into six clusters using 35 morphological and physiological characters [16]. These results revealed the importance of identification of important agro-morphological traits for diversity analysis in different crop species. The objective of this study was to characterize and classify 25 upland rice varieties. It also intended to identify morphological traits responsible for selection of important characters and study the interrelationship among the traits. MATERIALS AND METHODS Experimental materials and data collection This study utilized twenty five upland rice cultivars (Table 1) extracted from 100 ergo-listed in National Cereal Research Institute (NCRI), Badeggi, Niger State, Nigeria. The trial experiment was conducted at Edozhigi, situated on Latitude 90 05/N and Longitude 50 50/E in 2004/2005 cropping season. The experiment was laid out in a randomized complete block design with three replicates. Seeds were planted in 2 rows of 5m in each replication. Nitrogen Phosphorus Potassium (N2P2O2K2) fertilizers were applied at the rate of 80: 40: 40kg/ha. Hoe and hand pulling of weeds were done three times during the crop growth cycle. Sixteen agro- morphological characters were taken in each experimental plot (Table 2). The morphological traits considered in this study are plant height, leaf width, leaf length, leaf area, first and second iron toxicity score, panicle per meter square, African rice gall midge (AFRGM) score, number of tillers/stand, panicle length, panicle weight, number of spikelet, number of panicle branches, 100 grain weight, grain length and total grain weight. Data was subjected to statistical analysis of variance and multivariate statistical models (factor and cluster analysis), which are useful tools for dimensional reduction of variables and ease of interpretation [17]. Statistical Methods Descriptive statistics and analysis of variance (ANOVA) for all the traits were conducted to estimate diversity of the traits. Simple Pearson moment correlation coefficients were computed between pairs of morphological traits. Factor analysis was also performed on mean of traits according to varimax rotation method [18] using the correlation matrix to reduce the dimensionality of the data on the 16 agro-morphological traits. Cluster analysis was also performed and its dendrogram constructed to study the genetic relationship of the varieties using their agro-morphological traits. For identifying superior traits in each class, the mean and standard error for class were computed based on group membership. All data was analyzed using Commercial packages Minitab Inc. [19] version 14 and SAS Inc. [20] version 8.1. RESULTS The Morphological traits Descriptive statistical estimates and ANOVA test for the morphological traits are presented in Table 3. The ANOVA results indicated that the cultivars were significantly different in some traits like plant height (F=2.085, P<0.05), leaf length (F=2.085, P<0.05), first and second iron toxicity scores(F=3.011, P<0.01) and (F=2.774, P<0.01) respectively, number of panicle /m2 (F=2.362, P<0.01), phenotype (F=3.051, P<0.01), panicle length (F=7.364, P<0.01), number of spikelets (F=8.692, P<0.01), panicle branches (F=8.443, P<0.01), panicle weight (F=5.562, P<0.01), 100 seed weight (F = 5.586, P<0.01), and total grain weight (F = 5.157, P<0.01). ANOVA results did not show significant different for leaf width (F = 1.185, P>0.05), leaf area (F = 0.838, P>0.05), AFRGM scores (F=0.738, P>0.05), number of tillers per stand (F=1.032, P>0.05) and grain length (F = 0.916, P>0.05). The minimum and maximum values are also presented in the Table 3, which indicated the two extreme values of all possible values for each trait. Standard deviation measured the variability within each variable and mean value is the average over all varieties. Relative diversity of the traits: factor analysis To determine the relative diversity of the traits among the tested ecotypes, factor analysis based on varimax rotation method was carried out on morphological traits and resulted into 6 common factors, which accounted for about 68% of the total variation (Table 4). Prior to the factor analysis, the variables were first standardized to the remove the effect of different measuring scales. Factor 1(yield contribution factors) accounted for 23.8% of the total variation. This included panicle length, number of spikelets, and number of panicle branches, total grain weight, panicle weight, second iron toxicity score and panicle per meter square. Factor 2(vegetative factor) accounted for 11.8% of the total variation, which included components such as leaf width, leaf length and plant height. Factor 3(seed quality) included 100-seed grain weight accounted for 8.8 % of the proportion variance. Factor 4 included number of tillers per stand and first iron toxicity score and accounted for 8.5% of the total variation. Factor 5 (genetic property) included AFRGM score and accounted for 7.7% of the total variation. Factor 6 included leaf area which accounted for 6.9% of the total variation. Correlation between traits In determining the interrelationship between pairs of traits, Pearson product moment correlation was performed and the results showed significant correlations between some paired traits (Table 5). Plant height was positively and significantly correlated with leaf width (r = 0.23, P<0.05), leaf length(r = 0.31, P<0.05), panicle length (r = 0.27, P<0.05) and total grain weight(r = 0.28, P<0.05) and number of spikelets (r = 0.33, p<0.01). Leaf width was only positively and significantly correlated with leaf length (r = 0.46, p<0.01) and leaf area (r = 0.36,p<0.01) while leaf length was positively and significantly correlated with leaf area(r = 0.25, P<0.05), number of spikelets(r = 0.29, P < 0.05), panicle weight(r = 0.30, p< 0.01), number of panicle branches (r = 0.33, p<0.01) and total grain weight (r = 0.29, p < 0.05). It is worth mentioning that African Rice gall midge (AFRGM) score and first iron toxicity score (scored at 40 days after transplanting) were not significantly correlated with any other parameter, but, second iron toxicity score (scored at 60 days after transplanting) was negatively and significantly correlated with yield components such as panicle length(r = -0.48, p<0.01), number of spikelets (r = -0.38, p<0.01), panicle weight(r = -0.45, p<0.01), number of panicle branches(r = -0.35, p<0.01) and total grain yield weight (r = -0.33, p<0.01). Furthermore, number of tillers/stands was significantly and positively correlated with panicle length(r = 0.27, p<0.05) and total grain yield weight (r = 0.29, p<0.05). Panicle length was positively and significantly correlated with number of spikelet(r = 0.67, p<0.01), panicle weight (r = 0.54, p<0.01), number of panicle branches (r = 0.58, p<0.01) and total grain weight (r = 0.56, p<0.01), while number of spikelets was positively and significantly correlated with panicle weight (r = 0.45, p<0.01), number of panicle branches (r = 0.61, p<0.01) and total grain weight(r = 0.55, p<0.01). Panicle weight was positively and significantly correlated with number of panicle branches (r= 0.34, p<0.01) and total grain yield weight (r = 0.50, p<0.01). Number of panicle branches was significantly correlated with total grain weight (r = 0.48, p<0.01) and 100-seed weight was not significantly correlated with any morphological trait. Cultivars classification Cluster analysis was performed on the rice varieties to evaluate the genetic distance between the 25 different ecotypes based on the 16 agro-morphological traits. All the 25 rice cultivars were classified into four clusters and the corresponding dendrogram was presented (Figure 1). Referring to Table 1, Cluster I consisted of 15 cultivars: 1 2 3 6 7 9 13 14 16 18 20 21 22 23 and 25. Cluster II comprises of 6 cultivars: 4, 10, 15, 17 , 19 and 24. Cluster III consisted of 2 cultivars: 5 and 8 and Cluster IV consisted of ecotypes 11 and 12. The mean and standard error of the each cluster were computed from their group membership (cultivars made up of each cluster in Table 6). The findings indicated that the cultivars in each group possess more similar genetic relationship than cultivars in different groups. Therefore, cultivars in each group could commonly be used for hybridization programs with regard to the mean value of their desirable characters. The average values of cultivars made up of the first cluster (based 15 cultivars) had their mean values greater than overall cultivars include such traits as leaf area, second iron toxicity score, AFRGM score and 100-seed weight. In this class, the mean for 100- seed grain weight was much more than the overall mean. In the second class (consisted of 6 cultivars), their average value greater than overall cultivars for such traits like plant height, leaf length, first iron toxicity score, panicle per square meter, number of tillers/stand, panicle length, number of spikelets, panicle weight, number of panicle branches, 100- seed weight and total grain weight. The characteristics of this class could be suitable for improving the yield components. In the third class, there were only 2 cultivars (5 and 8, which are Philippines and International Institute of Tropical Agriculture (IITA-Nigeria) developed respectively). Important characters of this class were based on those traits whose mean values are found to be greater than overall cultivars, and they included traits in cluster II and leaf width and leaf length. DISCUSSIONS In the present study, 25 upland rice cultivars were analyzed and classified using 16 agro-morphological characters; it was found that these cultivars can be characterized into four groups, which was in line with previous works [10-15]. Cluster analysis indicated that the cultivars in each group possessed similar genetic relationship as opposed to cultivars in different groups. Therefore, cultivars in each group could commonly be used for hybridization programs with regards to the mean value of the desirable characters. A similar study conducted by Assefa et al. [8] using 320 teff lines classified these lines into 14 groups using 20 morphological, agronomical and phenological characters. Upadhyaya et al. [21] reported days to 50% flowering, plant width, apical secondary branches, tertiary branches, dots on seed testa, 100 seed weight, flowering duration, basal secondary branches, seed colour and seed testa texture as important traits in explaining multivariate polymorphism in a chickpea core collection. These results revealed the importance of identification of important agro-morphological traits for diversity analysis in different crop species. The findings from correlation analysis indicated that the total yield weight was positively and significantly correlated with panicle length, number of panicles branches, and number of spikelets, panicle weight, and panicle/m2. These traits are a good indicator for yield improvement selection. However, second iron toxicity score was negatively and significantly correlated with total yield weight; this could be an indication of negative effect of soil stress on the yield. There are similar works by other researchers [21, 22] that traits, which had high positive correlations on yield should be emphasized for selecting yield. Factor analysis characterized the 16 morphological characters into six common factors. The factors observed are yield components, vegetable factors, seed characteristics and forage factors. The most important factor was yield contribution components, which accounted for 23.8 % of the total variation. The versatility of the methodology employed in this study had been used on various crop varieties by previous researchers [14-16]. Zewdie and Zeven [16] reported that fruit weight, 1000 seed weight and fruit number per plant were the most important characters among the 35 morphological and physiological characters in clustering 67 hot pepper accessions. It was also reported that days to 50% flowering, plant width, apical secondary branches, tertiary branches, dots on seed testa, 100 seed weight, flowering duration, basal secondary branches, seed colour and seed testa texture as important traits in explaining multivariate polymorphism in a chickpea core collection [20]. Similarly, the diversity of 50 grass pea genotypes were also evaluated using morphological traits [13]. These results revealed the importance of identification of important agro-morphological traits for diversity analysis in different crop species. CONCLUSION This study revealed systematic diversity within this population of upland rice varieties. It is hoped that the information generated will provide a basis for selecting cultivars to be used for hybridization programs. Varieties in similar genetic groups did not generate much variability. Distant cultivars in cluster analysis could better provide a means for broad genetic base for yield improvement and other attributes of rice. Grain yield components could also be used for selecting those cultivars for any meaningful cultivar improvement as they contributed more to the total variability. The relationship in the correlation studies will allow breeders to select characters that have direct association with one another and therefore improve breeding activities in this crop ACKNOWLEDGEMENT We greatly acknowledge the cooperation of Editor – in – Chief and comments of the reviewers in improving the quality of this article. We are also highly indebted to the references cited below. REFERENCES
Copyright 2011 - African Journal of Food Agriculture, Nutrition and Development The following images related to this document are available:Photo images[nd11019t3.jpg] [nd11019t2.jpg] [nd11019t6.jpg] [nd11019t5.jpg] [nd11019t4.jpg] [nd11019f1.jpg] [nd11019t1.jpg] |
| |||||||||
