 |
| About Bioline | All Journals | Testimonials | Membership | News |
|
||||||
|
||||||
African Journal of Food, Agriculture, Nutrition and Development, Vol. 11, No. 3, 2011 pp. 4758-4771 Genetic Variability And Heritability Of Grain Yield Components And Grain Mineral Concentration In India’s Pearl Millet (Pennisetum Glaucum (L) R. Br.) Accessions † Govindaraj M1*, Selvi B2,Rajarathinam S1 and P Sumathi1 1Centre for
Plant Breeding and Genetics, Tamil Nadu Agricultural University,
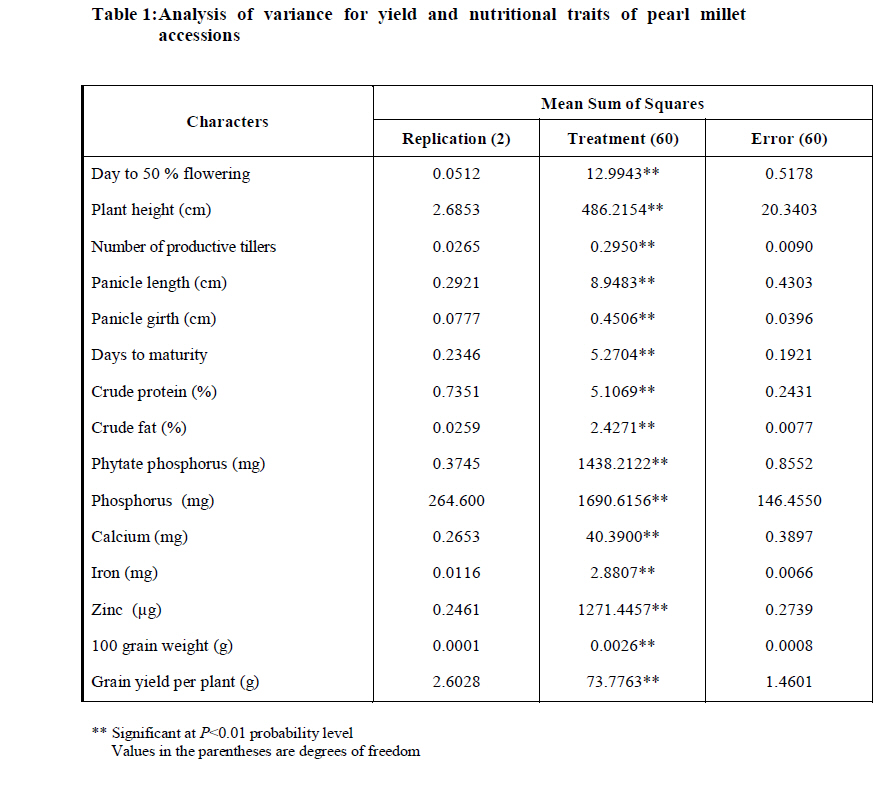
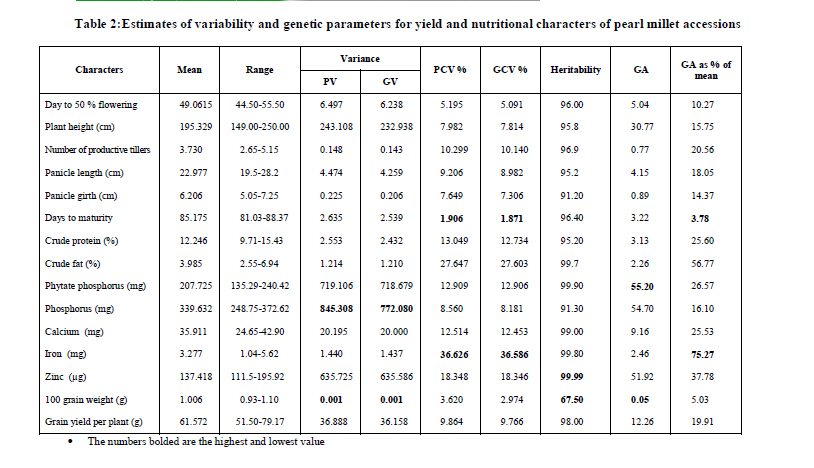
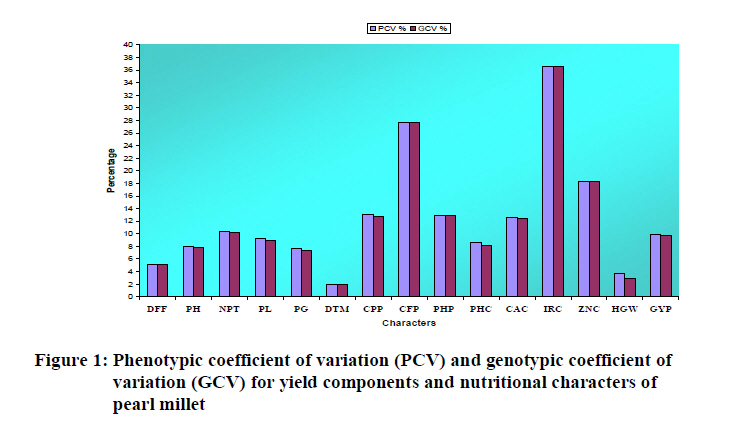
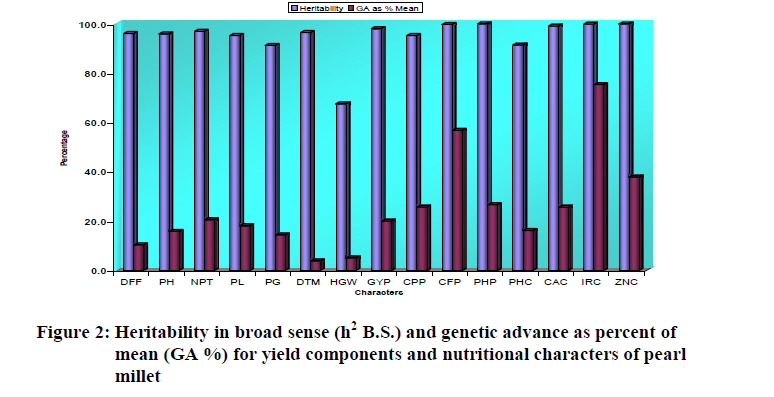
Coimbatore 641 003, Tamil Nadu, INDIA * Corresponding author Email: m.govindaraj@cgiar.org Code Number: nd11027 ABSTRACT Pearl millet (Pennisetum glaucum (L.) R. Br.) is an important cereal in semi-arid tropics in Africa and India. Conventionally, millet has good amounts of grain minerals compared to other cereals. Estimation of genetic parameters would be useful in developing appropriate breeding and selection strategies. The present study was conducted to evaluate the local pearl millet accessions to assess the magnitude of variability and to understand the heritable component of variation present in the yield and nutritional characters. A field trial was laid under the complete randomized block design (RCBD) with three replications; observation were recorded on eight morphological and seven nutritional characters (as detailed in material and methods) including anti-nutritional properties such as phytate content among 61 genotypes collected from millet collection. The phenotypic co-efficient of variation (PCV) was greater than genotypic co-efficient of variation (GCV) for all the characters studied; this shows the influence of environmental factors on the characters. The phosphorus content had expressed the highest phenotypic and genotypic variances (845.30 and 772.08, respectively). The magnitudes of phenotypic and genotypic variances were low for the 100 grain weight (0.001 for both phenotypic and genotypic variance). High estimates of genetic co-efficient of variation, heritability and genetic advance were exhibited by iron and crude fat content. Heritability is a measure of possible genetic advancement under selection. High heritability was observed for all the traits under study except seed weight which had moderate heritability. High value of heritability coupled with high genetic advance as per cent of mean were recorded for number of productive tillers, crude protein, crude fat, phytate, phosphorus, calcium, iron and zinc content, indicating the important role of additive gene action for the expression of these characters. Therefore, selection based on these characters could bring about desired improvement in yield as well as nutritional quality of pearl millet cultivars. Key words: Genetic-advance, Heritability, Variability, Micronutrients, Malnutrition Abbreviations used for the characters studied: CAC : Calcium content INTRODUCTION Biofortification, a new approach that relies on conventional plant breeding and modern biotechnology to increase the micronutrient density of staple crops holds great promise for improving the nutritional status and health of poor populations in both rural and urban areas of the developing world [1]. A well planned plant breeding program for developing high mineral dense genotypes requires complete knowledge on genetic variation and heritability of characters of economic importance available in the population. The availability of genetic variation for micronutrient density is essential for determining the feasibility of achieving meaningful increments through conventional breeding [2-4]. The desired variability can be successfully utilized by various breeding methods. Heritability in narrow and broad sense is important for the plant breeder since the effectiveness of selection depends on the additive portion of genetic variance in relation to total variance [5-6]. When there is sufficient genetic variation, breeders can exploit additive gene effects, transgressive segregation, and heterosis to improve micronutrient density. Hence, knowledge about variability using parameters like genetic co-efficient of variation, heritability and genetic advance is of paramount importance for initiating an efficient breeding program in crops like pearl millet. Pearl millet is the quick growing summer cereal, mainly cultivated in semi arid regions and forms the stable food in Indian subcontinent and in Africa. It is the fourth important stable food in India after rice, wheat and sorghum, and nutritionally superior to sorghum and maize. Pearl millet is a rich source of protein, calcium, phosphorus and iron [7-8]. In spite of having superior nutritional quality, the people of developing countries who consume this cereal are subjected to severe malnutrition owing to some of its inherent defects. For instance, pearl millet contains some anti-nutritional factors such as polyphenols, goittrogen and phytic acid. These factors reduce bioavailability of nutrients present in crop produce or induce other toxic effects [9-10]. Thus, decreasing anti-nutritional factors are advantageous in pearl millet while improving other nutritional traits in future or their level should be monitored to keep them at optimum levels. The main emphasis so far in pearl millet improvement was on grain yield and pest / diseases resistance, yet the effort to improve quality traits will definitely enhance the value of this crop in terms of consumer preference and industrial uses. The poultry industry has been using maize for the production of feed with high nutritive value; however great demand to find alternatives and thus millet can used as better alternative because of its high fat content and other nutritive value. In developing countries, this cereal is not preferred due to its unacceptable colour and flavour. At this juncture, the nutritional quality improvement of this crop suitable for food and industrial use should be concentrated in future breeding programs. A wide range of genetic variability was reported for both grain Fe (30.1–75.7 mg kg-1) and Zn (24.5–64.8 mg kg-1) content in breeding lines, improved populations and germplasm accessions and approximately similar variation (42.0–79.9 mg kg-1 Fe and 24.2–51.7 mg kg-1 Zn) in improved populations originated from India and Africa with medium to high broad sense heritability [11]. With these backgrounds, the present study aimed to assess the magnitude of genetic variability and genetic parameters for nutritional traits in the elite breeding lines and populations and breeding prospects for improved grain quality with good agronomic background of cultivars. MATERIALS AND METHODS The experiment was conducted with a set of 61 accessions during the kharif 2005 at the Millet Breeding Station, Tamil Nadu Agricultural University (TNAU), Coimbatore. The trial was conducted in complete randomized block design (CRBD) with three replications under the prevailing environmental conditions at Millet Breeding Station, TNAU. Coimbatore, lies between 11° North latitude and 77° East longitude. All the test entries were hand planted. Each genotype was represented by 4 rows of 5 m length with 45 cm between rows and 15 cm between plants. Thinning was performed after 15 days of germination when the plant height was 10-15 cm, to ensure single plant per hill. From sowing to till the harvesting, all the recommended cultural practices and inputs including fertilizer, hoeing, irrigation and pest control were applied. Five plants were randomly selected from centre 2 rows by rejecting a row at either side due to border rows effects. The observations were recorded on days to 50% flowering, plant height, number of productive tillers, panicle length, panicle girth, days to maturity, 100 grain weight, grain yield per plant. After thrashing, cleaning and weighing have performed, grains from each entry were dried in hot air oven at 600 C for 6 hours. The grains were then ground in Willey mill separately, and the powder was stored in properly labeled butter paper cover for further analysis. The observation was recorded for nutritional traits viz., protein content (N x 6.25) using microkjeldahl method [12]. Crude fat content was estimated by Soxhlet apparatus using petroleum ether extractant [13]. Estimation of phytic acid was done based on the method of Wheeler and Ferrel [14]. Calcium was estimated following veresenate nitration method [15]. Phosphorus was determined as per vanadomolybdo phosphoric yellow colour method of Piper [16]. The zinc and iron contents were determined by using Atomic absorption spectrophotometer [15]. Crude protein and crude fat content were estimated at the Department of Forage crops, Centre for Plant Breeding and Genetics, phytic acid, calcium and phosphorus were analyzed at the Department of Soil Science and Agricultural Chemistry, and iron and zinc at the Department of Environmental Sciences, TNAU, Coimbatore. Phenotypic and genotypic co-efficient of variation, heritability and genetic advance as per cent of mean were estimated as suggested by Assefa et al. [17].The estimates of PCV and GCV were classified as low, medium and high [18]. All the statistical analysis were one by using GenStat (12th edition) statistical software [19]. RESULTS Analysis of variance for the fifteen characters studied are presented in Table 1 and revealed highly significant differences (P<0.01) between the genotypes for all the characters studied. Hence, further analyses were carried out from the mean square Table 1. Co-efficient of variation To understand the extent to which the observed variation was due to genetic factors, the value of genotypic and phenotypic variance, phenotypic and genotypic coefficients of variability, heritability (broad sense) and genetic advance for different characters were estimated. The phosphorus content had expressed the highest phenotypic and genotypic variances with the values of 845.30 and 772.08, respectively. The magnitudes of phenotypic and genotypic variances were low for the 100 grain weight (0.001 for both phenotypic variance and genotypic variance). Phenotypic and Genotypic Coefficient of Variation As per the classification, the values were grouped into high, medium and low [18]. The values on PCV and GCV are furnished in Table 2 and in Figure 1. The phenotypic coefficient of variation was maximum for iron content (36.62) followed by crude fat content (27.64). Moderate phenotypic coefficient of variation values (11 to 20 per cent) were obtained for the characters zinc content (18.34), crude protein content (13.04), phytate phosphorus (12.90), calcium content (12.51) and number of tillers (10.29). Low phenotypic coefficient of variation values (< 10 per cent) were exhibited by grain yield per plant (9.86), panicle length (9.20), phosphorus content (8.56), plant height (7.98), panicle girth (7.64), days to fifty per cent flowering (5.19), hundred grain weight (3.62) and days to maturity (1.90). Genotypic coefficient of variation was highest for iron content (36.58), crude fat content (27.60). Moderate genotypic coefficient of variation values were observed for the characters zinc content (18.34), followed by phytate phosphorus (12.90), crude protein content (12.73), calcium content (12.45) and number of productive tillers (10.14). Low genotypic coefficient of variation values were recorded for the characters grain yield per plant (9.76), panicle length (8.98), phosphorus content (8.18), plant height (7.81) and panicle girth (7.30). The lowest GCV estimate was observed for the traits days to fifty per cent flowering (5.09), hundred grain weight (2.97) and days to maturity (1.87). Heritability and Genetic Advance Estimates of heritability (broad sense), genetic advance and genetic advance as percentage of mean are furnished in Table 2. The heritability (broad sense) and genetic advance as percentage of mean are presented graphically in Figure 2. The genotypes under study showed high heritability values for all the characters. The maximum heritability was expressed by the trait zinc content (99.90) and phytate phosphorus (99.90) followed by iron content (99.80), crude fat (99.70), phosphorus content (91.30), calcium content (99.00), grain yield per plant (98.00), number of productive tillers (96.90), days to maturity (96.40), days to 50per cent flowering (96.00), plant height (95.80), panicle length and crude protein content (95.20) and panicle girth (91.20). Among all the traits the lowest heritability value was recorded by 100 grain weight (67.50). The high GA as per cent of mean (> 20 per cent) were recorded for iron content (75.27), crude fat content (56.77), zinc content (37.78), phytate phosphorus (26.57), crude protein content (25.60), calcium content (25.53) and number of productive tillers (20.56). The characters that had recorded moderate (10 to 20 per cent) level of genetic advance as per cent of mean were grain yield per plant (19.91), panicle length (18.05), phosphorus content (16.10), plant height (15.75), panicle girth (14.37) and days to 50 per cent flowering (10.27). The low level of GA as per cent of mean (< 10 per cent) were recorded for the characters such as days to maturity (3.78) and 100 grain weight (5.03). High heritability with high genetic advance was observed for iron content (99.80 per cent and 75.27 per cent, respectively) followed by crude fat (99.7 per cent and 56.77 per cent, respectively). High heritability with low genetic advance was recorded on days to maturity (96.40 per cent and 3.78 per cent) and days to 50% flowering (96.00 per cent and 10.27 per cent). DISCUSSION Analysis of variation showed mean square due to genotypes was highly significant, indicating that considerable amount of genetic variation was existed among the accessions (Table 1). This wide range of variation observed for all the characters would offer scope of selection for development of desirable genotypes. These significant differences could also be attributed to the composition of the population, which is made up of diverse genotypes in the past. High phenotypic variability, which encompasses genotypic, environmental and G x E interaction components, was evident from the range of values for different characters. In general, estimates of phenotypic coefficient of variability (PCV) were higher than those due to genotypic coefficient of variability for all characters (Table 1). Similar results were also reported earlier [20-21]. However, in this study, estimates of phenotypic variance were moderately higher than the genotype variance for all the characters except for 100 grain weight for which phenotypic variance is equal to genotypic variance. The close resemblance between the corresponding estimates of PCV and GCV in almost all the characters except protein content indicated least role of environmental influences for expression of these characters (Table 2.). Similar results were recently reported in pearl millet [22-23].High GCV and PCV estimates were recorded for iron content (36.58% and 36.62%, respectively) followed by days to maturity, crude fat and phytate phosphorus. Similar trend of high PCV and GCV values were reported in earlier studies by Kunjir and Patil [24], Lakshmana et a., [25] and Borkhataria et al. [26]. The low GCV estimates were observed for days to maturity and 100 grain weight. These results of above characters are in confirmation with the earlier findings of Deb Choudhury and Das, [27], Saraswathi et al. [28]. The coefficient of variation indicates only the extent of total variability present for a character and does not demarcate the variability into heritable and non-heritable portion. Hence, the estimate of heritability, which indicates precisely the heritable expected gain, assumes importance. The extent of variability, which could be transferred from parent to off-spring, would suggest how for the variation in heritable portion has close bearing on response to selection [29-30]. Genetic coefficient of variability along with heritability gave an idea of expected genetic gain from selection [31]. The character which exhibited high heritability and genetic advance as per cent of mean indicated the broad sense of additive gene action in its inheritance and such characters could be improved by simple selection methods [32]. The high heritability in broad sense recorded for all the characters studied, indicating that genotype plays a most important role than the environment in determining the phenotype suggesting predominance of additive gene effects in the inheritance of the traits. Concomitant results were also reported by Ghorpade et al. [33] and Lakshmana and Guggari [34]. The advance in the mean value of population as a result of selection depends on heritability of the characters, phenotypic variation and selection pressure. Even if the heritability is 100-per cent, there would be little genetic advancement when there is little genotypic variation. The information on heritability alone may not help in pin-pointing characters for enforcing selection. Nevertheless, the heritability estimates in conjunction with predicted genetic advance will be more reliable [35]. Heritability gives the information on the magnitude of inheritance of traits, while genetic advance helpful in formulating suitable selection procedures. Number of productive tillers, crude protein, phytate phosphorus, crude fat, calcium, iron and zinc content had high heritability coupled with high genetic advance as per cent of mean. The high heritability with high genetic advance as per cent of mean observed for these characters might be due to additive gene effects. Hence, selection in the segregating generation would be fairly effective for them. Similar results were obtained by several studies in pearl millet [28, 36-38]. In general, the traits which expressed with high heritability and low genetic advance were controlled by non additive gene action. In the present study, days to maturity was showed high heritably with low genetic advance estimates indicate that governed by non additive genes hence heterosis breeding would be recommended for this trait improvement and this research finding was concomitant with Sumathi et al, [39]. CONCLUSIONS This study revealed that iron and crude fat had high estimates of GCV and PCV. The traits such as zinc, crude protein, calcium, phytate phosphorus and number of productive tillers had moderately high GCV and PCV. These observations indicated that the variability could be exploited for successful isolation of desirable genotypes for the characters concerned. Heritability estimates in general were high for all the characters studied. High heritability coupled with high genetic advance as percentage of mean was observed for plant height, number of productive tillers, crude protein, crude fat, phosphorus, phytate phosphorus, calcium, iron and zinc content. Hence, these characters need to be given more importance while selecting the breeding lines as they are controlled by additive genes. Therefore, selection based on the characters, both yield attributes (number of productive tillers) as well as nutritional quality traits such as protein, fat, phytate phosphorus, calcium, iron and zinc content having high heritability coupled with high genetic advance as per cent of mean may bring about the desired improvement in yield as well as nutritional quality of pearl millet genotypes. The present study has shown primary evidence that biofortification can be a key objective for plant breeders in addition to the traditional objectives of disease resistance, yield and drought tolerance. Scientific evidence shows that biofortification is technically feasible. The average grain iron content in pearl millet was 47 mg / kg and the daily recommended allowance 12-15 mg per day for an adult [40] and this shows the prospects for fortification of pearl millet with elevated iron content to reduce the iron deficiency in West African regions and India (Rajasthan and Gujarat regions) where pearl millet grown as food purpose. REFERENCES
Copyright 2011 - African Journal of Food Agriculture, Nutrition and Development The following images related to this document are available:Photo images[nd11027t1.jpg] [nd11027f2.jpg] [nd11027f1.jpg] [nd11027t2.jpg] |
| |||||||||
