 |
| About Bioline | All Journals | Testimonials | Membership | News |
|
||||||
|
||||||
African Journal of Food, Agriculture, Nutrition and Development, Vol. 11, No. 3, 2011 pp. 4785-4799 Microbiological, Physicochemical And Sensory Evaluation Of “Ori-Ese” Produced From Fortified Sorghum Adebayo-Tayo BC1* and GE Needum2 1Department
of Botany and Microbiology, University of Ibadan. Ibadan, Oyo State,
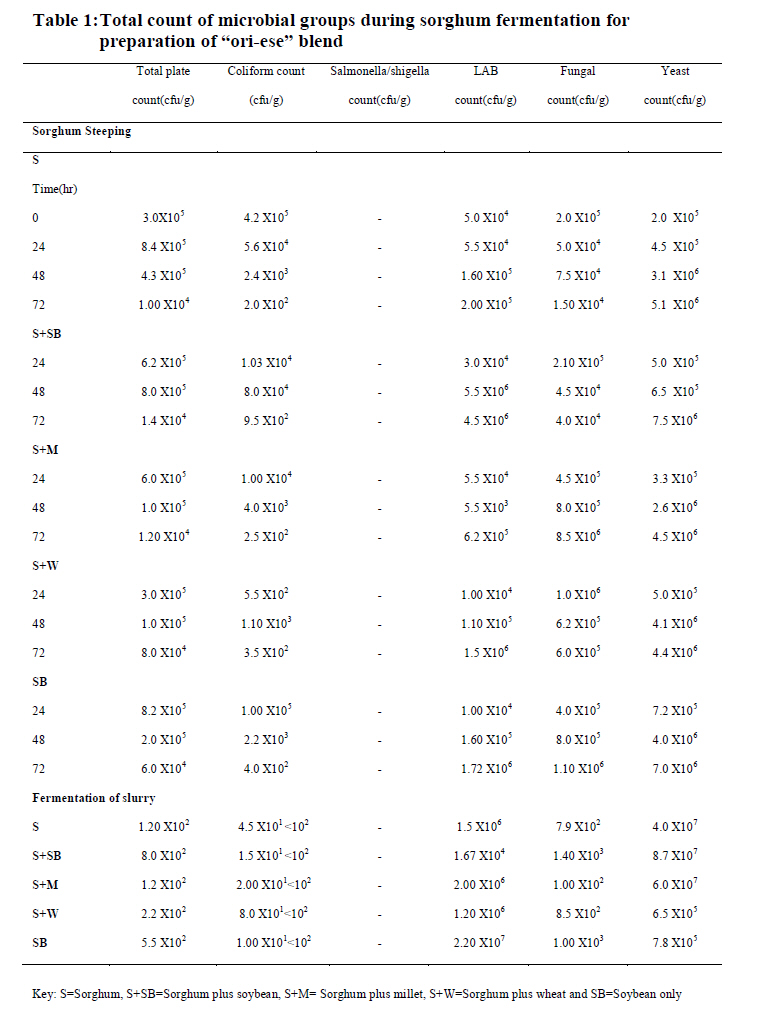
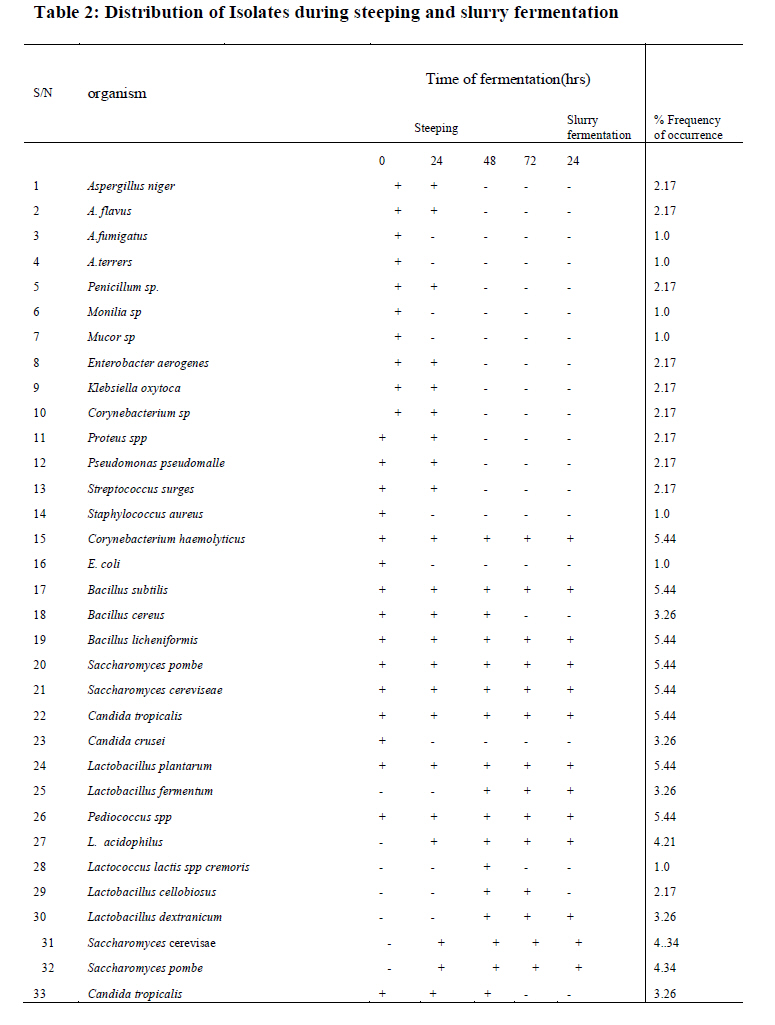
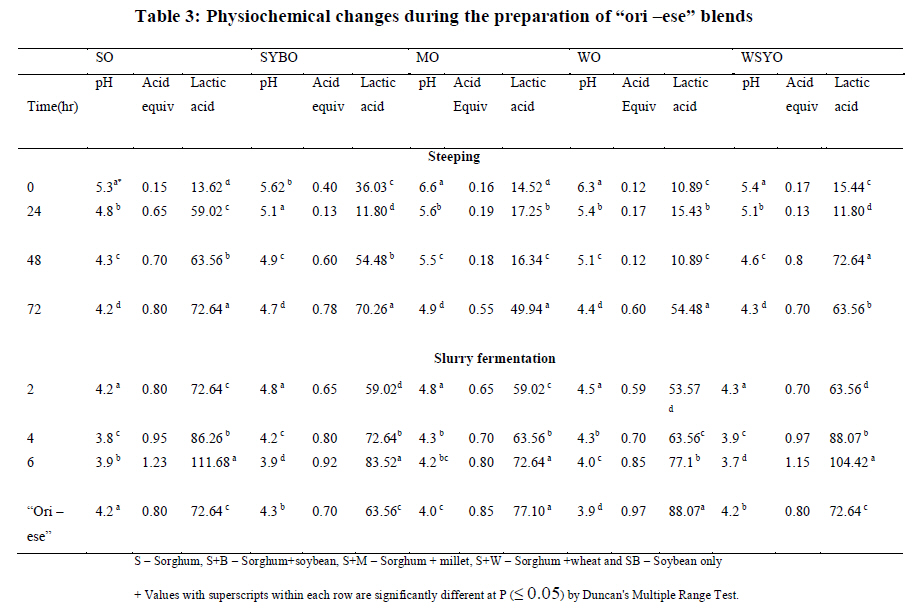
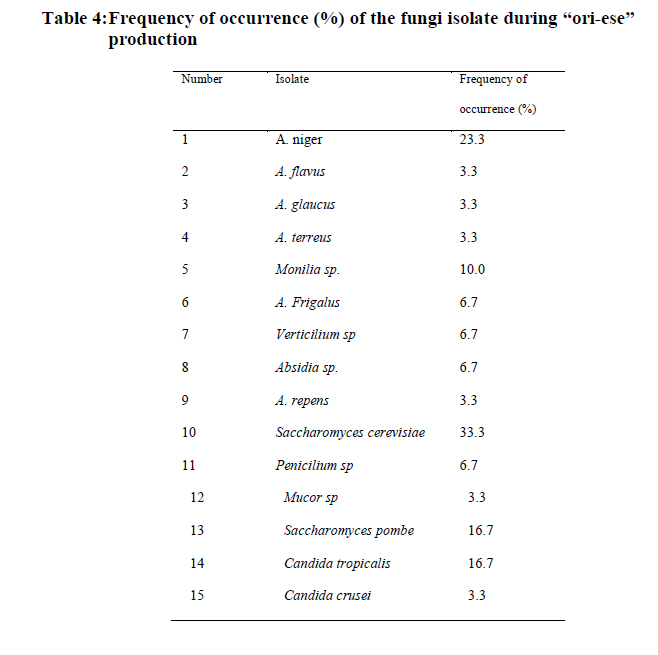
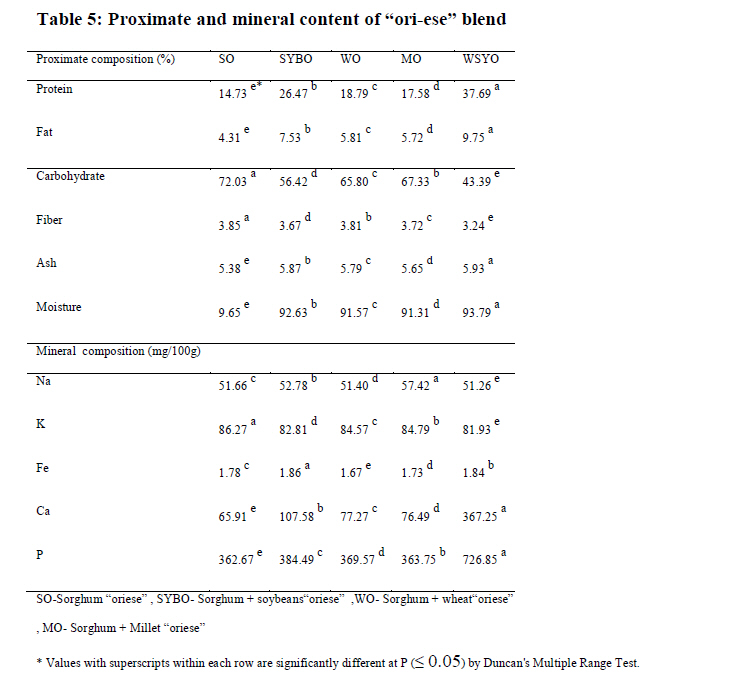
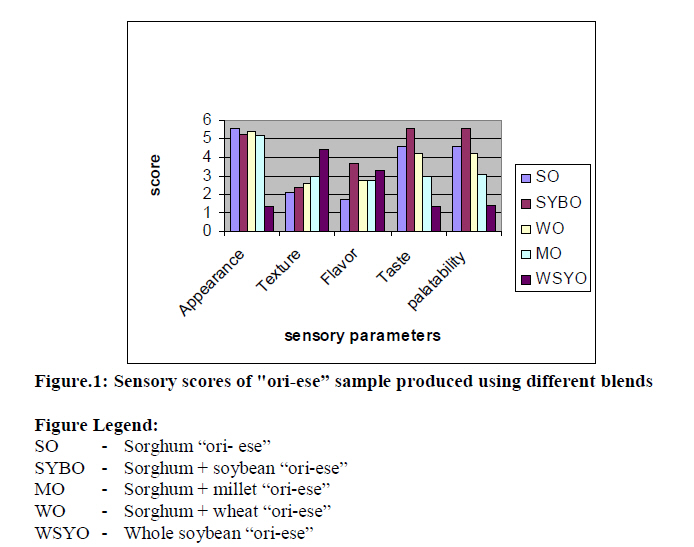
Nigeria. *Corresponding author email: bukola_tayo@yahoo.com Code Number: nd11029 ABSTRACT Sorghum is one of the important crops used for the production of different fermented foods in Africa. However, due to the fact that the nutritional quality of sorghum is poor, there is a need for fortification of these cereals with legumes or other cereals to make nutritionally rich and acceptable fermented products. “Ori ese” - a fermented thick porridge was produced from sorghum fortified with different blends: Sorghum only (SO), Sorghum-soybeans (SYBO) ratio 3:1, Sorghum-millet (MO) ratio 3:1, Sorghum-wheat (WO) ratio 3:1 and Soybeans only (WSYO). The microbial isolates during steeping and slurry fermentation consisted of lactic acid bacteria: L. plantarum, L. fermentum, Pediococcus sp., L. acidophilus, Lactococcus lactis spp cremoris, L. cellobious, L. dextranicum, coliforms ( Enterobacter aerogenes, E. coli), other bacteria (Proteus sp, Coryniformis sp, Pseudomonas pseudomalle, Streptococcus surgis, Staphylococcus aureus, Klebsiella oxytoca, Bacillus subtilis, Bacillus licheniformis, Bacillus cereus), moulds genera (Aspergillus, Penicillium, Mucor, Absidia, Monilia and Verticillum) and 2 genera of yeast (Saccharomyces and Candida). Lactic acid increased with fermentation time and this resulted in elimination of coliforms. There was a significant difference (P≤ 0.05) in pH and lactic acid production during steeping and fermentation of slurry in which the highest lactic acid concentration was recorded at 72hrs. The result of proximate analysis showed that fortification of sorghum with cereals and soybean blends resulted in an increase in protein (14. 73e, 26. 47 b, 18. 79 c, 17. 58 d and 37. 69a %) for SO, SYBO, MO, WO and WSYO respectively. There was a relative reduction in carbohydrate content and an increase in mineral content of the blends. There was a significant difference (P≤ 0.05) in proximate and mineral composition of the blends. WSYO had the highest Ca (367.25a mg/100g) and P (726.85 a mg/100g) content while SO had the highest K content (86.27 a mg/100g), SYBO had the highest Fe content (1.86 a mg/100g) and MO had the highest Na content (57.42 a mg/100g). Statistical analysis of sensory evaluation showed a significant difference (P≤ 0.05) in terms of appearance, texture and palatability. There was a preference for SO in terms of appearance, for WSYO in terms of texture, SYBO in terms of flavor and taste and SYBO and SO in terms of palatability. Key words: “Ori-ese”, sorghum, fortification, proximate, palatability INTRODUCTION “Ori-ese” is a traditional fermented sorghum, tough porridge prepared by the Yorubas in Ekiti state, western Nigeria. It is an acid fermented cereal gruel made from sorghum. The traditional method of preparation involves steeping of sorghum grain in water for 3 days followed by wet milling. Fermentation of the slurry for 24hours after which the slurry is then cooked for 30minutes, shaped into balls, wrapped in leaves and tied properly with rope further cooking for 1hour and the resulting tough porridge is “ori-ese”. Like “ogi” natural fermentation of sorghum for “ori-ese” is a wild process and effect of microorganism is not controlled [1]. Sorghum (Sorghum bicolor L. Moench) is one of the most important crops in Africa, Asia and Latin America [2]. In West Africa, un-germinated sorghum grains are generally used for the preparation of porridge. Sorghum bicolor is a crop that is widely grown in the world for food and feed. It is one of the staples for the world’s poorest people. It is a key staple in many parts of the developing world, especially in the drier and marginal areas of the semi Arid and tropics. Nutritional quality of sorghum is poor in terms of crude protein content; therefore, attempts have been made to fortify the cereal with legumes or other cereals to make a nutritionally superior and acceptable product. Vimala et al. [3] described various infant mixes based on sorghum and pear millet, fortified with soybeans, green gram, red gram or Bengal gram flour. Various combinations of sorghum with cereal and legumes have been evaluated by some researchers [4, 5, 6]. The stability of soybeans fortified with soy and cotton seed flour in different proportions has been evaluated by Brookwalter, Warner and Anderson [7] . This study was designed to determine the microbiological, physiochemical and sensory evaluation of “ori-ese” produced using different blends (sorghum, sorghum -soybeans, sorghum-millet, sorghum-wheat, and whole soybean, respectively). The result of the assessment of the quality of “ori –ese” from different blends would be of great value in Ekiti state where most low income earners frequently consume the food. It would alleviate the problem of malnutrition and its accompanying morbidity and mortality. MATERIALS AND METHODS Sample collection Sorghum (Sorghum bicolor), soybeans (Glycine max), millet (Pericetrum glaucum) and wheat (Triticum vulgare) grains were obtained from different markets in Uyo South Eastern Nigeria. Broken and moldy seeds were removed manually. Formulation of Sorghum-Cereals and Sorghum-Soybean Blends About 700 grams each of sorghum and the blend was separately weighed into 3 fermenters and 300grams each of soybean, millet and wheat was added. Three hundred grams each of sorghum and soybeans was weighed into 2 fermenters. The samples were steeped in water for 72 hours. The steeped samples were washed and wet milled, the slurry was allowed to ferment for 24 hrs after which it was boiled for 30minutes. The resulting dough was moulded into a ball shape, wrapped in Thaumatococcus daniellii Benth (“Ewe Iran”) leaves, tied with rope and cooked properly for one hour. The resulting thick porridge is “ori- ese” (Sorghum ori- ese” (SO), Sorghum + soybean “ori-ese” (SYBO), Sorghum + millet “ori-ese” ( MO), Sorghum + wheat “ori-ese” (WO) and Whole soybean “ori-ese” (WSYO). Microbiological analysis At different stages of the fermentation process, samples were collected in duplicate. That is: steeping water (24, 48 and 72 hrs) and during fermentation of slurry (0, 12 and 24 hrs). Isolation was made from serial dilution of 1ml of steeping water and 1g of the fermented samples. The dilutions were made using peptone water, after appropriate dilution, 0.1ml of the diluents were pour plated in triplicate plates on nutrient agar for total plate count, MacConkey agar for Coliform count, Salmonella/Shigella agar for Salmonella/Shigella count, Sabouraud Dextrose agar (SDA) with Chloramphenicol (250mg/100ml) was used for fungi count while for yeast count, the medium was adjusted to pH 3.5 with tartaric acid and De Man Rogosa Sharpe medium (MRS) for lactic acid bacteria count. All plates were incubated for 48hours at 300 C except for SDA, which was incubated at 260C for six days. MRS plates were incubated under anaerobic conditions (BBL gas Pak Anaerobic system, Cockeyskonlk, USA) and colony counts were made using a digital illuminated colony counter (Galen Kamp Model, England). Pure cultures of each isolate were obtained by streaking the specific colonies on suitable media, incubated appropriately and maintained on agar slants in McCartney bottles. The isolated colonies were randomly picked, purified and the organisms identified following the scheme of Sneath et al. [8] based on morphological, physiochemical and biochemical characteristics. The associated fungi were then identified with reference to Fawole and Oso’s Laboratory Manual [9] while the yeast was identified using the method of Beech et al, [10] and Lodder [11]. Physicochemical analysis The pH of the samples was determined using a pH meter (Titrimeter U9N model). The amount of lactic acid produced in the fermenting medium was determined by the titration procedure of the Spicher and Stephen [12]. Acid equivalent is the amount of NaOH consumed in ml, while each ml of NaOH is equivalent to 90.08mg of lactic acid. Proximate analysis Proximate compositions were carried out according to the method of A.O.A.C [13]. This includes determination of moisture content, ash content, crude protein, fiber, fat, total carbohydrate contents and mineral content such as potassium, calcium, phosphorus and iron. Sensory evaluation of the “ori-ese” Coded samples of “ori-ese” were served to 10 trained panelists. The panelists were asked to rate the samples for appearance, flavor, texture and overall acceptability. Triplicate determinations were made per sample. The ratings were presented on a 9-point Hedonic scale ranging from 9 = “like extremely” to 1 = “dislike extremely”. Results obtained were subjected to analysis of variance using one – way ANOVA. Differences between means were separated using Duncan’s Multiple Range Test [14, 15]. RESULTS Microbiological analysis In this study, different “ori- ese” samples were prepared from different blends of cereals and soybean. The results of the microbial examination of the samples collected at different stages of steeping and fermentation of sorghum and the blends for “ori -ese” production are shown in Table 1. The total plate count ranged from 1.0 x 10⁴ – 8.4 x 10⁵ cfu/g and 1.2 x 10² – 8.0 x 10⁵ cfu/g during steeping and slurry fermentation. The lactic acid bacterial count range from 5.3 x 10³ to 5.5 x 10⁶ cfu/g and 1.67 x10⁴ to 2.20 x 10⁷cfu/g. during steeping and slurring fermentation. The coliform count ranged from 2.5 x 10² to 4.2 x 10⁵cfu/g and 1.0 x 101 – 8.10 x 101 cfu/g. There was reduction in coliform counts from 0 hours to 72 hours of steeping and slurry fermentation after which they were not detected. The mould counts varied from 1.5 x10⁴ to 8.5 x 10⁶cfu/g and 1.0 x 10² to1.40 x 103 cfu/g during steeping and slurry fermentation. Salmonella/Shigella was not detected during steeping and slurry fermentation. Yeast count varied from 2.0 x 10⁵ to 7.5 x 101cfu/g and 6.5 x 10⁵ to 8.7 x 10⁷ cfu/g during steeping and slurry fermentation. The associated microorganisms during steeping and slurry fermentation are shown in Table 2. It consisted of lactic acid bacteria (L. plantarum, L. fermentum, Pediococcus sp., L. acidophilus, Lactococcus lactis spp cremoris, L. cellobious, L. dextranicum), coliforms ( Enterobacter aerogenes, E. coli), other bacteria (Proteus sp, Coryniformis sp, Pseudomonas pseudomalle, Streptococcus surges, Staphylococcus aureus, Klebsiella oxytoca, Bacillus subtilis, Bacillus licheniformis, Bacillus cereus), moulds genera (Aspergillus, Penicillium, Mucor, Absidia, Monilia and Verticillum) and yeast were Saccharomyces cerevisae, Saccharomyces pombe and Candida tropicalis. Moulds and coliforms constitute very low proportions of the population. However, as the fermentation progressed. The lactic acid bacteria and yeast count increased and reached the peak at 72 hrs steeping and their number increased during slurry fermentation. Physicochemical analysis The physicochemical properties of the blended “ori-ese” samples are shown in Table 3. The pH ranged from 4.2- 6.6 and 3.8-4.8 during steeping and slurry fermentation. The lactic acid ranged from 10.89 – 72.64mg and 53.57 – 111.68mg during steeping and slurry fermentation. During steeping, there was a significant difference (P≤ 0.05) in pH in which the lowest was recorded at 72 hr in all the samples. Also, significant differences were observed in lactic acid production, in which the highest was recorded at 72 hr during steeping of the blends. During slurry fermentation, the pH of the fermented slurry was significantly different from each other and the lowest was recorded at 4 hr after slurry fermentation. During slurry fermentation there was a significant difference in lactic acid production and the highest was recorded after 6 hr of fermentation. Generally, during steeping and slurry fermentation, there was a gradual reduction in pH and a concomitant increase in lactic acid development. Proximate composition The proximate composition of fortified “ori –ese” blends (SO, SYBO, MO, WO and WSYO) are shown in Table 4. The results show that fortification of sorghum with blends resulted in an increase in nutritional composition. WSYO had the highest protein content, crude fat, and ash content followed by SYBO, WO had the least. There was a significant difference (P≤ 0.05) in protein content between the blends in which the highest was recorded in WSYO (37.69 a %) while the least was recorded in SO (14.73 e %). Significant difference (P≤ 0.05) was observed in crude fat content of the blends in which SYO had the highest (9.75a %) and SO had the least (4.31 e %). The carbohydrate contents of the blends were significantly difference from each other in which the highest was obtained from SO (72.03 a %). The crude fiber contents of the blends were significantly different from each other in which the highest was recorded in SO (3.85 a %). Mineral composition Table 5 shows the levels of minerals determined in the blends. There was a significant difference (P≤ 0.05) in mineral composition of the blends. Sample SYBO had the highest Fe content, while WSYO had the highest Ca and P contents. Sample MO is richer in Na while sample SO is richer in K than MO and WO. Sample WSYO is richer in Ca and P than WO. The K content of SO is higher than that of the other blends. Sensory evaluation Figure 1 shows the sensory evaluations of the “ori-ese” samples made from different blends. Statistical analysis of sensory evaluation results showed a significant difference (P≤ 0.05) in appearance between SO and other blends, while SYBO, WO and MO are not significantly different from each other in appearance. There was no significant difference in texture between SO, SYBO and WO. There was a significant difference in taste and palatability in which SYBO and MO was rated high in terms of palatability while SYBO had the highest preference in terms of taste. DISCUSSION Different microbial species encountered during fermentation of grain and slurring may be due to uncontrolled and spontaneous nature of the fermentation. Similar result was reported by Halm et al. [16] during the steeping and fermentation stages of maize grain for “kenkey” production. The higher lactic acid bacteria and yeast count recorded during steeping and slurry fermentation may be as a result reduction in pH which has an inhibitory effect on the growth of some natural micro flora other than lactic acid bacteria and yeast. Higher level of lactic acid production during slurry fermentation was due to the fact that lactic acid bacteria dominated the fermentation, which resulted in reduction in pH of the fermenting slurry. Changes in pH and a concomitant increase in lactic acid development during steeping and fermentation may be due to metabolic activity of these micro-floras, which created a favorable condition for the lactic acid bacteria and yeast. These can tolerate the acid environment and in turn inhibit the growth of other organisms such as enteric organisms. Elimination of mould during slurry fermentation may be due to high moisture content, which does not favor their growth. Higher concentration of lactic acid recorded in sample SYBO may be as a result of glycolysis of carbohydrate substrate, coupled with gluconogenesis of the available non-carbohydrate substrate in the sample by the fermenting microorganisms. Protein increase observed in the fermented samples may be as a result of poly-phenol protein binding inhibitory effects, and as a result of the rich protein ingredients added [17]. This increase agreed with the fact that nutritional quality of sorghum is poor, and therefore attempts must be made to fortify these cereal with legumes or other cereals to make nutritionally superior and acceptable products. Higher protein content recorded in sorghum fortified with soybean (SYBO) may be due to the fact that soybean is a rich protein source, which makes it an excellent blend to complement poor nutritional quality of sorghum. An increase in protein content of fermented sorghum has been reported. Axtell et al. [18] reported that fermented sorghum is more digestible than unfermented sorghum. Fermented porridge in Africa from sorghum and other cereal blends has been reported [19]. Fermented porridge is thought to promote lactation. The highest carbohydrate and fiber content recorded for sample SO, high fiber content and poor digestibility of nutrient and other characteristic feature of sorghum and millet grain, severely influence their consumer acceptability. El- Tinay et al. [20] reported that fiber content tends to decrease during fermentation. Reduction in carbohydrate content agreed with the findings of several workers [21, 22, 23]. Decrease in carbohydrate could be attributed to the selective utilization of carbohydrate as an energy source by fermenting microorganism. Increase in fat content observed during fermentation may be as a result of microbial biosynthesis of fat by the fermenting microbes [24]. An increase in minerals composition was obtained in the blends. Significant difference (P< 0.05) was observed in the Na content of the samples. No cereals or legumes can provide adequate amount of all nutrients to meet the nutritional requirements of a child or an adult. However, even before knowledge on protein content, protein quality, digestibility and the nutrient requirement of humans became available, it was recognized that mixing legumes with cereals in the diet could improve in overall nutrition. The present and newly derived knowledge in this area makes it possible to blend, mix or fortify one food material with others so that the resulting fortified mix has not only better nutritive quality but also the necessary attributes for consumer acceptability. The
studies revealed to a great extent that fortification improves the
nutritional quality of “ori-ese”. It can thus be
concluded that, nutritionally, rich diets could be prepared from
fortification of sorghum for “ori-ese” production.
Moreover, the blends would be suitable in the total amelioration of
protein- energy- malnutrition (PEM) in the developing countries/ REFERENCES
Copyright 2011 - African Journal of Food Agriculture, Nutrition and Development
The following images related to this document are available:Photo images[nd11029t4.jpg] [nd11029t3.jpg] [nd11029t1.jpg] [nd11029t2.jpg] [nd11029t5.jpg] [nd11029f1.jpg] |
| |||||||||
