 |
| About Bioline | All Journals | Testimonials | Membership | News |
|
||||||
|
||||||
African Journal of Food, Agriculture, Nutrition and Development, Vol. 11, No. 4, July, 2011 Dietary and Socio-Economic Correlates of Nutritional Status in a Rural Adult Kenyan Population Jayne J1*, Scrimgeour AG2, Polhemus ME3, Otieno L4 and ME Bovill5 1Nutrition Care Division, William Beaumont Army Medical
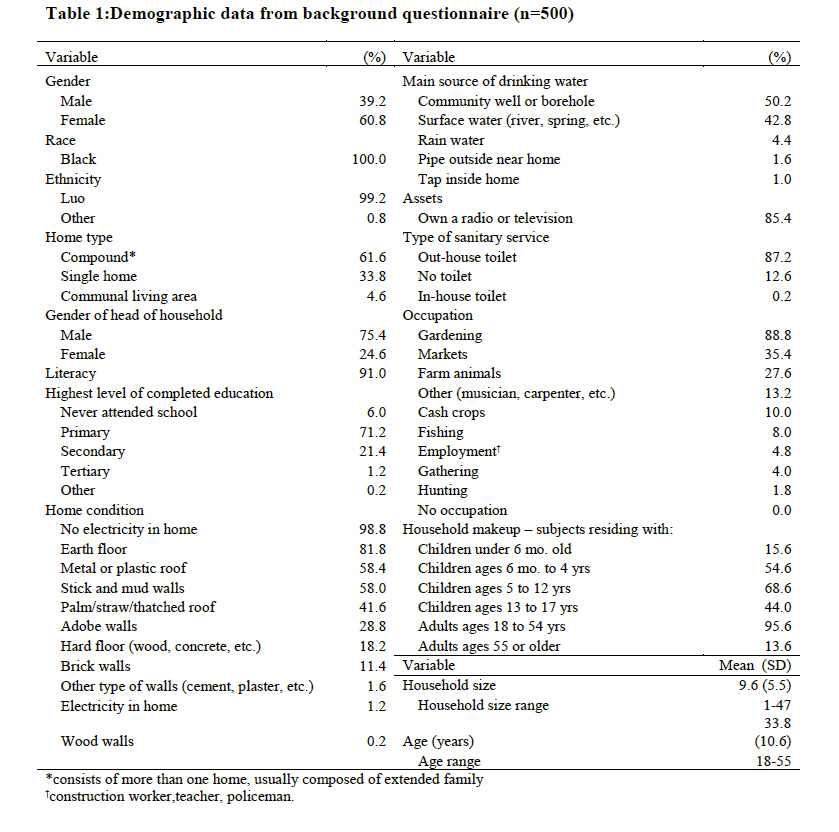
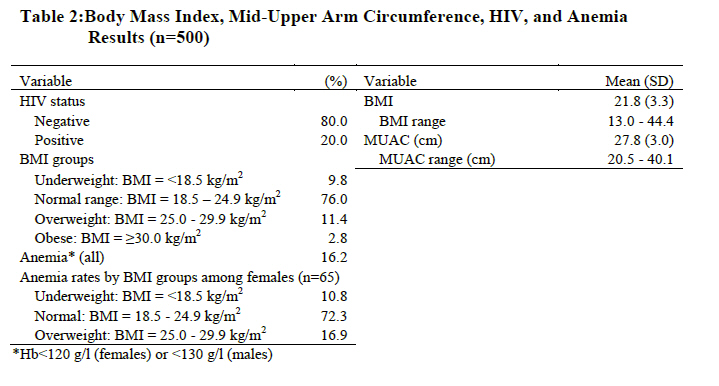
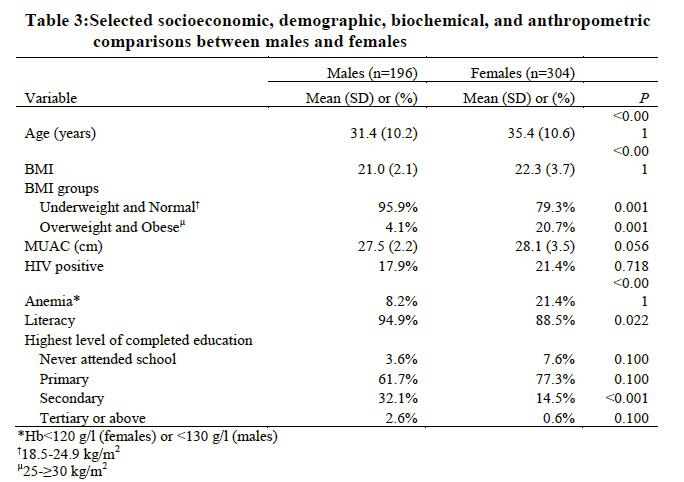
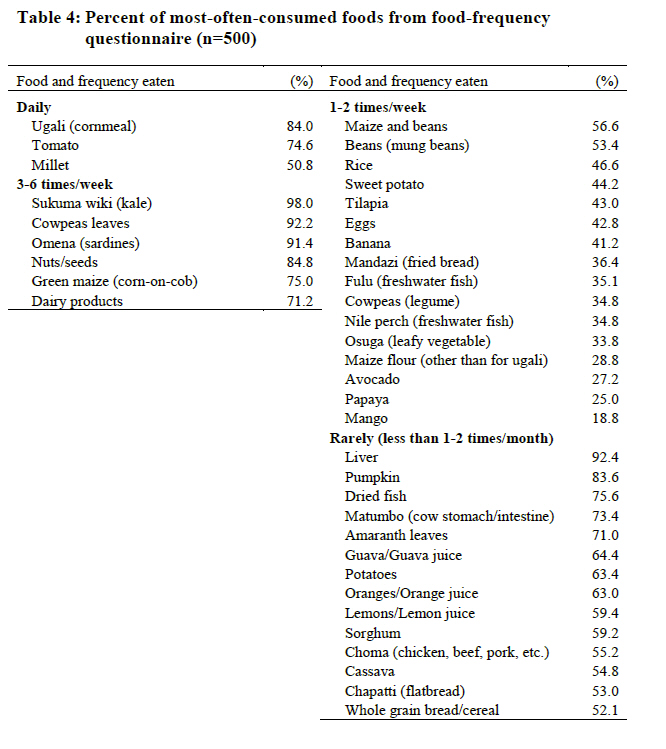
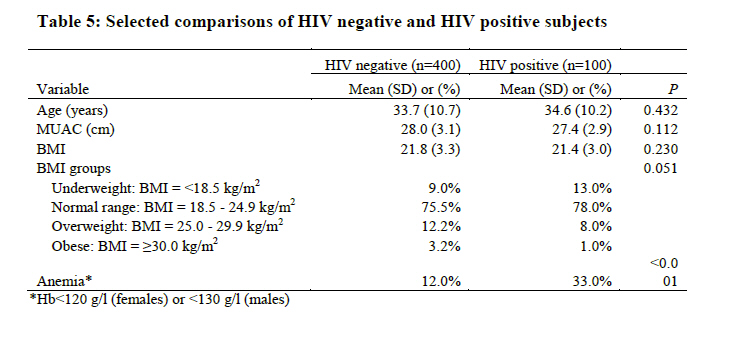
Center, Fort Bliss, Texas Code Number: nd11047 ABSTRACT There is a lack of data on trends in body composition among developing countries and the distribution of malnutrition among adults is poorly understood. Thus, the objective was to establish nutritional status, demographic make-up, dietary habits, and to determine if socioeconomic variables or dietary habits are associated with nutritional status in a rural adult Kenyan population. Five hundred Kenyan adults ages 18-55 years were recruited from the Kombewa division, located 40 km west of Kisumu, Kenya. The proportion of underweight and overweight adults is consistent with developing countries in nutrition transition. Using standard body mass index (BMI) classifications, 9.8% of the study population was underweight, 76.0% were normal weight, and 14.2% were overweight or obese. Significantly more females (20.7%) were overweight or obese than males (4.1%) (P=0.001). Iron deficiency was a significant issue, with 21.4% of females classified as anemic (Hb<120g/l). Among overweight females, anemia rates remained high (16.9%) and were greater than in underweight females (10.8%). While 20% of subjects were HIV positive, their status did not affect BMI (P=0.230). The most significant correlation between dietary data and BMI was french fry consumption (r = 0.167, P=0.001). Overweight or obese subjects reported eating french fries more frequently than subjects who had an underweight or normal range BMI (64.8% vs. 43.8%, P=0.002). Several other socioeconomic and dietary variables had weak correlations with BMI. Similar to data from developing countries in nutrition transition, it appears that the nutritional status of this rural Kenyan population has been affected by shifts in dietary patterns. Based on trends in other developing countries, it is likely that the incidence of overweight will increase in Kenya while micronutrient deficiencies and underweight remain concerns. Socioeconomic variables have been correlated with nutritional status in other developing countries and should be examined further in conjunction with food insecurity, so that culturally relevant and feasible interventions can be implemented. Key words: Nutrition Transition, Malnutrition, Adults, Overweight, Kenya In developing countries, the term “nutrition transition” describes shifts from traditional dietary and energy expenditure patterns that significantly impact the nutritional status of a population [1]. Influenced by a developing country’s integration into the global economy, during nutrition transition, the variety, appeal, quantity, and price of available foods are altered, leading to changes in diet and lifestyle habits [2]. On a global scale, such changes have led to the paradoxical phenomenon seen in developing countries where undernutrition and overnutrition coexist. In Kenya, where nutrition transition has been well documented, alarming rates of child malnutrition emphasize the still urgent need to address malnutrition, while simultaneously concentrating on the documented rise of pediatric overnutrition [3-4]. Given that the nutritional status of children is typically the focus of investigations, the causes, extent, and distribution of adult malnutrition in developing countries is poorly understood [5]. The nutritional status of adults is vital, considering their role in the economic support system. Undernutrition has critical consequences including reduced productivity and increased disease susceptibility, while the results of overnutrition in the form of chronic disease can be just as deleterious [6-8]. How this double burden is reflected in Kenyan adults is less well-known. While the paradox of under- and overnutrition has been recognized in the developing world, there is little data to identify how socioeconomic factors affect nutritional status or dietary habits in specific populations. Identifying malnourished groups and individuals is important, but such findings do little to elucidate the factors that are linked to malnutrition. Just as studies have found that various socioeconomic factors are linked to undernutrition in certain populations, socioeconomic factors have been linked to overnutrition as well [9-10]. Previous research emphasizes that for interventions to be effectively targeted to meet the needs of a population, identifying the underlying causes of malnutrition is essential. There is a scarcity of literature regarding the nutritional status of adults in many developing countries, including Kenya. This group was chosen for study to establish the demographic and socioeconomic composition, the dietary habits, and selected disease profile of this population. Another study objective was to determine and better understand the various socioeconomic and demographic variables, dietary habits, or disease states that are associated with the nutritional status of adult Kenyans. EXPERIMENTAL METHODS The data reported here was collected during a study on the impact of zinc supplementation on incidence of diarrhea conducted in Kisumu, Kenya from August 2007 to January 2008. Adults 18-55 years of age were recruited from the Kombewa Division, which is populated predominantly by the Luo people. The Luo, an ethnic group of Nilotic descent, mainly reside near the shores of Lake Victoria. The primary spoken languages are Dholuo and Swahili, and the main source of livelihood in the area is subsistence farming and fishing. Criteria for study inclusion were availability to complete the five-month study, negative pregnancy test at the time of screening, and not taking vitamins/minerals for at least two months prior to the start of the study. HIV positive volunteers were not excluded unless there was evidence of an active AIDS-defining illness or they had a CD4 count <250 cells/mm3. Upon physical examination or laboratory testing, adults who were found to have any of the following criteria were excluded: abnormal liver, pulmonary, neurological, renal, or cardiovascular abnormalities. Other exclusion criteria included allergy to zinc, diarrhea at time of enrollment, serum creatinine>1.5 mg/dl, total white cell count <3.0 x 10³/µl (males) or 2.5 x 10³/µl (females), platelet count <100 x 103/µl, hemoglobin levels <1.10 g/l (males) or 0.95 g/l (females), history of chronic drug or alcohol abuse, simultaneous participation in another clinical trial, or use of any non-registered drugs or vaccines 30 days before the study started. Informed consent was obtained from study participants, either as a signature or thumb print. All subjects received pre- and post-test HIV counseling after consent. Socioeconomic and demographic information such as ethnicity, home type, education level, and household size were collected using a background questionnaire that was completed at baseline and recorded by trained Dholuo-speaking (or Swahili-speaking) staff. HIV status and hemoglobin levels were determined using standard laboratory procedures. Iron deficiency anemia (IDA) is defined using the World Health Organization's (WHO) definition of hemoglobin <120 g/l for females and <130 g/l for males[11]. As part of the background questionnaire, volunteers answered food-frequency questions to report their usual dietary intake of common foods. The data used in this report was collected at baseline during the region's dry season. Dietary data is reported as percent of most often consumed foods. Age and gender information was collected on a screening questionnaire completed at baseline. Nutrition assessment was performed at baseline using standard anthropometric measurements, all obtained by trained staff. Weight was measured to the nearest 0.1 kg using an electronic battery-powered scale with volunteers in stocking feet and minimal clothing. Height was measured to the nearest 0.1 cm using a stadiometer and standard procedures with participants in stocking feet. Mid-upper arm circumference (MUAC) was measured using a non-stretch measuring tape and recorded to the nearest 0.1 cm. All measurements were taken twice, followed by a third time if measurements varied by greater than 0.5 cm (height and MUAC) or >0.5 kg (weight). The average of the two measures within the acceptable range was used for data analysis. Body mass index (BMI) cut-offs as defined by the WHO were categorized as follows: <18.5 kg/m2 for underweight, 18.5 to 24.9 kg/m2 for normal range weight, 25.0 to 29.9 kg/m2 for overweight, and ≥30.0 kg/m2 for obese. The independent variables were race, ethnicity, home condition (floor, roof, walls, electricity), household size, head of household gender, literacy, level of education (primary, secondary, tertiary), water source, sanitation method, information source (radio, television), occupation, HIV status, and presence of IDA. Dependent variables were MUAC and BMI. A Spearman rank correlation analysis was performed to determine if there were significant relationships between interval, ordinal, and binomial independent variables and BMI or MUAC, as well as to determine inclusion in a logistic-regression equation. Criteria for inclusion in the regression equation was a correlation coefficient (r) >0.50 and significance (P) of <0.05. Contingency tests (chi-square test or Mann-Whitney rank sum test) were performed to find significant relationships between the multinomial independent variables and BMI and MUAC, and to determine inclusion in a logistic-regression equation. Significance was set at P< 0.05. A sample size of 500 is sufficient to study 16 to 50 independent variables with 80% power. Descriptive data are reported as either mean ± standard deviation (SD) or as a percentage. Comparisons between groups (gender, HIV status) were made using contingency tests, or independent samples T-tests. Data were analyzed using SPSS software versions 16.0 (SPSS Inc., Chicago, IL, USA). The study was approved by the Kenya Medical Research Institute (KEMRI) Scientific Steering Committee, the KEMRI Ethics Review Committee, and the Walter Reed Army Institute of Research (WRAIR) Institutional Review Board. RESULTS After screening 774 potential subjects, 500 participants met the inclusion criteria and were enrolled. Characteristics of the study population, such as age, education, home type, and occupation are reported in Table 1. The sample consisted of mostly females, mean age of 33.8 years, who live in a compound. The majority of the sample had a normal range BMI (76.0%) (Table 2). The percent of subjects found to be underweight was less than those found to be overweight and obese, 9.8% and 14.2%, respectively. The average MUAC was 27.8 ± 3.0 cm. No subjects were found to have a MUAC below the cut-off indicating underweight (18.5 cm) [12]. BMI and MUAC were highly correlated with each other (r = 0.834, P=0.001). Sixty-one percent of the variability in MUAC is explained by BMI (r2 = 0.610). The BMI of males and females were significantly different with 20.7% of females classified as overweight or obese compared to 4.1% of males (P=0.001) (Table 3). Females had significantly less education than males with 15.1% of females completing secondary school or above compared to 34.7% of males (P=<0.001). Females were also significantly less literate than males, with literacy rates of 88.5% and 94.9%, respectively (P=0.022). There was no difference in the proportion of males and females who were HIV positive (P=0.718). Rates of iron deficiency anemia were significantly different in males (8.2%) and females (21.4%) (P=<0.001). Anemia rates for females by BMI groups can also be found in Table 2. A lower BMI was associated with larger numbers of children ages six months to four years in the home (r = -0.093, P=0.042), higher literacy (r = -0.138, P=0.002), owning a radio or television (r = -0.125, P=0.005), and increased consumption of green maize (r = -0.100, P=0.026), nuts/seeds (r = -0.124, P=0.006), and millet (r = -0.105, P=0.019). Larger numbers of children ages five to twelve years old in the home was associated with a higher BMI (r = 0.122, P=0.007). The most significant correlation between dietary data and BMI was french fry consumption (r = 0.167, P=0.001). Overweight or obese subjects reported eating french fries more frequently than subjects who had an underweight or normal range BMI (64.8% vs. 43.8%, P=0.002). See Table 4 for dietary data reported as percent most often consumed. The average BMI of HIV positive and negative subjects were not significantly different (P=0.230). Differences in BMI classifications of HIV positive and negative subjects did not reach statistical significance (P=0.051); however, HIV negative subjects were more likely to be overweight or obese (15.4%) when compared to HIV positive subjects (9.0%). HIV positive subjects were more likely to be underweight (13.0%) or have a normal range BMI (78.0%) than HIV negative subjects: 9.0% and 75.5%, respectively (Table 5). Rates of iron deficiency anemia were significantly higher in HIV positive participants (33.0% vs. 12.0%, P=0.000). In HIV positive subjects there were statistically significant (P<0.05) but weak correlations (r <0.50) between some socioeconomic and demographic variables and BMI. Subjects with larger households (r = 0.218, P=0.029), a corrugated roof (r = 0.255, P=0.010), and an increased consumption of pumpkin leaves (r = 0.222, P=0.026), sweet potatoes (r = 0.200, P=0.046), cowpea leaves (r = 0.226, P=0.024), tangerines (r = 0.204, P=0.041), mung beans (r = 0.254, P=0.011), Nile perch (r = 0.227, P=0.023), sardines (r = 0.227, P=0.023), french fries (r = 0.223, P=0.026), and matumbo{offals} (r = 0.222, P=0.026) were all weakly associated with a higher BMI. Increased consumption of nuts/seeds (r = -0.201, P=0.045) and popcorn (r = -0.228, P=0.023) were weakly associated with a lower BMI. The most significant demographic correlation occurred between households with a larger number of children five to twelve years old and a higher BMI (r = 0.303, P=0.002). None of the demographic or socioeconomic variables met the criteria to be included in the regression equation. DISCUSSION In this study, dietary patterns, socioeconomic and demographic variables, and selected disease profiles of an adult Kenyan population and their relationship with nutritional status were examined. Internationally accepted cut-offs for BMI were used, similar to other studies evaluating nutritional status in developing countries [13-14]. This study found that the proportion of adults who were underweight was less than those who were classified as overweight or obese with the majority of the population having a normal range BMI. These findings are consistent with data from other developing countries in the midst of nutrition transition [14-15]. It is notable, that the sample population consisted of a rural population whose lifestyle and main occupations are highly labor intensive. While Kisumu is the third largest city in Kenya, this sample population was from the district of Kombewa and the surrounding areas, which is approximately 40 km west of Kisumu. This suggests that dietary patterns have and will continue to change, reaching further into non-urbanized areas. As demonstrated in previous studies, BMI and MUAC are not equivalent methods of classifying underweight[16]. Adult MUAC cut-offs are not well defined and different values have been used to classify malnutrition. This study used the cut-off of 18.5 cm recommended by Collins to classify malnutrition in developing countries [12]. If a MUAC cut-off of 22.5 cm had been used as suggested by other researchers to classify underweight, seven subjects (1.4%), would have been classified as malnourished whereas none previously met the criteria [9]. While these differences were not significant in this sample, this indicates that valid adult MUAC cut-offs are yet undetermined. The fact that BMI and MUAC were highly correlated with each other is significant, however the r-value (r2 = 0.610) shows that 39% of the variation is unexplained. Females had significantly higher rates of overweight and obesity than males. While the data are limited, this is consistent with reports from some East-African countries [17]. In the developing world, the rate of overweight and obesity among women has been more extensively examined, while the same data on men is not available [5, 18]. As a whole, in developing countries there is inadequate information about the proportion of under- and overnutrition in adolescent boys and men. Considering their importance in the economic support system, this segment of the population should not be overlooked. Rates of anemia in females were similar to those reported in other developing countries [19]. When the distribution of anemia across BMI groups is examined, 16.9% of overweight females were anemic while no obese females were anemic. The traditional diet of Kenyans is typically high in plant phytates and low in heme iron sources [20]. The majority of our sample ate three main foods: ugali {Kenyan steamed cornbread}, tomato, and millet, two of which are grains of poor nutritional quality. Animal meats were reported to be eaten 1-2 times/week or less, with fish, which is a poor iron source, being consumed most frequently. HIV infection as well as common parasitic infections such as hookworms can also cause or worsen anemia [21]. For countries undergoing nutrition transition, existing environmental conditions coupled with the availability of energy-dense, low-micronutrient foods may explain why all women, regardless of weight, remain at risk for anemia. In Kenya, anemia remains a major public-health concern, as the effects of iron deficiency on productivity and work capacity have been well documented [22]. It is important to recognize that overweight and obesity do not preclude nutritional deficiencies. Interventions that focus on dietary education and the use of local food combinations to improve non-heme iron absorption should be examined further. Interestingly, the dietary data evaluation reveals that traditional foods still make up the majority of the subjects' diet. The majority of the sample ate traditional foods while Westernized foods such as french fries did not make the list of frequently eaten foods as only 18.6% of the sample reported eating them 1-2 times/week or more. Nonetheless, french fries had the strongest correlation with higher BMI. This suggests that even at low levels of consumption, the effect of high-calorie Westernized foods can be profound. It is also possible that the dietary recall instrument did not capture the full extent of the subjects dietary habits. The questionnaire inquired about 63 different items known to be eaten in Kenya as well as local foods that are sources of micronutrients [20]. Subjects were also prompted to disclose what “other” foods they ate besides what was on the questionnaire. A drawback of self-reported dietary information is that participants could forget to report certain items or they may under- or over-estimate food frequency. Similar studies have found specific environmental variables to be correlated with nutritional status. Research on causes of adult undernutrition in Africa found that socioeconomic determinants of malnutrition in elderly Africans include age and household size [23]. Surprisingly, this study found that the most significant correlation between socioeconomic and demographic variables and nutritional status was that among HIV positive subjects, a higher adult BMI was correlated with a greater number of children ages 5-12 years residing in the home. Studies in Ugandan children identified young age of the child’s caretaker, living in a mud walled home, lack of parental education, and decreased legume consumption to be linked to malnutrition [24-25]. A study in Ethiopian women found that age, being married, and higher education lessened the incidence of malnutrition [9]. It is possible that this study did not find significance in any of the socioeconomic variables and BMI because the majority of our sample was relatively homogeneous and had a normal range BMI. Due to the exclusion criteria, those who were excluded may have had variations in characteristics that could have affected the results. Comparing urban and rural sample populations may also have revealed differences in lifestyle and dietary habits that are correlated to nutritional status. In developing countries, trends in socioeconomic status and rates of obesity are the inverse of what is observed in developed countries. It has been well established that socioeconomic status is directly related to increases in overweight and obesity in developing countries [10]. While it has become a common measurement tool, socioeconomic status alone as a general measure does not indicate how cultural and ethnic customs are affected leading to overweight. It has been recommended that multiple socioeconomic variables be studied as the nutrition transition affects the distribution of malnutrition [5]. Research must focus on the causes of malnutrition and the implementation of culturally relevant and feasible interventions that are targeted at specific populations. The BMI of HIV negative and positive subjects were not significantly different, however HIV negative subjects tended to have a higher BMI and were significantly less likely to have iron deficiency anemia. Considering that in developing countries, HIV and malnutrition are closely linked, it is significant that the majority of the HIV positive subjects were in the normal range BMI category. It is likely that several factors contribute to this finding. The study design excluded subjects with an advanced HIV infection, which may have disqualified those who were also underweight. This study also did not assess the prevalence of food aid among subjects, yet Kenya is heavily reliant upon food aid. In 2006, Kenya received nearly 43 million dollars (USD) in food aid from the United States Agency for International Development (USAID) as well as significant contributions from the World Food Program and international aid agencies [26-27]. Much of this food aid is specifically allocated for the HIV positive population. In Kenya, due to internationally sponsored programs, anti-retroviral (ARV) drug therapy is the standard of care for HIV positive individuals. HIV infection and ARV medications can contribute to anemia and the extent to which these factors have affected the nutritional status of the population is not clear [28]. Assessing these factors is relevant when considering intervention strategies and education programs. Kenyans have many threats to food security, including endemic poverty, low economic growth, high population growth, droughts, and floods. It is unknown how these factors, coupled with recent sharp increases in global food prices, have impacted this population. At first glance it may appear that this population's nutritional status is not at risk; however it is likely that the majority of the population is highly vulnerable to variations in the food supply, with children being the first segment of the population to be affected. In adults in developed countries, studies have shown that food insecurity is linked with a higher BMI [29]. How this phenomenon is manifested in developing countries is not known. The assessment of food security among this population is pertinent when performing nutrition assessment, in the context of nutrition transition, and considering the global food crisis [30]. CONCLUSIONS The nutritional status of adults is of critical importance as adults carry the primary economic burden. This study aimed to characterize the nutritional status and identify socioeconomic factors and dietary habits that affect nutritional status in a rural adult Kenyan population. Although this study did not find significant correlations between BMI and the independent variables, clearly nutrition transition appears to have affected this rural Kenyan population such that overweight is more prevalent than underweight. Anemia remains a significant issue in females and HIV positive individuals as there are many environmental factors that may contribute to anemia and the traditional diet is low in micronutrients, while sufficient in energy to maintain a normal range BMI. The BMI of HIV positive and negative subjects were not significantly different, which may be due to the prevalence of food aid accessible to this population. It is recognized that the causes of malnutrition are multi-factorial and complex. In developing countries, the situation is further complicated by shifting dietary patterns in the midst of food shortages and rising food costs. Further assessment of this population is needed and may lead to findings that would guide appropriate intervention strategies. The challenge remains to find approaches that address both ends of the nutrition spectrum: the undernourished and the over-nourished. Possible areas of future research include:
ACKNOWLEDGEMENTS The study was funded by the United States Army Medical Research and Materiel Command. The views expressed in this article are that of the authors and do not reflect the official policy of William Beaumont Army Medical Center, the Department of the Army, the Department of Defense, or the US Government. The authors declare that they have no conflicts of interest. The authors would like to thank Dr. John A. Ward for his assistance with statistical analysis as well as Lieutenant Colonels Dianne Helinski, James Sheehan, and Major Renee Cole for their editorial revisions. The authors thank the staff at the Kombewa Clinical Research Center for their tireless dedication and the people of Kenya for their gracious hospitality. Special mentions include, Stella K. Apollo and Victorine Owira for their dedication in study coordination and Dr. Nekoye Otsyula for overseeing the clinical care of study subjects during the trial. Also, the volunteers who participated in the study are gratefully acknowledged. REFERENCES
Copyright 2011 - African Scholary Science Communications Trust The following images related to this document are available:Photo images[nd11047t3.jpg] [nd11047t2.jpg] [nd11047t5.jpg] [nd11047t1.jpg] [nd11047t4.jpg] |
| |||||||||
