 |
| About Bioline | All Journals | Testimonials | Membership | News |
|
||||||
|
||||||
Neurology India, Vol. 50, No. 2, June, 2002, pp. 181-183 Surface Mapping of Spike Potential Fields : Visual vs. Quantitative EEG Analysis V.S. Prasad, J.M.K. Murthy, S. Sailaja Department of Neurology,
Nizam's Institute of Medical Sciences,
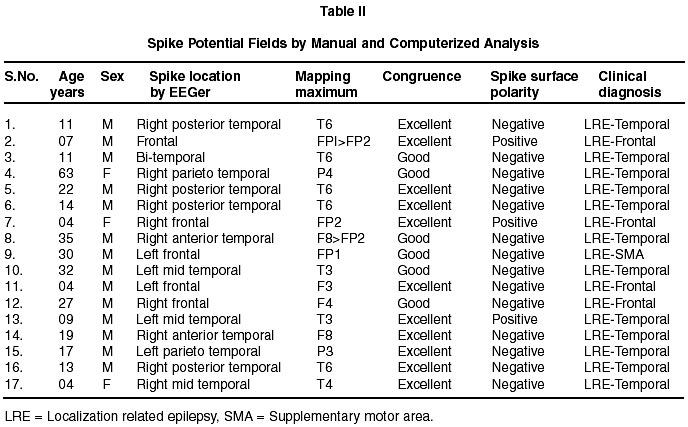
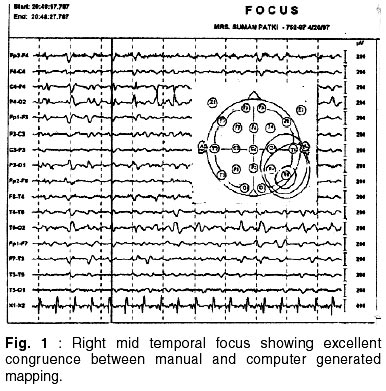
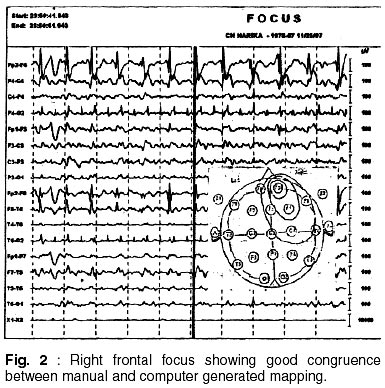
Panjagutta, Hyderabad - 500 034, India. Accepted for publication : 24th July, 2001. Code Number: ni02049 Summary Interictal EEG spike field potentials by visual and quantitative EEG analysis were studied in 17 patients with intractable localization related epilepsy. Quantitative EEG analysis was done using commercially available window based computer program (Focus) that displayed digitally acquired EEG data and performed spline mapping. Routine EEG localized 20 spikes. Fourteen spikes had excellent congruence between manual and computer generated mapping, 6 had good congruence, and 1 had fair congruence. This study clearly proves the usefulness of spline interpolation mapping technique in localizing and characterizing the epileptiform focus. Key words : Spike field potential, Quantitative EEG, Spline mapping, Intractable epilepsy. Introduction Spatiotemporal source analysis provides a tool for identifying brain regions which are active and contribute to the epileptiform discharges recorded from the scalp signals.1-6 Source waveforms proved particularly useful for revealing deep, tangentially oriented source currents. It is virtually impossible to detect these deep currents as these are widespread at the scalp and much weaker in amplitude as compared to the over lapping radial activities of the superficial cortex.3,7 Spatio-temporal source analysis also greatly improves interpretation of scalp EEG.7,8 Kozser et al8 have shown that the dynamics of spike activity, including correlations, are better visualized using the computerized technique than by manual interpretation alone. In this study, spike fields were studied using commercially available computer based program in patients with medically intractable localization related epilepsy. Material and Methods Continuous long-term EEG monitoring was performed on 17 patients with medically intractable localization-related epilepsy, using a 32 channels Neurofax EEG 2100 recording system (Nihon Kohden Corporation). Data was stored in a digital format at 200 samples/sec using an ear reference. A high pass filter of 1.6 Hz with a roll-off response of 6 dB octave was used in all analyses. A low pass filter of 35 or 7Hz was used as needed to minimize artifacts. 'Focus' program was used for spline and voltage mapping. This window based computer program displayed digitally acquired EEG data and performed spline mapping. The point in time that was of interest was chosen to display voltage mapping. The spike field analysis was done visually by two electroencephalographers using information from 5 standard montages (longitudinal, bipolar, transverse, ear references, vertex reference and average reference). Surface negativity or positivity were selected to analyze maximum amplitude of spikes.9 Spline voltage maps were also produced by spherical spline interpolation at these same points in time using data from 23 electrodes. The congruence of the electroencephalographers maps to the computer maps was determined using the criteria proposed by Kozser et al8 (Table I). Results Routine EEG localized twenty spiked form 17 patients. Eleven patients had temporal spikes, 4 had frontal spikes and 2 had parietal spikes. In 18 spikes the highest voltage was surface negative and in 2 spikes it was surface positive (Table II). Fourteen spikes had excellent congruence between manual and computer generated mapping (Fig. 1), 6 had good congruence (Fig. 2) and 1 fair congruence. Of the 11 temporal spikes, 10 showed large temporal negativity, rapid fall-off and contralateral positivity parasagitally and one had temporal negativity, a more gradual fall and no contralateral positivity. Study of dynamic changes in the spike time showed surface positivity of early portion of these spikes which later evolved over 55-60 ms to large surface negativity in the same location. Discussion Spline interpolation is the best algorithm for voltage mapping of spike potential fields.10-12 The imaging of source activity waveforms by the spline interpolation method can be readily applied in parallel to traditional bipolar and referential montages. Kozser et al8 have shown that EEG localization using spline mapping offers results comparable to traditional EEG interpretation. All spikes analyzed had excellent or good congruence between the two methods. Ebersole and Wade13 described two distinctive temporal spike populations in patients with complex partial epilepsy. Type I spike had a large temporal negativity, rapid fall-off and the existence of contralateral positivity parasagittally. These spikes are associated with mesial temporal sclerosis and outcome in these patients is excellent. Computerized spline mapping provides a means to examine the voltage fields of small and often overlooked early positivity of biphasic waves.8 The dynamic changes in these epileptiform potential have experimental physiologic correlates. Recordings in the experimental model showed biphasic paroxysmal activity close to the focus that began with a small early positivity followed by a large negativity.14 This study clearly shows usefulness of spline interpolation mapping technique in localizing and characterizing the epileptiform focus. References
Copyright 2002 - Neurology India. Also available online at http://www.neurologyindia.com The following images related to this document are available:Photo images[ni02049t1.jpg] [ni02049t2.jpg] [ni02049f1.jpg] [ni02049f2.jpg] |
| |||||||||
