 |
| About Bioline | All Journals | Testimonials | Membership | News |
|
||||||
|
||||||
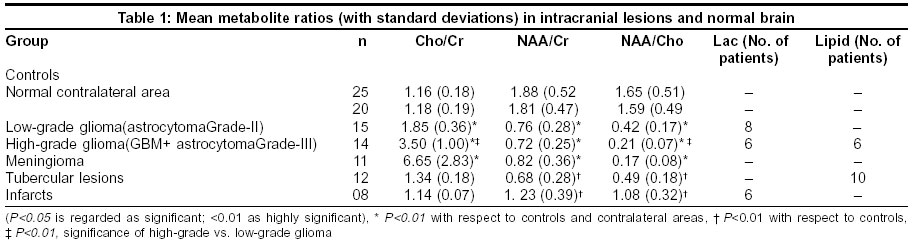
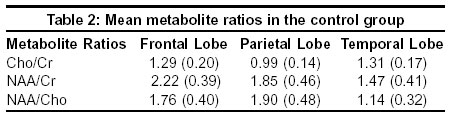
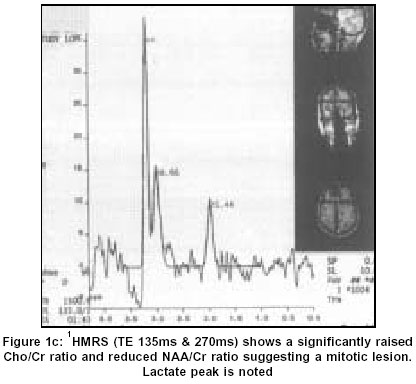
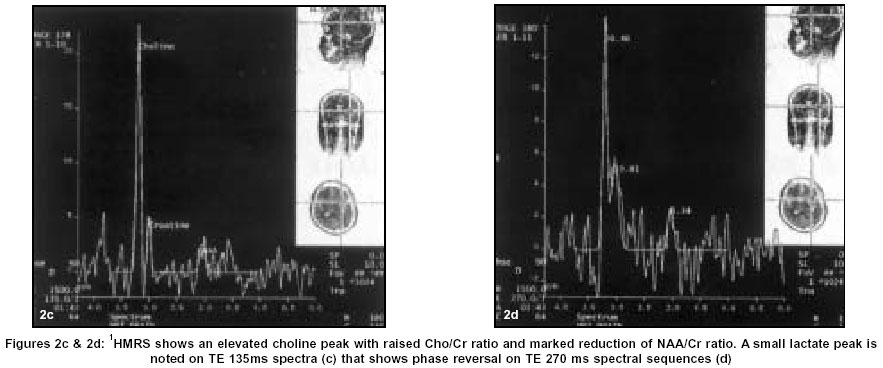
Neurology India, Vol. 51, No. 4, October-December, 2003, pp. 474-478 Original Article Role of in vivo proton MR spectroscopy in the evaluation of adult brain lesions: Our preliminary experience Kumar A, Kaushik S, Tripathi RP, Kaur P, Khushu S Institute of Nuclear Medicine & Allied Sciences, Brig S. K. Mazumdar Road, Delhi - 110054 Code Number: ni03154 Abstract Context: A definite diagnosis and characterization of intracranial mass lesions, based on structural Magnetic Resonance Imaging (MRI) alone may be difficult. In such cases Proton Magnetic Resonance Spectroscopy (1H-MRS) along with other non-invasive techniques represents an advance in the specificity of brain lesion diagnosis.1 Aims: The primary aim of this study was to evaluate the extent of the utility of 1H-MRS in adult brain tumors and their differentiation from similar-appearing space-occupying lesions. Material and Methods: MRS studies were performed on 1.5 Tesla whole body MR system using standard imaging head coil. Sixty patients (aged 30-65 years), including 35 males (31-65 years) and 25 females (30-65 years) were studied, along with 25 age-matched healthy volunteers (30-64 years). The Student ‘t’ test was used to statistically analyze the spectroscopic data for significant difference in the metabolite ratios of the lesions from normal brain tissue. Results: The Cho/Cr ratio was significantly raised in low and high-grade glioma and meningioma patients (1.85±0.36, 3.50±1.00 and 6.65±2.83 respectively) (mean±standard deviation), as compared with the control group (1.16±0.18); and NAA/Cr and NAA/Cho ratios were found to be lower than normal values in our study (P<0.01). However, in the non-neoplastic lesions, the Cho/Cr ratios were not statistically significant. The tubercular lesions revealed an average Cho/Cr ratio of 1.24±0.18, while it was 1.14±0.07 for infarcts. Conclusions: MR Spectroscopy was useful to arrive at a more definitive diagnosis in doubtful intracranial space-occupying lesions with similar morphological imaging patterns.Introduction The morphological characterization of intracranial mass lesions using conventional Magnetic Resonance Imaging (MRI) alone, even after contrast administration may be difficult without the histopathological examination of the suspected tissue.[2] Hence, there is a definite need for other non-invasive techniques to overcome this shortcoming and provide more diagnostic specificity.[1] Proton Magnetic Resonance Spectroscopy (1H-MRS) is one such technique that is superior to MRI in the detection of tumor growth in morphologically normal tissue and in the differential diagnosis of untreated intracranial space-occupying lesions (SOLs).[3] MRS provides a detailed bio-chemical analysis (metabolites) of the tissue,[4],[5] allowing direct insight into in-vivo human brain metabolism.[5] The metabolites, reliably mapped using 1H-MRS include Choline {(Cho, 3.20 parts per million (ppm)}, Creatine (Cr, 3.02 ppm), N-acetyl-L-aspartate (NAA, 2.02 ppm), Lactate (Lac, 1.33 ppm) and Lipids (1.28-1.33 ppm).[1],[6],[7] The primary aim of the study was to evaluate the utility of in-vivo 1H-MRS in brain tumors and their differentiation from similar appearing SOLs. Although it has been reported that no characteristic change in any particular metabolite in 1H-MRS can reliably distinguish between different tumor types,[1] an attempt has been made to differentiate between low and high-grade gliomas based on the metabolite ratios. Material and Methods The patients selected for the study were referred from the neurology/neurosurgery departments of various hospitals. The clinical presentations varied from features of raised intracranial tension to seizures and focal neurological signs. Patients with known extracranial malignancies and brain metastases were excluded. Sixty patients (n=60, aged 30-65 years) including 35 males [age group 31-65 years, 46.2±9.9; 46 years {mean±standard deviation (SD); median age}] and 25 females (30-65 years, 46.4±10.8; 45 years) were studied. In 20 patients, MRS was also performed from the corresponding contralateral brain regions. Twenty-five age-matched healthy volunteers (controls, aged 30-64 years) including 14 males (32-64 years, 49.1±9.7; 47 years) and 11 females (30-64 years, 45.4±11.9; 44 years) were studied for comparison and standardization. The controls selected had no apparent brain disorder or focal neurological symptomatology. All the patients were subsequently followed up for confirmation of diagnosis. Based on histopathological findings (stereotactic/postoperative), 40 patients were diagnosed with brain tumors: Glioblastoma multiforme (GBM) (n=6); astrocytoma grade-III (n=8); astrocytoma grade-II (n=15); and meningioma (n=11). Of the remaining 20 patients, 12 had a tubercular etiology and 8 had infarcts, as evaluated on follow-up studies. Proton MR Spectroscopy Prior to spectroscopic measurements, global shimming to adjust for static magnetic field inhomogeneity, and local shimming {measured as Full Width at Half Maximum (FWHM)} for static and dynamic magnetic field inhomogeneities were carried out. The global shimming was optimized at 15-17 Hz, and FWHM between 5-7 Hz. Water suppression was carried out using a gaussian pulse. As far as possible, areas of edema and adjoining calvarium were avoided to prevent signal contamination. Optimal FWHM and water suppression were achieved in most cases, however, the location and heterogeneous nature of the lesions prevented optimal shimming in some patients. LUISE software (Siemens) was used for post-processing of the acquired data. The area under the curve of a metabolite was considered as relative
concentration and was measured in terms of ratios. Measuring metabolite
peak area ratios
has the advantage of canceling out the effects of general reduction in
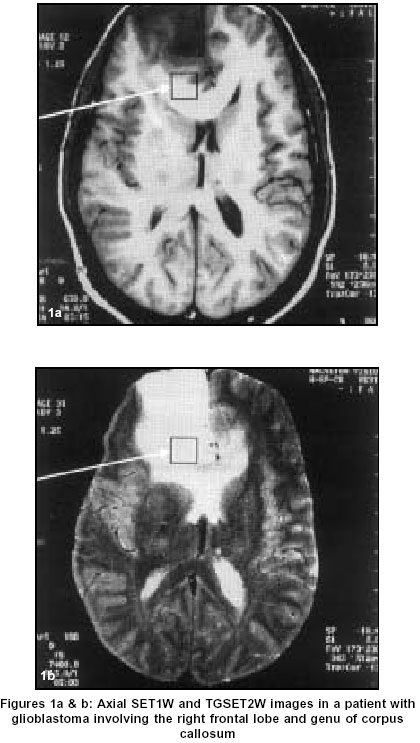
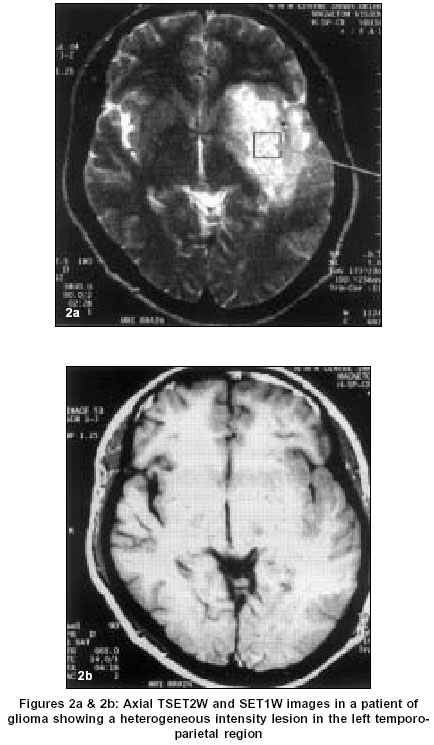
measured metabolite concentrations due to variations in cellular density.[8] Statistical Analysis Results In glioma patients (n=29), Cho/Cr ratios were elevated, with a concomitant reduction in NAA/Cr and NAA/Cho ratios. The results were compared with controls (n=25) and the contralateral areas in tumor patients (n=20). All the metabolite ratios are given in [Table - 1]. The ratios in the contralateral regions were not significantly different from the control group. The mean regional metabolite ratios (frontal, parietal and temporal regions) in the control group are given in [Table - 2]. In the high-grade glioma group (n=14) {involving right parietal (n=5), right temporo-parietal (3), right frontal and genu (1), left temporo-parietal (2), and left frontal (3) regions}, elevated Cho/Cr ratios were observed in 11 patients (range 2.54-4.89), with reduced NAA/Cr and NAA/Cho ratios [Figure:1a], [Figure:1b] & [Figure:1c]. In the remaining 3 patients, Cho/Cr ratios (2.21, 2.30 and 2.38) approximated more towards the low-grade glioma range [Figure:2a], [Figure:2b], [Figure:2c] & [Figure:2d]. The NAA/Cr ratio was not significantly reduced in these 3 patients. Six patients revealed a lipid peak at 1.30 ppm on SVS-SE-135 spectrum, which was confirmed using STEAM-10 and SVS-SE-270 sequences. Six patients also revealed a lactate peak. Eleven of the low-grade glioma patients (n=15) {involving right parietal (4), right temporo-parietal (1), right frontal (2), left temporo-parietal (1), left temporal (1), left parietal (3), and left frontal (3) regions}, revealed Cho/Cr ratios within our representative range (1.62-2.44). However, in 4 patients, it overlapped with the control group ratios. NAA/Cr and NAA/Cho ratios were lower in all the patients, with a lactate peak in 8 cases. All meningioma patients (n=11) (predominantly involving parietal and frontal regions) revealed markedly raised Cho peaks, with Cho/Cr ratio in the range of 3.39-13.12 (6.65±2.83), and reduced NAA/Cr (0.19-1.31) and NAA/Cho (0.05-0.29) ratios. Two cases were initially reported as high-grade glioma based on the metabolite ratios. No lactate or alanine peaks were noted. In 10 patients with tubercular lesions (n=12), Cho/Cr ratios (0.99-1.41) were not elevated. However, in 2 patients, the Cho/Cr ratio overlapped with the low-grade glioma range. Cho/Cr values were statistically not significant for differentiation from the control group. A lipid peak was noted in 10 patients. In patients with infarcts (n=8), imaging morphology simulated a tumor but Cho/Cr ratio (1.02-1.23) was not elevated in any patient. NAA loss was noted in 7 patients, while a lactate peak was observed in 6 cases. Follow-up studies confirmed the spectroscopic findings. Discussion Proton MRS can improve the diagnostic accuracy preoperatively in brain tumors, even obviating stereotactic biopsies in some cases[10] (especially the inoperable tumors), and helping in monitoring the response to therapeutic surgical/medical intervention. The metabolites routinely assessed include Cho, Cr, NAA, Lac and Lipids. Cho from choline-based compounds (acetylcholine, phosphocholine, glycero-phosphocholine), involved in cell membrane bio-synthesis and turnover, is elevated in processes involving increased membrane formation and cell proliferation.[11],[12],[13],[14] Cr from phosphocreatine and creatine is involved in energy metabolism. As Cr resonance intensity is relatively invariant and uniform throughout the normal brain tissue, it is used as an internal standard against which resonance intensities of other metabolites are normalized.[1],[3],[11],[12] However, Cr may be reduced in hypermetabolic and raised in hypometabolic states.[11] NAA, a neuronal marker, is decreased in processes involving neuronal loss or damage.[1],[3],[12] Lac and lipid peaks are not observed in a normal brain spectrum. Presence of lactate, an end-product of anaerobic glycolysis,[3],[15] is an indirect index of ischemic and hypoxic conditions.[1],[11],[12] A lipid signal may be detected in conditions leading to disruption of cell membranes and myelin sheaths.[1],[3] The typical 1H-MRS characteristics of gliomas include elevated Cho signal with reductions in NAA and Cr peaks; along with lactate/lipid peaks in some cases.[3],[5],[6],[11],[12],[15] Elevation of Cho in mitotic lesions reflects increased membrane synthesis and cellularity.[11] Elevated Cho/Cr ratio is generally correlated with an increase in tumor malignancy and used as a possible non-invasive index of tumor grading.[8],[14] Reduction of NAA indicates loss of normal neuronal elements, as they are destroyed and/or substituted by malignant cells.[11],[16] We could differentiate between high and low-grade tumors on the basis of Cho/Cr and NAA/Cho ratios. The reduction of Cr in tumors is probably related to an altered cell metabolism.[5],[11] The elevation of Lac reflects tissue hypoxia and subsequent anaerobic glycolysis.[3],[12],[15] The high-grade gliomas in our study showed lipid and lactate peaks, whereas low-grade gliomas revealed only lactate peaks. Similar findings have been reported earlier.[6] 1H-MRS may be useful in distinguishing atypical meningiomas from intra-axial SOLs. The Cho peak is markedly elevated in all meningiomas, particularly in recurrent meningiomas.[7],[11] This high Cho value is probably due to the high cellular density seen histopathologically in these tumors. As meningiomas arise outside the central nervous system, theoretically they should not contain NAA.[5],[11] These features are usually seen in typical meningiomas (fibrous type),[5],[7],[11],[12],[16] along with prominent lactate and alanine signals in some cases.[5],[11] Atypical and malignant meningiomas, or those invading the brain, however, may show NAA peak, and differentiating them from astrocytomas may prove difficult.[5],[11] In our study, a small NAA peak was detected in almost all the cases. Also, no lactate/alanine peaks were noted. The above findings of raised Cho/Cr ratio and reduced NAA/Cr and NAA/Cho in patients of gliomas and meningiomas were found to be highly significant statistically, with a confidence level >99% (P<0.01). Low and high-grade gliomas could be differentiated on the basis of Cho/Cr and NAA/Cho ratios with a confidence level >99% (P<0.01). We achieved a sensitivity of 73% and 86%, and a specificity of 94% and 96% for low and high-grade gliomas respectively. 1H-MRS plays a useful ancillary role in differentiating tumors from acute infarctions (without an inflammatory component) with an almost identical morphological pattern. In our group, infarctions were associated with perifocal edema and mild mass effect. However, MRS revealed normal Cho/Cr ratios, excluding a mitotic pathology. Reduced NAA may be observed as early as 4 days after infarction.[11] Lactate may be elevated in the initial 24 hours after a stroke, implying tissue ischemia. Chronic infarctions show decreased NAA, Cr and Cho, with no evidence of lactate or lipids.[11] MRS is useful in the differential diagnosis of glioma vis-à-vis untreated infective brain pathologies,[3] especially in the non-inflammatory stage. Most tubercular lesions have non-specific appearances on MR imaging and may mimic other intracranial SOLs. In our study, patients with neurotuberculosis simulated tumors on imaging morphology, whereas MRS suggested a tubercular etiology. Repeat MR studies after appropriate therapy revealed significant resolution of the lesions. Tubercular lesions have been shown to exhibit strong lipid resonances, ascribed to mobile lipids within the caseous material, which are minimally visible on MR imaging.[17] In our study, Cho/Cr ratios were not significantly high, with reduced NAA/Cr and NAA/Cho ratios. Ten of these patients, however, had strong lipid peaks indicative of a possible tuberculous etiology, which was only speculative on imaging morphology. MRS can play an important role to elucidate the cause of altered image morphology in doubtful situations, with a relatively high specificity. It also helps, at times, in distinguishing between the various types of inflammatory granulomas, which holds promise but needs further work to be critically useful. The spectral patterns are different in the majority of neoplastic and non-neoplastic intracranial mass lesions, thus aiding in better tissue characterization. Automated lesional pattern recognition using MRS is likely to be the future method of choice for classification of tumors, but these methods are not widely available as yet.[8] MRS is a useful clinical tool and more research needs to be done on this modality to let its role be defined further in terms of its clinical relevance. References
Copyright 2003 - Neurology India Free full text also available from: http://www.neurologyindia.com/article.asp?issn=0028-3886;year=2003;volume=51;issue=4;spage=474;epage=478;aulast=Kumar The following images related to this document are available:Photo images[ni03154t1.jpg] [ni03154f1ab.jpg] [ni03154f2cd.jpg] [ni03154f1c.jpg] [ni03154t2.jpg] [ni03154f2ab.jpg] |
| |||||||||