 |
| About Bioline | All Journals | Testimonials | Membership | News |
|
||||||
|
||||||
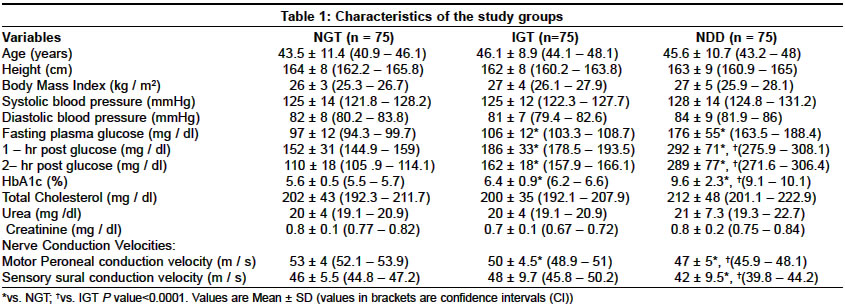
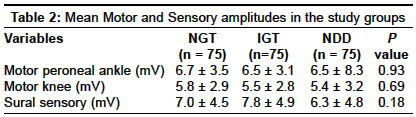
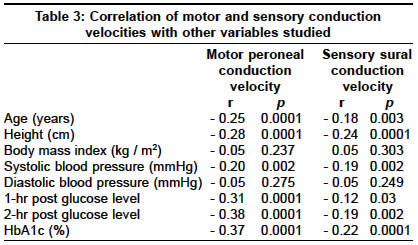
Neurology India, Vol. 52, No. 4, October-December, 2004, pp. 466-469 Original Article Nerve conduction abnormalities in different stages of glucose intolerance Viswanathan Vijay, Seena Rajasekar, Nair MamthaB, Snehalatha Chamukuttan, Bhoopathy RM, Ramachandran Ambady Diabetes Research Centre, No.4, Main Road, Royapuram, Chennai - 600 013 Code Number: ni04157 ABSTRACT AIMS: To look for changes in nerve conduction velocity (NCV) in early stages of glucose intolerance, i.e. in impaired glucose tolerance (IGT) and in asymptomatic newly diagnosed Type 2 diabetic subjects (NDD). Key Words: Type 2 diabetes, Impaired glucose tolerance, Nerve conduction velocity. INTRODUCTION Diabetic neuropathy is the most common and troublesome complication of diabetes mellitus leading to great morbidity and resulting in a huge economic burden for diabetes care.[1] Diabetic patients have a 12 times higher risk of amputations when compared with non-diabetic subjects, due to diabetic neuropathy.[2] The presence of other vascular complications such as peripheral vascular disease in diabetes increases the risk of diabetic foot complications.[3] However, the progression of neuropathy can be reduced by early detection and intervention.[4] Nerve conduction studies, primarily nerve conduction velocities are considered one of the most sensitive indices of the severity of neuropathy.[5] Nerve conduction tests are used to localize lesions and to describe the type and severity of the pathophysiologic process, including alterations in function that are not recognized clinically. In Type 2 diabetic patients decreased Nerve Conduction Velocity (NCV) is probably one of the earliest neuropathic abnormalities and is often present even at diagnosis. Thereafter, slowing of NCV generally progresses at a steady rate of approximately 1 m/s/year and it shows a correlation with the duration of diabetes.[6] It is well known that neuropathy has a metabolic component in its pathophysiology.[7],[8] Hence early metabolic aberrations as seen in impaired glucose tolerance (IGT) may also lead to changes in the nerve conduction. Studies in the Caucasian population have shown that IGT is associated with dysfunction in peripheral nerves.[9],[10] There are also studies showing a higher prevalence of undiagnosed abnormal glucose metabolism in patients with idiopathic sensory neuropathy. However, there are not many studies from India, which have looked into the prevalence of nerve conduction abnormalities in IGT and NDD subjects. This study was done to look for changes in nerve conduction in the early hyperglycemic phase, i.e. IGT and also in asymptomatic NDD subjects. MATERIALS AND METHODS This was a cross-sectional study of 225 subjects from the outpatient department of a specialty center for diabetes in India, attended by patients of all socioeconomic groups. Subjects came to the hospital for a medical checkup and to rule out the presence of diabetes. A standard oral glucose tolerance test (OGTT) (75 g glucose[11] was done for all the subjects. Based on the results (WHO criteria[12] the subjects were categorized into the following group. Group 1: Age matched non-diabetic subjects (relatives of the patients) (NGT) were selected as controls (n = 75, M:F 53 : 22). Group 2: Subjects with Impaired Glucose Tolerance (IGT) (n = 75, M : F 57 : 18) Group 3: Newly diagnosed diabetic subjects (NDD) (n=75, M: F 53: 22) The exclusion criteria were: (a) All the subjects were questioned and examined for the presence of any symptoms of neuropathy such as muscular cramps, numbness, abnormal hot or cold sensations, tingling sensation, burning sensation, aching pain and irritation in the lower legs and the feet. The presence of any minor symptoms was an exclusion criterion. The institution′s ethics committee approved the protocol and oral informed consent was obtained from all the participants. Height and weight were measured and body mass index (BMI kg/m2) was calculated in all the study subjects. Blood pressure (BP) recordings were also done. Biochemical parameters such as fasting plasma glucose and 2 hour post glucose were determined by using glucose oxidase method[13] (Roche Mannheim, Germany). Glycosylated Hemoglobin (HbA1c) was quantitatively determined by immunoturbidimetric method (Roche Mannheim, Germany).[14] Nerve Conduction Velocity Measurement Nerve Conduction Velocity (NCV) measurements were made using the standard RMS EMG EP machine (Recorders and Medicare systems, India). NCV recordings were done using standard procedures such as temperature control (32-34 °C), careful distance measurements and recording of well-defined and artifact-free responses.[15],[16] Motor NCV (MCV) of the peroneal nerves was measured by conventional methods with surface electrodes. Sensory NCV (SCV) in the sural nerve was also measured. All the NCVs were determined on the left side of the body. The neurologist conducting the NCV procedure was blinded to the subject groups. Statistical Analysis Statistical analysis was performed using SPSS, version 4.0.1 (SPSS, USA) and EPI INFO V 5.01a program (CDC of Atlanta, USA and the WHO, Geneva, Switzerland). Data with normal distribution were expressed as mean ± S.D. ANOVA was used to determine the differences between the groups. The trend chi-square test was used for comparison of categorical variables. Correlation between variables for the total group of subjects was tested using Pearson correlation analysis. Multiple linear regression analysis was used to analyze factors that were independently associated with both MCV and SCV in the entire group of subjects. The mean MCV and SCV of the controls minus 2SD[17] were taken as the cut-off value for slower conduction velocities. A 2-tailed P value<0.05 was considered as statistically significant. RESULTS As shown in [Table - 1], age, height, BMI, systolic blood pressure and diastolic blood pressure did not differ between the three groups. HbA1c level was significantly higher in the diabetic group (9.6 ± 2.3%) when compared with the IGT (6.4 ± 0.9%) and NGT (5.6 ± 0.5%) groups. The mean MCV was significantly lower in the NDD group (47 ± 5 m/s) when compared with the other two groups (IGT=50 ± 4.5 m/s; NGT= 53 ± 4 m/s; P=0.0001). The IGT group of subjects also exhibited a significantly lower mean MCV level when compared with the NGT subjects (P=0.0001). The mean SCV values in the NDD group (42±10 m/s) were also significantly lower (P<0.0007) than the NGT (46±6 m/s) and the IGT (48±10 m/s) groups. However, no significant difference in the mean SCV values between the NGT vs. IGT groups was noted. The mean motor and sensory amplitudes did not differ between the study groups [Table - 2]. The correlation analysis showed that age, height, systolic blood pressure, fasting plasma glucose, 2-hr post glucose and HbA1c showed a significant negative correlation (P<0.05) with both MCV and SCV values. However, no significant correlation was found between NCVs and BMI and diastolic blood pressure [Table - 3]. There was no difference in the mean MCV (m/s) and SCV (m/s) values between males (MCV: 52 ± 4, SCV: 46 ± 5) and females (MCV: 52 ± 4, SCV: 48 ± 6.1) in the NGT group. In the IGT group the females (MCV: 52.8 ± 5.5, SCV: 49 ± 10.6) had significantly higher MCV values when compared with the males (MCV: 49.6 ± 3.8, SCV: 47.1 ± 9.4). Similarly, significantly higher MCV and SCV values in females (MCV: 48.9 ± 5.1, SCV: 46.3 ± 5.7) than in males (MCV: 46.3 ± 4.8, SCV: 40.7 ± 10.3) were noted in the NDD group of subjects. Based on control MCV (53 ± 4 m/sec), SCV (46 ± 5.5 m/sec) mean - 2SD, a MCV value < 45 m/sec and SCV < 35 m/sec was abnormal. The prevalence of abnormal MCV was statistically higher (c2 = 12.7, P<0.0001) in the NDD subjects (39%) when compared with the IGT subjects (12%). However, no difference in the prevalence of abnormal SCV was noted between the IGT (7%) and NDD subjects (8%). In the multiple linear regression analysis [Table - 4], both age and male gender were the risk factors for the development of abnormal MCV and SCV levels. Abnormal MCV was also found to be associated with 2-hr post glucose levels (R2 = 14.5%), while HbA1c (R2 = 4.9%) contributed towards abnormal SCV. DISCUSSION This study confirms the well-established fact that NDD subjects exhibit abnormal MCV and SCV readings. Decreased NCV in the newly diagnosed or neurologically asymptomatic diabetic subjects has been reported previously.[16] The major finding of the study was that the IGT subjects exhibited slower MCV when compared with the NGT. This is contrary to the findings of Eriksson et al,[18] who showed that diabetes and not IGT was associated with peripheral nerve dysfunction. Even though the mean SCV was lower in the NDD group when compared with the IGT and the NGT group, the prevalence of abnormal SCV was similar in both NDD and IGT subjects. In a study by Singleton et al,[9] it was shown that painful sensory neuropathy was associated with IGT. Lehtinen et al[16] had reported that clinical diabetic neuropathy is not common at diagnosis of Type 2 diabetes but disturbances in peripheral and autonomic nerve function a noted by electrophysiological and cardiovascular reflex method are often present at that stage. They reported that the prevalence of abnormal NCV was 15.2% in newly diagnosed Type 2 diabetes. In our study we found that the prevalence of sensory and motor neuropathy was 39% and 8% in the NDD subjects and 12% and 7% in the IGT subjects. The prevalence of abnormal MCV in the IGT subjects in this study was similar to that reported by Lehtinen et al[16] in the newly diagnosed Type 2 diabetic subjects. The reason for such a marked increase in the prevalence in the IGT group is unknown. Thrainsdottir et al[19] had shown that increased basal membrane thickening was associated with sensory peripheral neuropathy in IGT and diabetic subjects. This may be one of the reasons for slower MCVs in the IGT subjects in our study. Insulin resistance and hyperinsulinemia with associated alteration in capillary function are hallmarks of IGT and early Type 2 diabetes; it is tempting to speculate that early endoneurial capillary microangiopathy in these groups could be attributed to insulin resistance and/or hyperinsulinemia.[19] Males in the IGT and NDD groups exhibited lower NCV values when compared with the females. Further, in the multiple linear regression analysis, both male gender and age contributed towards abnormal MCV and SCV. Increased risk for male gender could be attributed to the increased prevalence of smoking habit noted among these subjects. Studies by Graf et al[20] and Tkac et al[5] had shown that the glycemic level was associated with abnormal conduction velocities. Weerasuriya et al[21] had observed an inverse correlation between NCV and fasting blood sugar in Sri Lankan Type 2 diabetic subjects. In our study, we noted an inverse correlation of SCV and MCV parameters with HbA1c and 2-hour post glucose levels in the multiple linear regression analysis. This indicates a possible direct cause and effect relation between hyperglycemia and abnormal SCV. Neuropathy associated with IGT primarily affects small fibers and is similar to early diabetes-associated neuropathy.[22] Several studies[23],[9] have explored different states of glucose intolerance in patients with neuropathy, however the present study has tried to evaluate nerve conduction abnormalities in patients with impaired glucose tolerance. Prevalence of nerve conduction abnormalities in the IGT stage calls for early screening of these subjects for complications. As IGT is a forerunner of diabetes and is easily identified by standard OGTT, it is essential to look for this early marker of several metabolic abnormalities such as impaired nerve conduction. The early detection of abnormal glucose metabolism is particularly important, as treatments will probably be most effective if administered early in the course of neuropathy, when abnormalities of peripheral nerves are more likely to be reversible.[24],[25] Intensified monitoring and intervention is also needed in the NDD subjects to prevent further progression of pre-existent diabetic neuropathy. This was a preliminary cross-sectional study conducted to determine the presence of nerve conduction abnormalities in different stages of glucose intolerance. There is however a limitation in this study, the presence of hypothyroidism and B12 deficiency was not excluded by biochemical tests in all the study subjects. The presence of abnormal NCV in patients with glucose intolerance found in this study needs to be confirmed by a prospective long-term study involving a larger cohort of subjects. REFERENCES
Copyright 2004 - Neurology India The following images related to this document are available:Photo images[ni04157t4.jpg] [ni04157t1.jpg] [ni04157t3.jpg] [ni04157t2.jpg] |
| |||||||||
