 |
| About Bioline | All Journals | Testimonials | Membership | News |
|
||||||
|
||||||
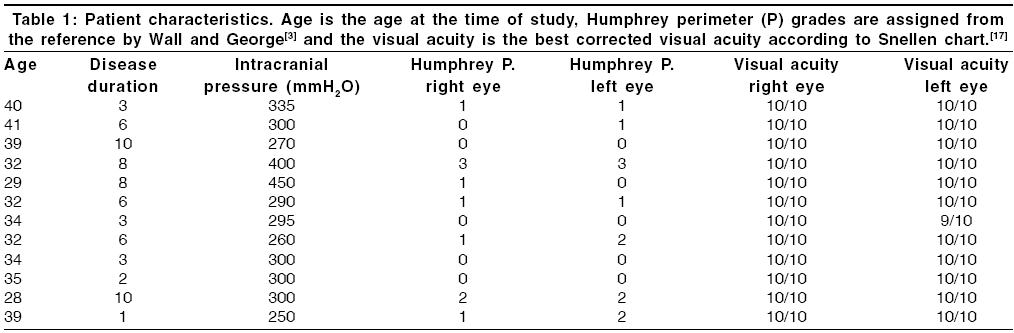
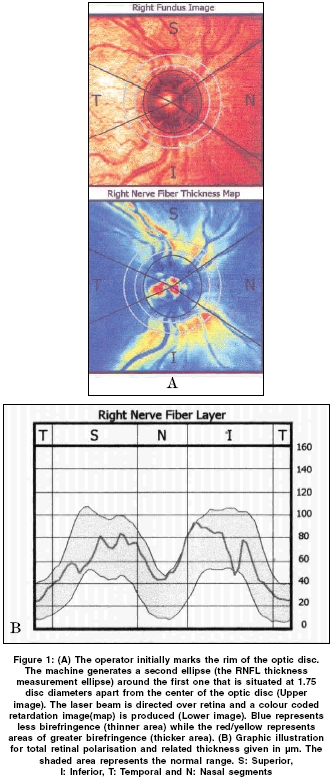
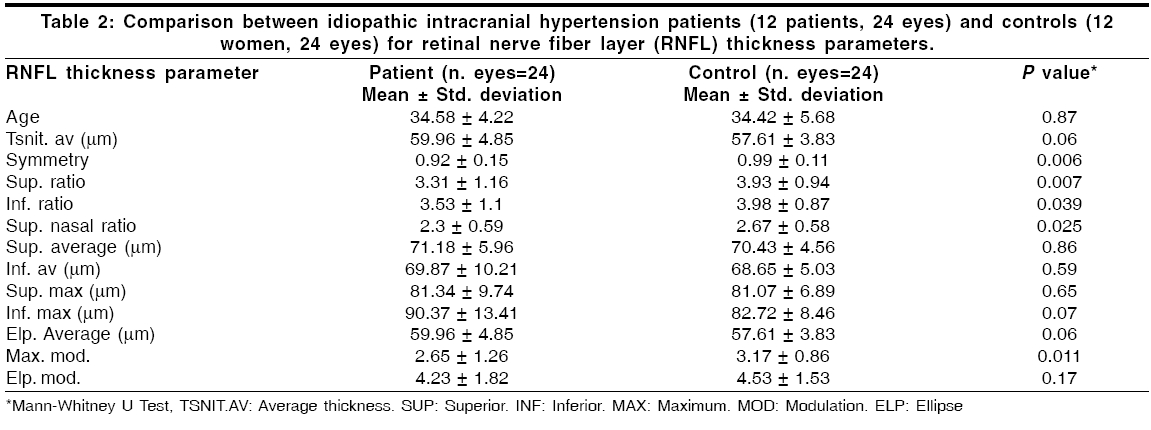
Neurology India, Vol. 54, No. 2, April-June, 2006, pp. 168-172 Original Article Retinal nerve fiber layer analysis in idiopathic intracranial hypertension Uysal TanFunda, Cengiz Akarsu, Reyhan Gullu, Hatice Doner Departments of Neurology, Kirikkale University, Faculty of Medicine, Kirikkale Code Number: ni06049 Abstract Background: The chronic nature of idiopathic intracranial hypertension (IIH) represents a risk factor for progressive optic nerve damage and structural abnormalities of the retina.Aim: We measured the retinal nerve fiber layer (RNFL) thickness in patients followed with the diagnosis of IIH who had no or mild visual impairment to search for possible structural alterations in the retina for diagnostic and prognostic purposes. Settings and Design: Case-control prospective study. Materials and Methods: The study group consisted of 12 women followed and treated with the diagnosis of IIH in our clinic. The selection criteria were the, normal optic nerve, normal visual fields or mild visual field defects (Grade 1-3) by Humphrey perimeter. Randomly assigned, age-matched 12 healthy women were taken as the control group. Retinal nerve fiber layer thickness was evaluated with scanning laser polarimetry and both eyes were studied for each case in both groups. Statistical Analysis Used: Mann-Whitney U test. Results: The mean ages of the patient and the control groups were 34.58±4.2 and 34.42±5.7 years respectively ( P =0.87). The mean duration of disease was 5.5±3 years. Some parameters related to RNFL thickness were found to differ significantly between patients with IIH and control subjects. Namely superior ratio ( P =0.007), inferior ratio ( P =0.039), superior-nasal ratio ( P =0.025), maximum modulation ( P =0.01) and symmetry ( P =0.006) were lower in the patient group than controls. Conclusion: Scanning laser polarimetry might be a good adjunct for determining possible structural affects of IIH on the retina in patients with no or mild visual impairment. Keywords: Idiopathic intracranial hypertension, retinal nerve fiber layer thickness, scanning laser polarimetry. Introduction Idiopathic intracranial hypertension (IIH) is a disorder characterised by increased intracranial pressure (ICP) in the absence of intracranial disease such as space occupying lesion or ventriculomegaly, abnormal cerebrospinal fluid (CSF) composition and cerebrovascular disease. Although the disorder was described more than a century ago, its pathogenesis remains unclear.[1] It is known to be associated with significant visual morbidity even blindness in up to 10% of the cases.[2],[3] Although the papilledema and symptoms might be transient the chronic nature of the disease represents a risk factor for progressive optic nerve damage and structural abnormalities of the retina.[2],[4] Visual field testing is considered to be a reliable method to assess the optic nerve damage in patients with IIH. [2],[5] Visual field defects in IIH are similar to glaucoma and usually include an enlarged blind spot, nasal steps, arcuate defects, inferior altitudinal loss and generalised constriction.[5],[6]Scanning laser polarimetry is a device designed for objective and quantative measurement of retinal nerve fiber layer (RNFL) thickness.[7],[8] The validation of the instrument was confirmed in animal models[7],[8] and the device was used for various purposes in ophthalmology like the detection and follow up of glaucoma, documentation of optic neuropathy and assessment of diabetic retinopathy.[9],[10],[11],[12],[13] The present study was designed to investigate whether measurement of RNFL thickness with scanning laser polarimetry might yield additional benefit for searching ophthalmologic complications of IIH and provide quantitative information for follow up during the course of the disease. A selected group of IIH patients were included to the study who had no or mild visual impairment to search for possible structural alterations in the retina for diagnostic and prognostic purposes. Materials and Methods Subjects This study was conducted during May 2004 and December 2004 in a group of 12 consecutive female patients with no or mild visual impairment selected among patients followed and treated with the diagnosis of IIH in our clinic. The selection criteria were the absence of papilledema (resolved papilledema), normal optic nerve (no atrophy), normal visual fields or mild visual field defects (Grade 1-3) by Humphrey perimeter during follow up. Patient characteristics are given at [Table - 1]. In all patients the diagnosis of IIH was made previously by using the modified Dandy criteria by Smith which requires the presence of: signs and symptoms of increased ICP (headache, papilledema etc.), no localizing neurological sign other than sixth nerve palsy, increased CSF pressure (≥ 250 mm H2O for all patients) with normal composition (normal protein and glucose levels and number of cells) no evidence for hydrocephalus (small-normal and symmetric ventricles) or mass lesion confirmed by CT scan or MRI and no other cause of IIH.[14],[15] The lumbar puncture was performed in the lateral decubitus position from the L3-L4 intervertebral space using a standard 20G spinal lumbar puncture needle. Randomly assigned 12 healthy women of similar age and sex were taken as the control group which was not subjected to lumbar puncture. After neurological evaluation all patients with IIH and control subjects underwent a complete ocular examination including history taking, measurements of visual acuity and refraction, ocular motilities, intraocular pressure measurement, visual field examination with Humphrey automated perimeter and bio-microscopy of the anterior and posterior segments. Patients were excluded from the study if they had a neurological disease other than IIH, any systemic disorder or medication that could cause papilledema or IIH; any previous eye disease particularly surgery, glaucoma, retinal disorders or systemic disorder affecting vision such as diabetes mellitus, hypertension etc. Same exclusion criteria were also applied to the control group. In accordance with the ethical standards each participant was adequately informed, agreed participation and a written informed consent was obtained from all of the patients that had entered to the study. Scanning laser polarimetry Retinal nerve fiber layer thickness was evaluated with scanning laser polarimetry (Nerve Fiber Analyzer, GDx VCC:5.3.3, Laser Diagnostic Technologies, San Diego, California, U.S.A) for both IIH and control groups. The measurement of RNFL thickness was carried out by the same examiner, who was unaware of the patient and control status. Examinations were done in the same room for all subjects and the pupils were undilated. After ophthalmological evaluation and test for exclusion criteria, for each case, both eyes were evaluated in both the patient and control groups as IIH is expected to affect both. As all subjects and eyes fulfilled the inclusion criteria a total number of 48 eyes (24 from the patient and 24 from the control groups) were taken to the study. The technique of scanning laser polarimetry was described elsewhere previously.[7],[8],[9],[10],[11],[12],[13] When the polarised laser beam illuminates the retina it passes through the birefringet RNFL that changes the state of polarisation of the light source. The amount of change in polarisation (retardation) is correlated with RNFL thickness.[7],[8] The polarisation detection unit provides digital real time images of the ocular fundus. The operator initially marks an ellipse at the rim of the optic disc [Figure - 1]. The machine generates a 10-pixel wide second ellipse (the RNFL thickness measurement ellipse) around the first one that is situated at 1.75 disc diameters apart from the center of the optic disc. The laser beam is directed over 256x256 pixel (each corresponding a retinal point) retinal locations and a colour coded retardation image(map) is produced such that blue represents less birefringence (thinner area)while the red/yellow represents areas of greater birefringence (thicker area) [Figure - 1]. The device measures and gives a series of parameters related to RNFL thickness. For each subject more than one good quality images were acquired to obtain the best image that would be used for the measurement of RNFL thickness. For all patients mean RNFL thickness values were computed for all of the retina as well as superior (120°), inferior (120°), temporal (70°) and nasal (50°) segments [Figure - 1] and compared with the control group. The used parameters were previously defined as:[10],[11],[12] Average Thickness (μm): The average thickness for all pixels in the image outside the disc margin Symmetry: The ratio of the average 1500 thickest pixels in the superior quadrant divided by the average 1500 thickest pixels in the inferior quadrant. Superior (Inferior) Ratio: The ratio of the average 1500 thickest pixels in the superior (inferior) quadrant divided by the average 1500 thickest pixels in the temporal quadrant. Superior-Nasal Ratio: The ratio of the average 1500 thickest pixels in the superior quadrant divided by the average 1500 thickest pixels in the nasal quadrant. Superior (Inferior) Average (μm): The average thickness of RNFL beneath the measuring ellipse in the superior (inferior) sector. Superior (Inferior) Maximum (μm): The mean of the 1500 thickest pixels in the superior (inferior) RNFL. Ellipse Average (μm): The average thickness of RNFL beneath the measuring ellipse along its circumference. Maximum Modulation: Gives an index of the difference between the thickest(superior, inferior quadrants) and thinnest parts (temporal, nasal quadrants) of all RNFL. Ellipse Modulation: Gives an index of the difference between the thickest and thinnest parts beneath the measurement ellipse. Statistics The statistical analysis was done by the Statistical Package for Social Sciences (SPSS) program. The Mann-Whitney U test was used to compare numeric variables between headache and control groups and P values < 0.05 were considered as statistically significant. Results The mean ages of the patient and the control groups were 34.58±4.2 and 34.42±5.68 years respectively ( P =0.87). The mean duration of disease was 5.5±3 years and the mean intracranial pressure as 312.5 mmH 2 O. At the time of study 66.7% of the patients and 14 eyes (58.33%) had visual defects assessed by Humphrey perimeter [Table - 1]. However most visual field defects were of mild grades and visual acuity was excellent in all cases. None of the patients had papilledema. All cases received acetazolamide in a dose of 750-1000 mg/day and weight loss was encouraged especially in obese patients. Briefly, although measurements were usually similar, some parameters related to RNFL thickness were found to differ significantly between patients with IIH and control subjects [Table - 2]. Namely superior ratio ( P =0.007), inferior ratio ( P =0.039), superior-nasal ratio ( P =0.025), maximum modulation ( P =0.01) and symmetry ( P =0.006) were lower in the patient group than controls. Finally the relationship between the level of intracranial pressure and parameters of RNFL layer was investigated using Spearman correlation analysis. This test revealed a negative correlation between superior average (coefficient -0.53, P =0.008), superior maximum (coefficient -0.51, P =0.011) parameters and intracranial pressure meaning that the higher is the pressure the thinner is the RNFL in the superior sector. Discussion The most important complication of IIH is severe visual morbidity. Although fundus images obtained at certain periods are helpful for objective documentation and comparison of the disease process, visual field testing especially with Humphrey perimeter is considered as a reliable method to assess the optic nerve damage in patients with IIH.[2],[5],[6] In a series of 50 patients, visual field defects were found in 96% of the cases at initial evaluation by Goldmann perimetry that were improved after treatment in 60% of the patients but visual function deteriorated in 5 cases (10%).[3] Similarly Rowe and Sarkies assessed the visual function in 35 IIH patients prospectively over a 3 year period.[6] Although visual field defects still persisted in 75% and 56% of the cases by Goldmann and Humphrey perimetries respectively the visual status improved significantly throughout the follow-up period and the final visual outcome was excellent or good in the majority of the patients. This was attributed to the fact that most visual field defects were of mild grades (grade 1 or 2) thus most patients were unaware of the defect. Though uncommon, the gradual and insidious development of severe visual loss necessitates periodic monitoring of visual fields and acuity in IIH. New visual field defects or progression of previous defects are accepted as indicators of progressive optic damage and imply a more aggressive treatment approach.[5],[16] However fluctuations might be possible thus a repeat analysis might be prudent in case of suspect.[5] In a small number of patients with IIH Mullholland et al . used confocal scanning laser ophthalmoscopy (SLO) acquired optic disc images to monitor papilledema.[17] The authors reported that SLO had a high sensitivity for detecting small changes in disc volumes and correlated closely with visual field changes in the short term. Test-retest variability might make perimetry somewhat problematic in deciding when progressive loss is occurring and when to recommend invasive treatments. If test-retest variability for the nerve fiber layer measurement could be shown better than that of perimetry, it may be the preferred way to follow them for deciding on intervention even when field loss and thinning is well established. However in patients without or with mild visual improvement like our study group, RNFL analysis with scanning laser polarimetry might also provide early valuable information. Our data revealed that superior ratio, inferior ratio, superior-nasal ratio, maximum modulation and symmetry were lower in the patient group than controls. These parameters are indicators of differences between thickest (superior and inferior) and thinnest parts (nasal and temporal) of the retina [Figure - 1]. The difference between ratios might represent an early change not reflected by other indices like superior-inferior average, superior-inferior maximum or total-ellipse average. Previously Hedges et al . analyzed RNFL changes in patients with IIH from photographs of RNFL and used visual field tests to determine the clinical usefulness of RNFL analysis in the clinical management of patients with papilledema.[18] The location of the nerve fiber layer changes correlated with corresponding sites of visual field loss and superior regions within the nerve fiber layer were affected 5.4 times more frequently than inferior regions. Similarly we found that the RNFL in the superior sector was more adversely affected with increased pressure. In conclusion scanning laser polarimetry might be a good adjunct for determining possible structural affects of IIH on the retina in patients with no or mild visual impairment. It might supply additional measurable indices for follow up. As the series is small this report provides only preliminary information that might lead clinical research in this field and further data with larger series are necessary to clear the subject adequately. References
Copyright 2006 - Neurology India The following images related to this document are available:Photo images[ni06049t1.jpg] [ni06049f1.jpg] [ni06049t2.jpg] |
| |||||||||
