 |
| About Bioline | All Journals | Testimonials | Membership | News |
|
||||||
|
||||||
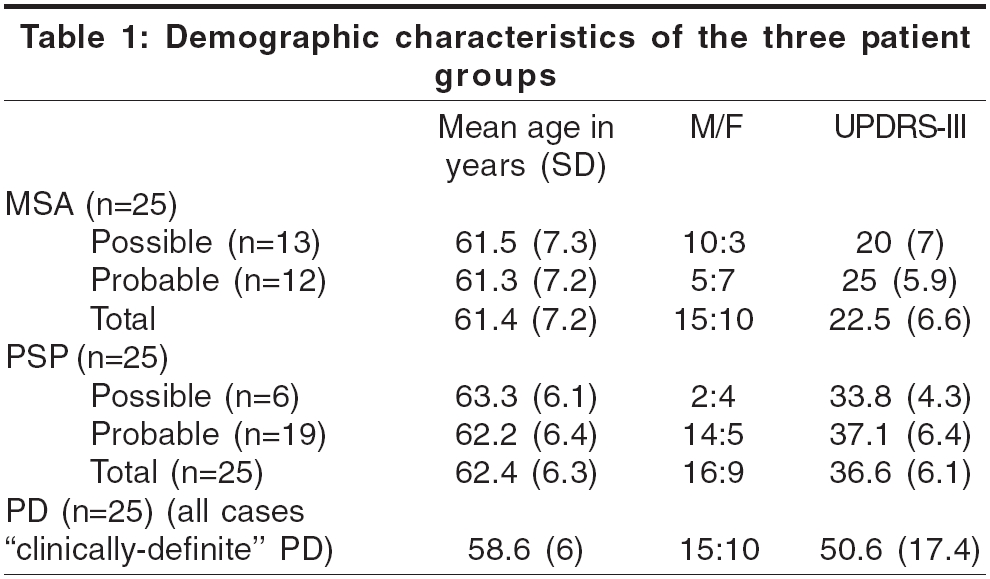
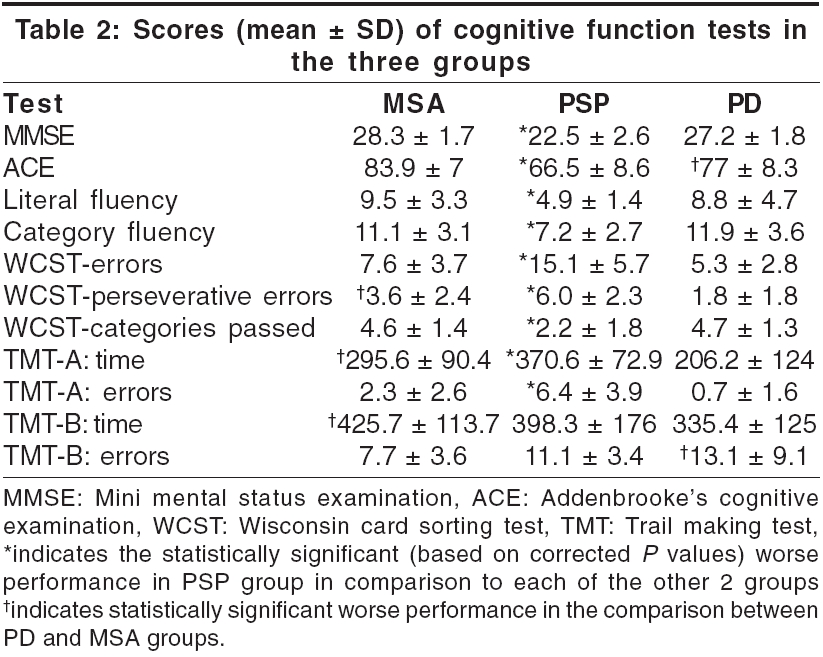
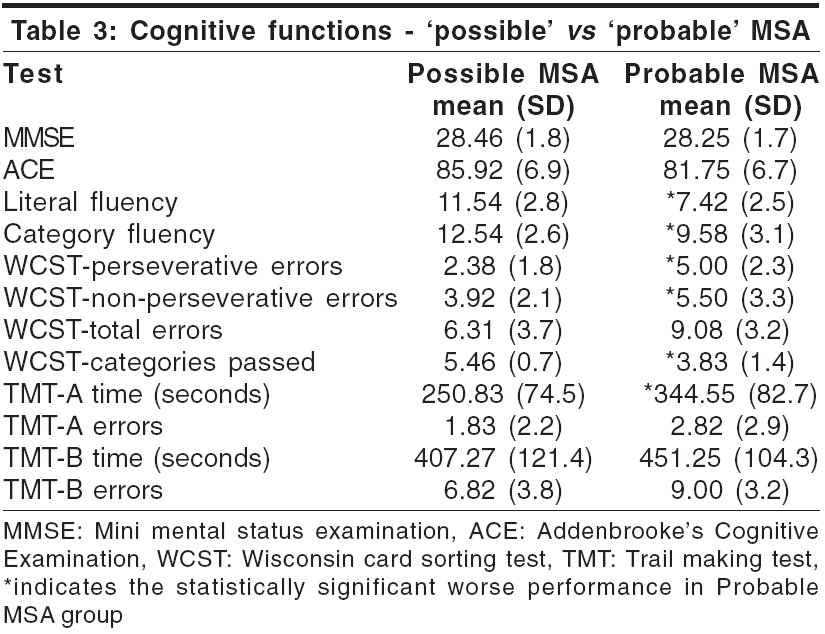
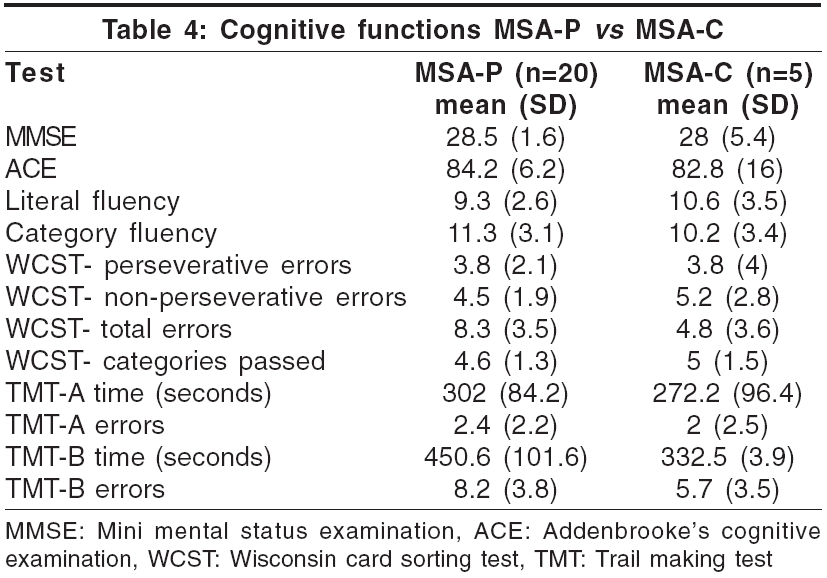
Neurology India, Vol. 54, No. 3, July-September, 2006, pp. 268-272 Original Article Neuropsychological functions in progressive supranuclear palsy, multiple system atrophy and Parkinson's disease Krishnan Syam, Mathuranath PS, Sarma Sankara, Kishore Asha Comprehensive Care Centre for Movement Disorders, Sree Chitra Tirunal Institute for Medical Sciences and Technology, Kerala - 695011 Date of Acceptance: 07-Jul-2006 Code Number: ni06087 Abstract Background: Few studies have compared cognitive functions in multiple system atrophy (MSA), progressive supranuclear palsy (PSP) and Parkinson's disease (PD). Keywords: Multiple system atrophy, neuropsychology, Parkinson′s disease, progressive supranuclear palsy Introduction Parkinsonism is the tetrad of rigidity, bradykinesia, tremor and impaired postural reflexes. Approximately 80-85% of patients with parkinsonism seen in movement disorder clinics have Parkinson′s disease (PD), while the rest belong to the categories of atypical parkinsonism and secondary parkinsonism.[1] Patients with parkinsonism and additional neurological features, which are atypical for PD, are classified as having ′Parkinsonism Plus′ syndromes or atypical parkinsonism. Progressive supranuclear palsy (PSP) and multiple system atrophy (MSA) are two relatively common forms of atypical parkinsonism encountered in movement disorders clinic. Diagnostic criteria for these entities have evolved to identify them with greater certainty during life.[2],[3],[4] Few studies have compared the pattern of cognitive dysfunction in atypical parkinsonian disorders with PD.[5],[6],[7],[8],[9] Earlier studies have reported that PD and MSA often have a similar subcortical pattern of cognitive impairment not amounting to dementia.[10],[11] In PSP, the striato-frontal dysfunction leads to dramatic deficits in planning, monitoring and recall, which evolves into dementia.[12],[13] In the studies done prior to the emergence of the current diagnostic criteria, patients with spinocerebellar degeneration were included in the MSA group.[14] In others, the MSA group consisted only of patients with strionigral degeneration (MSA-P type).[5],[6],[7] The relation of cognitive dysfunction to severity of parkinsonism in these diseases is not well established. It is also not known whether cognitive impairment is more frequent in MSA diagnosed with greater clinical diagnostic certainty using current criteria. The aim of the present study was to compare the profiles of cognitive functions in MSA (P and C types), PSP and PD cases that were diagnosed using current clinical criteria.Materials and Methods We conducted a prospective study to compare the cognitive function tests in 25 consecutive cases each of MSA, PSP and PD, recruited from the movement disorders clinic of the hospital during the period June 2003 to May 2005. MSA was diagnosed using the consensus diagnostic criteria,[2] PSP using the NINDS-SPSP criteria (National Institute of Neurological Diseases and Stroke - Society for progressive supranuclear palsy)[3] and PD using Calne′s criteria.[15] The MSA patients were subcategorized into two groups: MSA-P (′Parkinsonian′ type, where parkinsonism was the predominant manifestation; equivalent to the previous ′striato-nigral degeneration′) and MSA-C or the ′Cerebellar′ type (cerebellar dysfunction was the predominant manifestation). Patients with significant neurological or psychiatric comorbidity likely to confound the test results (history of strokes/severe depression/active psychosis) and advanced disease causing significant physical debility (making cooperation for neuropsychological testing difficult) were excluded. Depression was assessed using Beck′s depression inventory. All patients, along with the caretakers, underwent a detailed interview in all cases. A thorough neurological examination was done for all patients, including application of the UPDRS (Unified Parkinson′s Disease Rating Scale) subset-III (motor) in the "Off" state (off L-dopa/carbidopa), to assess the degree of parkinsonism.[17] Patients gave informed consent and the study was approved by the ethics committee of the hospital. Neuropsychological tests All patients were examined using a battery of neuropsychological tests, which consisted of Folstein′s mini mental status examination (MMSE);[17] Addenbrooke′s cognitive examination (ACE);[18] tests for fluency (initial letter fluency starting with the letter ′p′ and category fluency for animals - time 1 min); the Wisconsin card sorting test (WCST)[19] and the trail making test (TMT),[20] consisting of two parts - TMT-A and TMT-B. These verbal tests have been adapted in the local language and validated on the local population.[21] Standard test administration procedures for each of the tests were followed and although time taken to complete the test was recorded for TMT, none of the other tests were timed tests. Statistical analysis ANOVA was done for group comparisons followed by t-test for independent samples with Bonferroni correction. Pearson′s correlation test was done to assess the relation between severity of parkinsonism measured by UPDRS and the scores in cognitive function tests. Results Demographics [Table - 1]Clinical characteristics of MSA group (n = 25): Using the consensus diagnostic criteria for MSA, 12 of the patients (48%) were classified as ′Probable MSA,′ and 13 as ′Possible MSA′ (52%). MSA-P constituted the majority of cases of MSA (MSA-P = 20, MSA-C = 5). There was no autopsy-proven case of ′Definite MSA′ as all patients were alive during the course of the study. The average duration of symptoms was 3.3 years for the MSA group (SD 1.8). No patient or caregiver complained of cognitive disturbance in this group. Clinical characteristics of the PSP group (n = 25): Using NINDS-SPSP criteria, 19 patients (76%) were categorized as ′probable PSP.′ Six were categorized as ′possible PSP.′ No case came to autopsy during the study to diagnose ′definite PSP.′ The average duration of symptoms was 3.3 years (SD 1.9). Twenty-one patients (84%) had cognitive symptoms at the time of presentation while the remaining four patients and their caregivers denied symptoms of cognitive dysfunction. Caregivers of 20 patients gave history suggestive of frontal subcortical dysfunction (apathy, inertia and reduced social interactions) and memory problems were reported in 11 patients. Clinical characteristics of patients with PD: All cases belonged to ′clinically definite′ category. The mean duration of disease was 9.5 years (SD 6) and mean UPDRS-III score in ′off′ state was 53.2 (SD 3.7). Results of cognitive function tests: The mean age of the three groups did not show any significant difference (95% confidence interval [CI]: 58.4, 64.4; P = 0.1). The mean UPDRS III score was significantly different among the groups, being worst in PD (PD vs. PSP, 95% confidence interval [CI]: 6.27, 21.97; corrected and uncorrected P < 0.001. PD vs. MSA, 95% CI: 20.31, 36.01; corrected and uncorrected P < 0.001) followed by PSP and least in MSA (PSP vs. MSA, 95% CI: 6.19, 21.89; corrected and uncorrected P < 0.001) [Table - 2]. Tests for global cognitive functions 1. MMSE scores: The mean score of the PSP group was significantly worse than the MSA group (95% CI: 4.36, 7.32; corrected and uncorrected P < 0.001) and the PD group (95% CI: -6.24, -3.28; corrected and uncorrected P < 0.001). There was no significant difference between PD and MSA groups (95% CI: -.4, 2.56; uncorrected P = 0.03, corrected P = 0.2) 2. ACE total score: The mean score of the PSP group was significantly worse than both MSA group (95% CI: 11.79, 22.93; corrected and uncorrected P < 0.001) and the PD group (95% CI: -16.0, -4.87; uncorrected and corrected P < 0.001). The PD group performed significantly worse than MSA group (95% CI: 1.35, 12.49; uncorrected P = 0.003, corrected P = 0.01). Tests for frontal lobe functions 1. Tests for fluency: There was no statistically significant difference in the scores between the MSA and PD groups (95% CI: -1.67, 3.11; corrected P = 1, uncorrected P = 0.5) on the initial letter fluency task, while PSP group fared significantly worse than MSA group (95% CI: 2.21, 6.99; corrected and uncorrected P < 0.001) and PD group (95% CI: -6.27, -1.49; uncorrected P < 0.001, corrected P = 0.001). In the category fluency task also, there was no statistically significant difference between MSA and PD (95% CI: -3.08, 1.4; uncorrected P = 0.3, corrected P = 1), while the PSP group performed worse than MSA group (95% CI: 1.6, 6.08; corrected and uncorrected P < 0.001) and PD group (95% CI: -6.92, -2.44; corrected and uncorrected P < 0.001). 2. Wisconsin card sorting test: WCST scores were available for all patients with MSA, 23 patients with PSP (2 patients didn′t complete the test) and 21 patients with PD. PSP patients made more errors than MSA (95% CI: -6.75, -2.07; corrected and uncorrected P < 0.001) and PD groups (95% CI: 2.07, 6.75; corrected and uncorrected P < 0.001), passed fewer categories than both MSA (95% CI: 1.32, 3.52; corrected and uncorrected P < 0.001) and PD groups (95% CI: -3.65, -1.36; corrected and uncorrected P < 0.001) and made more perseverative errors than MSA (95% CI: -4.02, -0.79; uncorrected P < 0.001, corrected P = 0.002) and PD groups (95% CI: 2.55, 5.87; corrected and uncorrected P < 0.001). Comparison of the MSA and PD groups showed that the difference was not statistically significant for the number of categories passed (95% CI: -1.21, 1.04; P = 0.8) or for the total errors (95% CI: -.89, 5.40; uncorrected P = 0.02, corrected P = 0.7), but the perseverative errors were significantly more in the MSA group than PD group (95% CI: 0.13, 3.44; uncorrected P = 0.01 and corrected P = 0.03). 3. Trail making test: Twenty-three patients with MSA, 15 patients with PSP and 23 patients with PD completed the TMT-A. TMT-B was completed only by 19 patients with MSA, 6 patients with PSP and 22 patients with PD. The rest could not complete the test. Comparison of TMT-A showed that the performance of PSP group was not significantly worse than MSA (95% CI: -157.76, 7.73; uncorrected P = 0.01, corrected P = 0.08) but was worse than PD group (95% CI: 81.7, 247.2; corrected and uncorrected P < 0.001) in the time taken to complete the test as well as the number of errors made (95% CI: -6.33, -1.86; corrected and uncorrected P < 0.001 for both MSA vs. PSP and PD vs. PSP, 95% CI: 3.38, 7.85). However, the MSA group fared worse than the PD group in the time taken (95% CI: 15.91, 162.9; uncorrected P = 0.008, corrected P = 0.01) but was similar in the number of errors made (95% CI: 0.46, 3.51; uncorrected P = 0.02, corrected P = 0.1). Comparison of the results of TMT-Part B between PSP and the other two groups was not made as only a small number (6) of the patients with PSP could complete the test. Comparing the MSA group and the PD group, it was found that the performance of MSA group was significantly worse than PD group with respect to the time taken to perform the test (95% CI: 8.72, 190.27; uncorrected P = 0.02, corrected P = 0.05), but patients with PD made more errors (95% CI: -10.73, -0.7; uncorrected P = 0.02, corrected P = 0.04). Comparison of possible PSP and probable PSP cases Comparison between the results of possible PSP and probable PSP was not attempted because of the small sample size of the possible PSP group. Comparison of possible MSA with probable MSA Comparison of possible MSA with probable MSA showed that there was no statistically significant difference between the two groups [Table - 3], with regard to the MMSE (95% CI: -1.269, 1.69; P = 0.7) and ACE scores (95% CI: -1.49, 9.56; P = 0.1). But the Possible MSA group did significantly better in the tasks of literal fluency (95% CI: 1.86, 6.37; P = 0.001) and category fluency (95% CI: 0.57, 5.33; P = 0.01). The performance of the possible MSA group on WCST was also clearly better, committing a significantly lesser number of perseverative errors (95% CI: -4.38, -0.84; P = 0.006) and passing a significantly more number of categories (95% CI: 0.668, 2.58; P = 0.002). There was also a trend towards statistical significance with regard to the total number of errors (95% CI: -5.69, 0.14; P = 0.06). Similarly, for the trail making test-part A, the time taken by the possible MSA group to finish the task was significantly lesser compared to the probable MSA group (95% CI: -161.88, -25.526; P = 0.009). The possible MSA group performed lesser number of errors compared to the probable group, but this did not reach statistical significance. For trail making test-part B, the time taken to perform the test, as well as the number of errors made, was lesser for the possible MSA group. But the difference did not reach statistical significance. There was no statistically significant difference in the mean UPDRS-III scores between possible and probable MSA. Comparison between MSA-P and MSA-C Comparison between the neuropsychological test result profiles of MSA-P and MSA-C was not attempted as the number of MSA-C cases was too small (only 5, data in [Table - 4]). Correlation between UPDRS and scores in tests of cognitive functions There was a significant negative correlation between the UPDRS -III scores and scores in cognitive function tests in the MSA group (MMSE - r = 0.5, P = 0.005; ACE - r = 0.5, P = 0.005; WCST - total r = 0.5, P = 0.003; WCST errors - r = 0.5, P = 0.003; perseverative errors - r = 0.6, P < 0.001); TMT-A errors - r = 0.4, P = 0.02, time r = 0.4, P = 0.04; TMT-B errors - r = 0.3, P = 0.1, time r = 0.4, P = 0.08). Discussion Our study compared the results of cognitive function tests in patients with the atypical parkinsonian syndromes of MSA and PSP with PD. The three groups of parkinsonism did not differ significantly in the mean age at study, but the severity of parkinsonism was worst in PD, followed by PSP and least in MSA. The mean durations of illness of the PSP and MSA were similar but longer for the PD group. Previous studies in PD[21],[22] and MSA have found no correlation between the extent of cognitive impairment and disease duration.[5],[6],[7]In our study, the cognitive function tests of patients with PSP showed the worst performance, both in global cognitive functions as well as in tests sensitive to frontal lobe functions. This is similar to previous studies.[5],[6],[7],[8] In addition, we found that the cognitive dysfunction in PSP did not correlate with the severity of parkinsonism. The PD group showed worse scores in cognitive functions compared to the MSA group in tests of global cognitive function. A significant degree of cognitive dysfunction is reported only in around 2% of patients with MSA,[24] while it is around 30-40% in PD.[25],[26],[27] However, using tests more sensitive to frontal lobe functions, we found that MSA patients had greater impairment than PD patients in some of the domains (WCST - perseverative errors; time in trail making tests A and B). In our study, the cases of MSA with more severe parkinsonism showed worse performance in cognitive functions even though such a relation did not exist either in the PSP or PD groups. Comparison of the cognitive functions between PD and MSA by Robbins et al showed results similar to ours.[5] In contrast, Pillion et al observed that the dysexecutive syndrome of MSA and PD were similar in severity .[6] The difference in selection criteria, smaller numbers and much milder disease in PD make the comparison with the latter study difficult. The authors attributed the similar severity of cognitive dysfunction of PD and MSA (in spite of the more severe striatal and nigral pathology of MSA) to the relative sparing of the caudate in their group of SND at the stage of the disease when they were examined. We also examined whether the executive dysfunction of MSA was worse in cases with more extensive disease. We found that the global cognitive functions as assessed by the MMSE and ACE scores did not differ significantly between the possible and probable MSA groups. But tests sensitive to frontal lobe functions detected significantly worse performance in the ′probable′ MSA group. This explains why frontal executive dysfunction may be missed in early stages of the disease. MSA-P patients constituted 80% of our MSA cases; the rest had MSA-C. This frequency of subtypes of MSA is comparable to previous reports.[2],[23] A comparison between the cognitive functions of subtypes couldn′t be made because of this disproportionate distribution of our MSA cases. Similarly, a comparison could not be attempted in the PSP group because of the small number of ′possible′ PSP cases. Even though nigrostriatal pathology is common to the three diseases that we compared, it is more extensive in PSP and MSA, involving both the nigroputaminal projections, which are predominantly motor in function and the nigrocaudate projections involved in cognitive processing. In PD, the primary pathology is in the midbrain, while it is more widespread in PSP and MSA-P. In PSP, additionally, there is frontotemporal atrophy and severe pallidal, subthalamic and thalamic pathology. MSA-P is characterized by severe putaminal and milder degree of caudate neuronal degeneration and relatively less involvement of the pallidum. The neuropathological differences among the three conditions may explain the variable degree of dysfunction in the fronto-striatal cognitive circuits in them. In conclusion, using an identical battery of tests to evaluate global cognitive functions and specific tests for frontal lobe functions, we found different degrees of cognitive impairment in PSP, MSA and PD cases diagnosed using current clinical criteria. Both global and frontal dysfunctions were most severe in PSP and did not correlate with the severity of parkinsonism in these patients. While performance in global function tests of MSA was better than PD, tests specific for frontal dysfunction revealed more impairment in MSA, particularly in the clinically probable group and in those with more severe parkinsonism. The small number of cases in the MSA subgroups limits our study and hence, these results need to be examined in a larger series of such cases[28]. References
Copyright 2006 - Neurology India The following images related to this document are available:Photo images[ni06087t2.jpg] [ni06087t1.jpg] [ni06087t4.jpg] [ni06087t3.jpg] |
| |||||||||