 |
| About Bioline | All Journals | Testimonials | Membership | News |
|
||||||
|
||||||
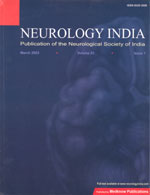
Neurology India, Vol. 57, No. 4, July-August, 2009, pp. 501-504 Letter To Editor Imaging of spontaneous neuromagnetic activity in a patient with internal carotid artery stenosis Shinichi Sakamoto1,2, Naohiro Tsuyuguchi2, Wataru Ide1, Ikuo Hashimoto1, Hajime Kamada1, Hiroaki Tanaka3, Kensuke Sekihara4, Kenji Ohata2 1Departments of Neurosurgery, Hokuto Hospital, Obihiro,
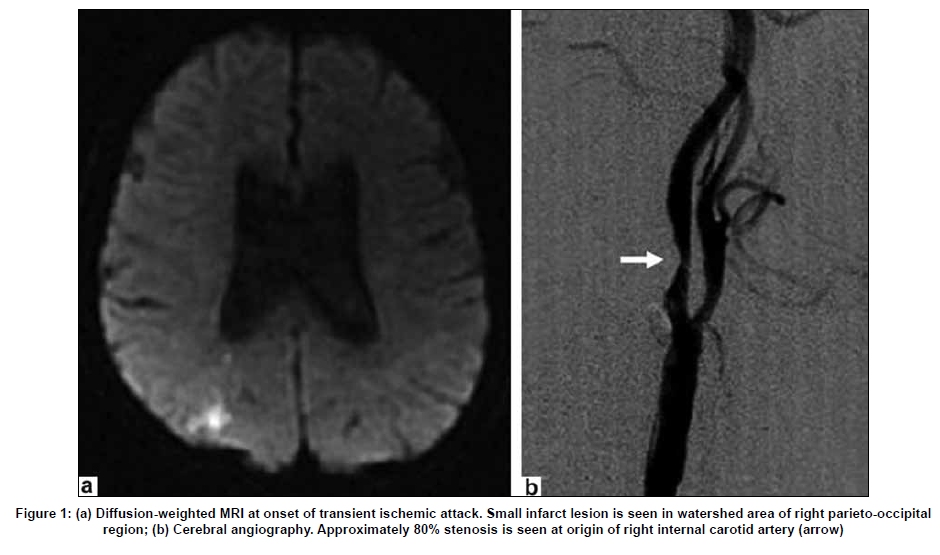
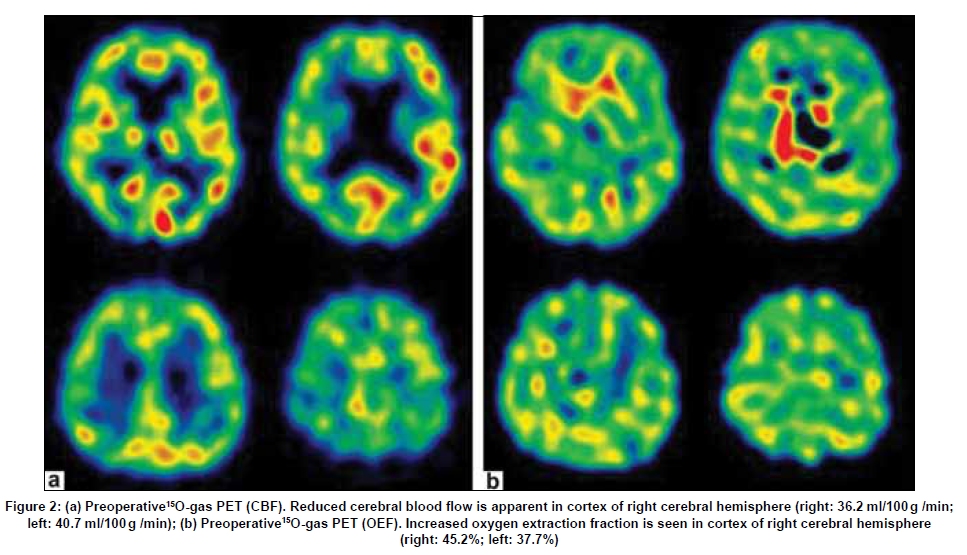
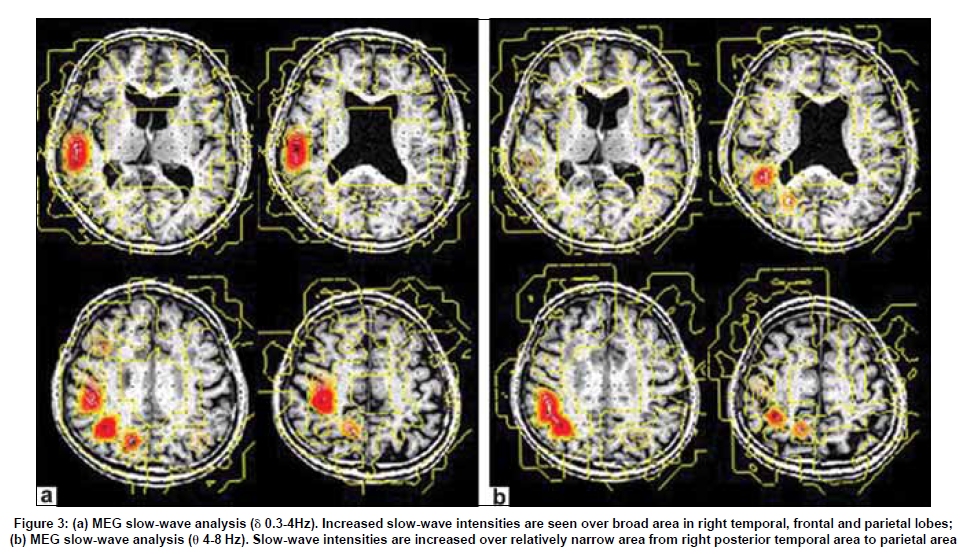
Correspondence Address: Department of Neurosurgery, Hokuto Hospital, Obihiro, Japan, s-sakamoto@med.osaka-cu.ac.jp Date of Acceptance: 09-Jan-2009 Code Number: ni09142 PMID: 19770561 DOI: 10.4103/0028-3886.55584 Sir, Magnetoencephalography (MEG) is beginning to be applied clinically because this technique allows direct capture of cerebral neural activity and resolves the problem associated with low spatial resolution of electroencephalography (EEG). The present study measured spontaneous cerebral magnetic fields using a whole-head-type MEG system, and used frequency analysis to attempt imaging of cerebral ischemic areas. A 76-year-old man suffered a ischemic attack resulting in left hemiparesis, and brain magnetic resonance imaging (MRI) confirmed a small infarct in the watershed area of the right parieto-occipital region [Figure - 1]a. Cerebral angiography confirmed approximately 80% stenosis at the origin of the right internal carotid artery [Figure - 1]b. Positron emission tomography by the 15 O gas inhalation (steady-state) method ( 15 O gas PET) confirmed a decrease in cerebral blood flow (CBF) in the region of the right middle cerebral artery (right 36.2ml/100g /min; left 40.7ml/100g /min) [Figure - 2]a and increased oxygen extraction fraction (OEF) (right 45.2%; left 37.7%) [Figure - 2]b. The patient was thus diagnosed to have reduced CBF and metabolism reserve (misery perfusion) in the right middle cerebral artery region. Using a 160-channel whole-head-type gradiometer (MEG vision PQ1160C; Yokogawa, Kanazawa, Japan), [1] MEG was performed to measure spontaneous cerebral neuromagnetic activities. Slow-wave component analysis was performed using an adaptive beamformer, which provided a kind of spatial filtration. [2] At a sampling frequency of 500Hz, a DC-200Hz bandpass filter and a 50-Hz notch filter were used; 150-s data were analyzed in terms of δ waves (0.3-4Hz) and θ waves (4-8Hz). Asymmetrical slow-wave distributions in the cerebral cortex within 3 cm of the brain surface were superimposed onto preoperative cerebral MRI scans. MEG showed that the distribution of δ waves was broad from the right frontal area to the parietal area in the ipsilateral cerebral hemisphere corresponding to ischemic areas as confirmed by PET [Figure - 3]a, while the distribution of θ waves was relatively localized from the posterior temporal area to the parietal area in the ipsilateral cerebral hemisphere [Figure - 3]b. Studies on slow-wave distributions as assessed by MEG have been previously conducted. [3,4] These studies surmised that δ wave distributions are seen around the cerebral infarction, while θ waves are in a relatively localized area irrespective of the extent of ischemia. However, in the past, slow-wave analysis was performed by comparing raw data or estimating equivalent current dipoles (ECDs), and such techniques are not suited to estimating ischemic areas beyond a certain volume in the brain, and imaging has not been necessarily clear. We addressed this problem by using the adaptive beamformer method, which allows reconstruction of cerebral activity sources with high spatial resolution without limits to numbers. [2] The results of the present study suggest that cerebral magnetic field frequency analysis using MEG has the potential to identify the area of cerebral ischemia and may represent a useful technique for visualizing the ischemic penumbra. [5] Future investigations of differences between δ and θ wave distributions will be necessary in greater numbers of patients. References
Copyright 2009 - Neurology India The following images related to this document are available:Photo images[ni09142f2.jpg] [ni09142f3.jpg] [ni09142f1.jpg] |
| |||||||||