 |
| About Bioline | All Journals | Testimonials | Membership | News |
|
||||||
|
||||||
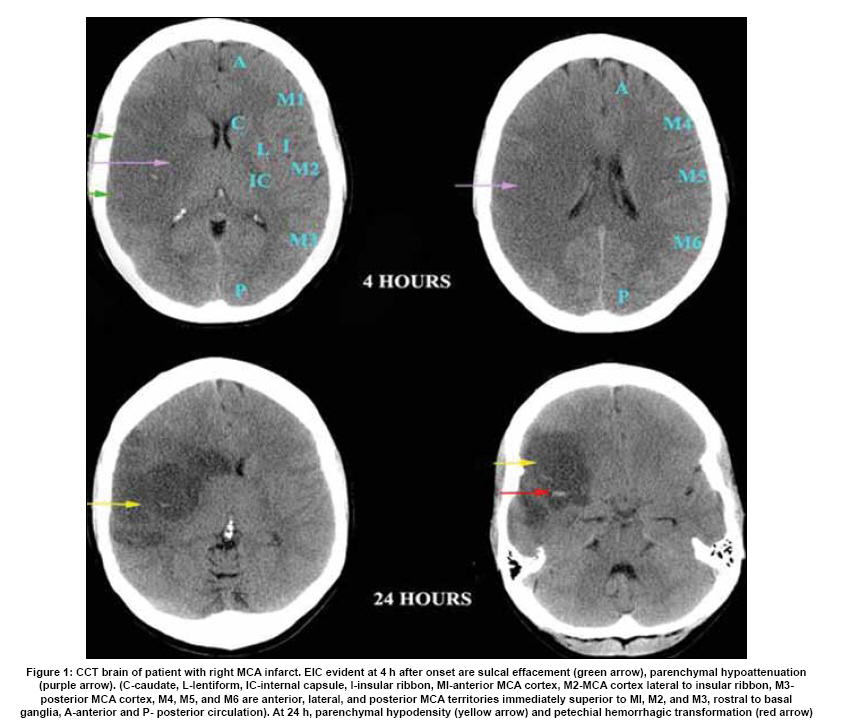
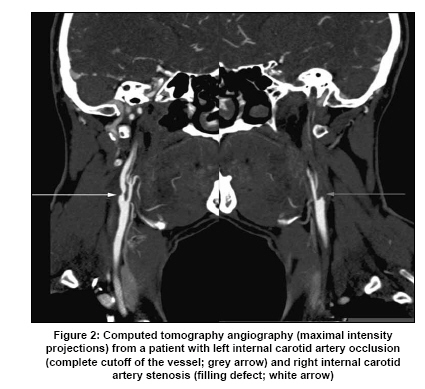
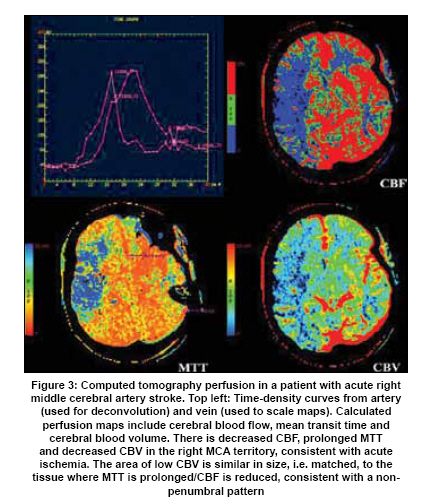
Neurology India, Vol. 57, No. 5, September-October, 2009, pp. 541-549 Review Article Advanced imaging in acute stroke management-Part I: Computed tomographic Monica Saini, Ken Butcher Stroke Unit, Division of Neurology, University of Alberta, Canada Date of Acceptance: 09-Aug-2009 Code Number: ni09162 PMID: 19934551 DOI: 10.4103/0028-3886.57791 Abstract Neuroimaging is fundamental to stroke diagnosis and management. Non-contrast computed tomography (NCCT) has been the primary imaging modality utilized for this purpose for almost four decades. Although NCCT does permit identification of intracranial hemorrhage and parenchymal ischemic changes, insights into blood vessel patency and cerebral perfusion are limited. Advances in reperfusion strategies have made identification of potentially salvageable brain tissue a more practical concern. Advances in CT technology now permit identification of acute and chronic arterial lesions, as well as cerebral blood flow deficits. This review outlines principles of advanced CT image acquisition and its utility in acute stroke management.Keywords: Computed tomography, computed tomographic angiography, hemorrhagic stroke, ischemic stroke, perfusion computed tomography Introduction Imaging of the brain parenchyma is critical to differentiate hemorrhagic stroke from ischemic stroke and also to rule out other structural causes which can present as stroke mimics. In the early 1970s, computed tomographic (CT) scanners made their appearance and have since become the main diagnostic tool in acute stroke. [1] Recent advances in CT technology provide the means to differentiate salvageable from the irreversibly damaged brain tissue and also to identify pathphysiological mechanisms (vascular occlusion or stenosis) of stroke. Thrombolysis trials make it clear that rapid diagnosis, with minimal delay in treatment is essential. [2] Although advanced CT imaging does add to the total imaging time, the ability to visualize markers of the ischemic penumbra may permit more patientand pathophysiology-specific treatment. The Ischemic Penumbra In acute ischemic stroke, arterial occlusion results in a reduction in cerebral blood flow (CBF). The reduction in CBF varies regionally, within the distribution of the affected artery. The ischemic penumbra was first described as that tissue between an upper CBF threshold of electrical silence and a lower flow threshold of ion pump failure resulting in loss of cellular membrane integrity. [3] In simpler terms, the penumbra is the hypoperfused, hypoxic tissue that is structurally intact, at risk of infarction but potentially salvageable with early reperfusion. Tissue which is irreversibly injured is referred to as the infarct core. With increasing time to reperfusion, the infarct core expands to include the penumbral tissue. Neurological outcomes after stroke correlate with penumbral tissue salvage; the current therapeutic strategies for acute stroke are, therefore, aimed at preservation of penumbral tissue and arresting its transition to infarction. The ideal imaging technique should be able to distinguish patients with penumbra, who will benefit from recanalization, from those who do not have salvageable tissue, and may indeed be at risk for hemorrhage following thrombolytic therapy. Imaging the Parenchyma: Non-contrast Computed Tomography Early ischemic changes (EIC) in brain parenchyma seen on non-contrast CT (NCCT) include focal swelling (sulcal effacement) and hypoattenuation. [4] We define hypoattenuation as loss of differentiation of the grey matter from adjacent white matter, and hypodensity as decrease in tissue density below that of normal white matter [Figure - 1]. The sensitivity of NCCT for ischemia is time-dependent; in the first 3 h, it is less than 50% and increases to 80-90% at 6 h. [5],[6] For the diagnosis of lacunar infarcts within the first 6 h, the sensitivity is less than 50%. [7] There is evidence that ischemic changes influence the response to reperfusion therapy, probability of hemorrhagic transformation and the clinical outcome after stroke. [8],[9],[10] The European Cooperative Acute Stroke Study (ECASS) trials first utilized the extent of early ischemic changes on CT as exclusion criteria for thrombolytic therapy. [11] Results from the ECASS I trial showed that focal hypodensity, as seen on baseline CT, was associated with early stroke progression (neurological deterioration within first 24 h of stroke onset). [12] Retrospective analysis of ECASS data showed that in patients with evidence of hypoattenuation involving < 33% middle cerebral artery (MCA) territory early intravenous activated tissue plasminogen (IV-tPA) had a therapeutic benefit. In patients with hypoattenuation in > 33% of the MCA territory, however, IV-tPA was associated with an increased risk of hemorrhage and no therapeutic benefit. [11] Based on this data, the ECASS investigators formulated the "one-third MCA" rule, which was used to define major infarction (hypoattenuation or cerebral edema involving > 33% of the MCA territory); patients with CT changes of major infarction did not qualify for thrombolysis. The Alberta Stroke Program Early CT Score (ASPECTS) is a validated scale useful for assessing the extent of ischemic changes within the MCA territory [Figure - 1]. [13] It is a negative ordinal scale which scores normal brain as "10" and those with ischemic changes in the entire MCA territory as "0". ASPECTS provides a formalized and systematic approach for the quantification of acute CT scans for ischemic changes. The inter-rater agreement is satisfactory, especially when used by experienced stroke neurologists, and the sensitivity for detection of early ischemic changes is higher than that of the one-third rule. [14],[15] Another potential advantage of ASPECTS in providing prognostic information, is that it gives equal weight to both larger volumes and smaller, but functionally important sub-cortical structures including basal ganglia and the internal capsule. NCCT does not permit optimal evaluation of the posterior circulation (PC) ischemic stroke. A version of the ASPECT score has been developed for assessment of the posterior circulation (PC-ASPECTS). This is also a negative ordinal scale that allots 10 points to the posterior circulation (2 points are allotted to the midbrain and pons, and 1 each to left or right thalamus, cerebellum or occipital cortex). In contrast to the MCA territory ASPECT score, the sensitivity of PC-ASPECTS for identification of EIC on NCCT is less than 50% and the score does not correlate with stroke outcome in patients with vertebrobasilar ischemia or basilar artery occlusion. [16] Assessment of NCCT scans using ASPECTS in the National Institute of Neurological Disorders and Stroke NINDS dataset showed that baseline ischemic changes did not have a treatment-modifying effect within the 3 h time window. [17] Other studies have indicated that the extent of ischemic changes on CT do predict the response to thrombolysis administered more than 3 h after symptom onset. Dichotomization of the ASPECT scores to ≤7 or> 7, in patients imaged more than 3 h after symptom onset, appears to have some prognostic value. A score of> 7 is predictive of improved outcome following thrombolysis, while patients with scores ≤7 have a higher risk of hemorrhagic transformation and are less likely to benefit from treatment. [8],[9],[17] The risk of hemorrhagic transformation is also dependent on time to imaging and the extent of reperfusion, making it impossible to predict on the basis of CT changes alone. While ASPECT scores and the one-third MCA rule do not distinguish between hypoattenuation and swelling, the pathophysiological substrate underlying these changes is clearly different. [18] Comparison of early ischemic changes on CT with magnetic resonance imaging/positron emission tomography (MRI/PET) studies reveals that hypoattenuated areas have decreased cerebral blood volume, restricted diffusion, increased tissue water content, and are destined to infarct. [19],[20],[21] Isolated focal swelling or sulcal effacement, has been shown to represent a compensatory increase in cerebral blood volume (CBV). It can therefore be viewed as a marker of penumbral tissue, although it is not observed frequently enough to be relied upon as a treatment selection tool. Conversely, tissue with isolated sulcal effacement and no hypoattenuation is metabolically active and potentially salvageable with reperfusion therapies. [18],[21],[22] Despite its shortcomings, NCCT imaging is still the most widely used modality for selection of patients for reperfusion therapy. It has the advantages of wide availability, short acquisition time and a high sensitivity for identification of intracranial hemorrhage. NCCT demonstrates areas of irreversible infarction, but in most cases provides little insight into the presence or extent of penumbral tissue. Fortunately, more advanced CT- based imaging techniques can be used to gain additional pathophysiological information. Imaging Blood Vessels: Computed Tomographic Angiography Computed tomographic angiography (CTA) utilizes spiral CT in combination with IV iodinated contrast to evaluate the head and neck vessels. It is noninvasive, permits rapid assessment of cerebral vessels, and can be done in conjunction with NCCT or even CT perfusion. Multi-detector helical scanners have decreased scanning times and radiation exposure, minimizing the risk of this procedure. Thin section imaging is performed during intravascular passage of a bolus of contrast media. The quality of imaging is dependent on patient physiology, contrast injection parameters and scan acquisition time. The amount of contrast used can vary depending on patient physiology (weight, hemodynamic parameters, contrast excretion) and the scan time. [23] Typically, 100- 140 ml of iodinated contrast (140 to 350 mg/ml) is used. Lower volumes of contrast and/or lower concentration (isosmolar) contrast can also be used in patients with renal impairment. [24] For adequate vascular opacification, contrast is administered intravenously as a rapid bolus infusion. The optimum bolus shape (vascular density versus time, at a region of interest) is a rapid rise, plateau of peak enhancement, followed by a rapid fall. Use of a bolus-chaser (saline injection following contrast bolus) or novel injector techniques e.g. exponentially decelerated injection method, provide near-optimal bolus shape. [25] The optimal timing of scan acquisition following contrast bolus may be identified using test-bolus injections or bolus-triggered scanning can be used to maximize image quality. [26] CTA rapidly permits an accurate assessment of the extracranial and intracranial vasculature. A combined aortic arch to cranial vertex protocol can image the entire cerebrovascular axis within 15 sec. [27] This protocol will often identify acute occlusions resulting in ischemic stroke and also provide etiological information, including potential proximal embolic sources (atheromatous lesions, arterial dissection, aneurysms and thrombi). The accuracy of identifying large vessel occlusion and $50% stenosis is greater than 95%. [28] Smaller intracranial vessel occlusion or stenosis, including those arteries beyond the second division of the MCA, are less reliably visualized. [28] Thrombi in large vessels are identified as irregular filling defects on CTA, which may be complete (i.e. no flow) or partial [Figure - 2]. Atherosclerotic plaques can be seen as luminal irregularity and stenosis or occlusion. [29] Delayed image acquisition can accurately distinguish critical stenosis from total occlusion by identifying streak/hairline-flow, which is critical in determining the need for surgical intervention. Though CTA source images can be used to identify vessel occlusions in most cases, short segment or partial occlusions may be missed, especially in areas of tortuous or overlapping vessels. Three-dimensional reconstruction provides high-resolution angiographic images of the vascular tree. Reconstruction requires additional time for post-acquisition processing, however. Maximum intensity projection (MIP) images in the axial, sagittal and coronal planes can be constructed from all pixels with the highest density at any point during the acquisition, forming a two-dimensional blood vessel image. A MIP image can be used to quickly identify abnormalities in the circle of Willis. However, MIP images can be obscured by overlying high-density structures, like the base of skull or extensive vascular calcification and reference to the source images is recommended. [30] Heavy calcification in vessels can occasionally lead to inaccurate estimation of residual lumen diameter by CTA. [27] This is most relevant when assessing the extracranial internal carotid artery for stenosis. CTA source images (SI) can also provide information about the quality of the collateral circulation in acute ischemic stroke. The extent of perilesional intravascular enhancement is considered a surrogate marker for the leptomeningeal collateral flow and areas with a low CBV appear unenhanced. [31] Patients with good collateral circulation, as assessed on CTA-SI, have better clinical outcomes than those with poor collaterals. [32] It has also been demonstrated that ASPECTS can be applied to CTA-SI (regions with relatively decreased contrast enhancement are scored as abnormal). [33],[34] Low ASPECT scores on CTA-SI predict final infarct volume more accurately than NCCT ASPECTS. [34] Lesions on CTA-SI have also been shown to have excellent correlation with regions of restricted diffusion on MRI DWI (diffusion weighted imaging). [33],[34] Thus, CTA-SI can be used to rapidly estimate the extent of the ischemic core in the acute setting. Imaging Cerebral Blood Flow: Computed Tomographic Perfusion Using standard non-ionic iodinated contrast, the transit of a bolus of intravenous media can be traced by its serial effect on X-ray hypoattenuation. [35] Following a contrast bolus (40-50 ml of iodinated contrast), one or multiple CT slices are acquired at fixed time intervals. The change in signal intensity, measured in Hounsfield units, after contrast media injection is proportional to the density of tissue and therefore the concentration of contrast at each time point. In this way, time density curves can be generated for each voxel. Maps of perfusion can then be derived from the tissue-time density curve, based on the central volume principle. Maps of regional (r) CBV, CBF, time to peak (TTP) and mean transit time (MTT) can be generated from the tissue-time density curves [Figure - 3]. CBF is proportional to the amplitude of the curve and CBV to the area under the curve. MTT, which is prolonged in ischemia, can be estimated as a ratio of CBV/CBF. As the relationship between iodinated contrast density and concentration is linear, quantitative flow estimates are possible, which is a theoretical advantage over current MRI-based perfusion techniques. Quantitative measures of flow are obtained by scaling relative values on a voxel-wise basis to the intensity obtained from a voxel at the centre of the superior sagittal venous sinus (in which the partial volume effect is absent, and is assumed to give a CBV value of 104 ml/100 g). [35] Inaccuracies in flow estimation result from contrast delay and dispersion. Deconvolution of the parenchymal time-concentration curves, using a reference arterial input curve can be performed in order to provide a mathematical approximation of the effect of an instantaneous injection of contrast. [36] Using deconvolution, CTP measures of CBF are in agreement with flow values obtained with PET. [37] CTA and CTP sequences can be performed immediately following NCCT, adding only few minutes to the total exam time. The information provided by multimodal CT imaging in acute stroke patients demonstrates excellent correlation with the data obtained from MRI studies. [38] The multimodal stroke assessment using CT (MOSAIC) score is a combination of ASPECTS and information provided by CTA and CTP (CBF assessed in two slices). [39] In comparison to single CT components, it shows a superior correlation with the final infarct volume and clinical outcome. [39] The Boston Acute Stroke Imaging Scale for classification of acute ischemic stroke utilizes CTA (or magnetic resonance angiography, MRA) and the evaluation of cerebral parenchyma by NCCT (or MRI). It is superior to NCCT-ASPECTS alone in identifying patients with a high likelihood of a poor outcome. [40] The Mismatch Hypothesis Advanced CT imaging techniques can provide visual representations of both tissue at risk and irreversibly injured infarct core regions. By combining these images, it is therefore also possible to develop an operational definition of the ischemic penumbra. An imbalance in the volume of hypoperfused versus core infarct tissue is referred to as a 'mismatch' pattern, the presence of which may theoretically indicate an enriched response to tissue salvage therapies, in particular thrombolysis. Computed tomography perfusion-defined mismatch CT perfusion-derived TTP, Tmax, MTT and CBF maps all demonstrate hypoperfused areas at risk for infarction. Ischemic core tissue can be demonstrated using NCCT (hypoattenuation) or with CBV maps. Areas of low CBV represent irreversibly injured tissue, where compensatory vasodilatation in response to oligemia has failed. The ischemic penumbra is therefore represented by tissue where MTT is prolonged, and CBF is decreased, but CBV is normal (CBF-CBV mismatch or MTT-CBV mismatch). [41] The mismatch between MTT and CBV abnormalities on CTP correlates well with MRI-based penumbral definitions. [42] Refinements to the mismatch hypothesis have been made using CT perfusion thresholds. Penumbral and infarct regions have been identified on the basis of MTT and CBV thresholds. Wintermark et al., defined ischemic areas as those with MTT prolongation greater than 145% of the normal contralateral hemisphere and infarct core as tissue with rCBV < 2 ml/100 g. [41] The optimal mismatch definitions and perfusion deficit thresholds are still unknown, as they likely vary with the duration of ischemia. [43] However, the use of CTP with thresholds provides a more accurate estimate of penumbra and the final infarct volume compared to CTA-SI. [44] It has also been demonstrated that ASPECTS scores can be applied to CT perfusion images, providing a semi-quantitative estimate of penumbral tissue volume and also predicting neurological improvement. [45] Ct Based Imaging Based Prediction of t pa0 Related Bleeding Risk Intracerebral hemorrhage is the most feared complication of rtPA use in acute stroke and is associated with worse clinical outcome and elevated mortality rates. [46] Identification of predictors of intracranial hemorrhage (ICH) following thrombolytic therapy is necessary for safe implementation of thrombolysis. ICH following thrombolytic therapy has been classified as hemorrhagic transformation (HT), defined as petechiae which may or may not be within the ischemic lesion, and parenchymal hemorrhage (PH), which refers to a hematoma with space-occupying effect. [47] HT is thought to be a marker of reperfusion into ischemic tissue with microvascular damage, without any adverse clinical impact. [48] However, one retrospective study has indicated that HT may have some adverse effects. [49] This subject requires further prospective studies, in large patient populations. Most thrombolysis studies have defined symptomatic ICH as any sign of hemorrhage on post-treatment imaging (36 h to one week) associated with clinical deterioration, indicated by an increase of 4 points or more on the NIHSS scale. [50],[51] In the NINDS trials, extensive cerebral edema (ischemic changes in more than one-third MCA) present on baseline CT scans was seen more frequently in patients with ICH (9% vs. 4% in whole of the remainder of study population). [52] Another post-hoc CT analysis of the NINDS data, however, showed that, after adjustment for the baseline NIHSS, early ischemic changes (loss of grey/white matter distinction, hypoattenuation, hypodensity, compression of CSF Cerebrospinal fluid spaces) were not associated with "symptomatic" ICH. [53] An analysis of baseline CTs in the European-Australian Acute Stroke Study (ECASS) II study showed that patients with ASPECTS score ≤7 have a higher risk of PH after thrombolytic therapy (rTPA within a 6 h time window), relative to those with scores > 7. [8],[9] Tanne et al., evaluated data from 1205 patients, thrombolysed within 6 h of stroke onset and found that the severity of early ischemic changes predicted the risk of developing parenchymal hematomas following treatment. [54] Whether the extent of early ischemic changes on CT justifies exclusion of patients from thrombolysis is still debatable. While both hypoattenuation and swelling are included in early ischemic changes, the pathophysiological substrate underlying these changes is not the same, and may have a differential effect on the risk of hemorrhage. Hemorrhagic transformation, both spontaneous and tPA related, remains difficult to predict. It is unlikely that any single imaging parameter will reliably predict hemorrhagic risk. This is because symptomatic hemorrhage occurs in relatively few patients, even in the tPA-treated population (5-8%). [55],[56] In addition, the development of hemorrhage is most certainly multifactorial, being dependent not only on the extent of parenchymal changes, but also on reperfusion, hypertension, glycemic control and other uncharacterized susceptibility differences that vary between individual patients. [57],[58] Advanced Imaging in Intracerebral Hemorrhage CT remains the imaging modality of choice to diagnose intracerebral bleeds in most clinical settings. Acute blood is readily identifiable on CT as areas of hyperdensity, with or without surrounding edema. Following the acute phase, the blood constituents are metabolized and reabsorbed. In the chronic phase, hemorrhage cannot be differentiated from ischemic lesions as only a hypodense cavity remains as a marker of the preceding lesion. Computed tomographic angiography and intracerebral hemorrhage CTA has a high sensitivity and specificity for the identification of a source (AVMarteriovnous malformation/aneurysm) of secondary parenchymal ICH or subarachnoid bleeds. For aneurysms > 2 mm in size, the sensitivity is ~ 95%; for smaller aneurysms the sensitivity is approximately 50%. [10],[59] Occasionally, infundibular dilatation of an artery origin may be incorrectly identified as an aneurysm. [60] Although DSA(digital subtraction angiography) provides superior information on blood flow patterns and visualization of small vessels, CTA is cost-effective and can be easily performed immediately following NCCT in the acute setting. Contrast extravasation on contrast-enhanced CT or CTA (source images) has been shown to be an independent predictor of hematoma expansion and mortality following ICH. [61],[62] The CTA (source images) "spot sign", defined as small foci of enhancement within a parenchymal hematoma, has been observed in 30-50% of patients imaged within 3 h of onset of spontaneous ICH (sICH). [63],[64] It is absent in patients with secondary ICH, and may be specific for sICH. However, calcific deposits, thrombosed aneurysm or micro-arteriovenous malformation and tumor can be potentially confounding mimics of the spot sign. [65] Increased blood-brain barrier permeability, has recently been shown to be a predictor of hemorrhage following thrombolysis. In a rat model of stroke, early parenchymal enhancement (gadolinium MRI) was found to predict hemorrhage following reperfusion. [66] Lin et al., used PCTperfusion CT to evaluate microvascular permeability in patients with acute ischemic stroke. Patients showing increased permeability in the ischemic areas were more likely to develop petechial hemorrhages (non-thrombolyzed patients) and parenchymal hematomas (thrombolysed patients). [67] Presence of early parenchymal enhancement on post-thrombolytic (,2 h) contrast-enhanced MRI has also been shown to predict hemorrhagic transformation. [68],[69] At present, NCCT remains the imaging modality of choice for thrombolysis patient selection in most centers. Advanced CT techniques do have some disadvantages, including increased radiation exposure, contrast-related complications, low sensitivity for lacunar/small deep infarcts [ 70] and limited brain coverage. Increased radiation dosage and contrast-related complications are a consideration when using advanced CT imaging techniques. Depending on scan parameters used, radiation doses of 5-10 mSv are used for a multimodal CT exam, making multiple examinations less desirable. Contrast-related renal complications are now not very frequent (3.3%), and are mostly limited to mild reversible nephropathy. An important limitation of current scanners is the limited sampling volume, but this is improving. Most scanners currently in operation have columnation widths of 1-4 cm. Thus, it is possible that areas of hypoperfusion may not be recognized in acute stroke patients imaged with this technique. Newer scanners, using 256 detector rows, have been developed that provide up to 8 cm of coverage and permit simultaneous CTA acquisition using a single bolus of contrast media. CTA and CTP are under-utilized in our opinion; they do increase the diagnostic yield substantially over NCCT alone and can be performed with minimal delay. Advanced CT imaging should be utilized more both in clinical practice and future clinical stroke trials. In the second part of this series, the utility of MRI in acute stroke management will be examined. References
Copyright 2009 - Neurology India The following images related to this document are available:Photo images[ni09162f3.jpg] [ni09162f2.jpg] [ni09162f1.jpg] |
| |||||||||