 |
| About Bioline | All Journals | Testimonials | Membership | News |
|
||||||
|
||||||
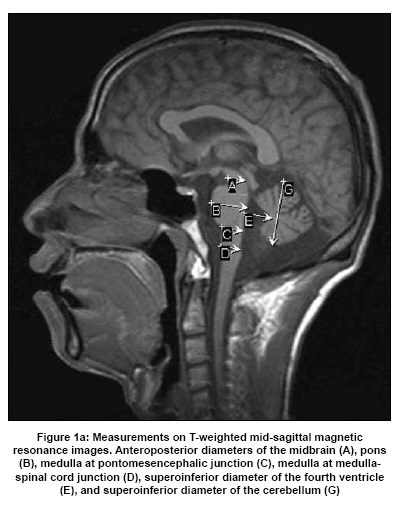
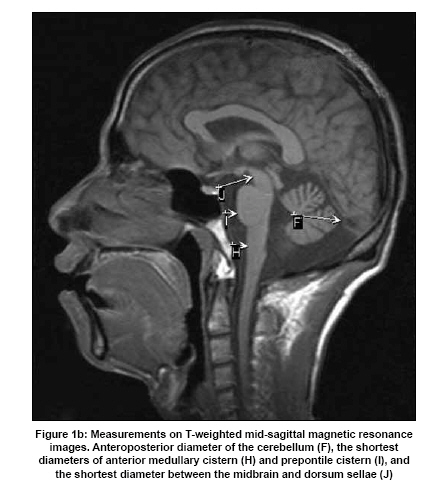
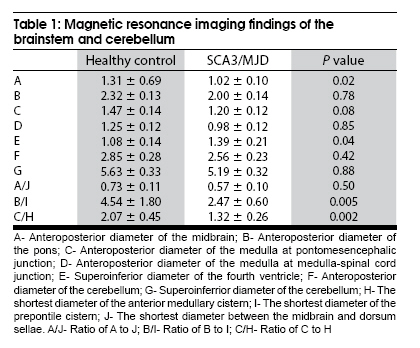
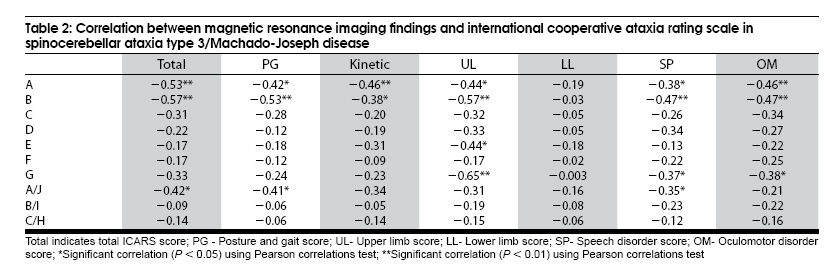
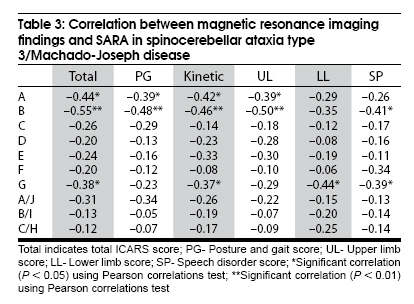
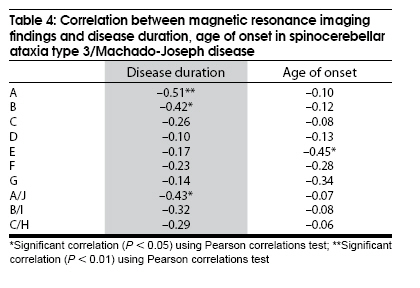
Neurology India, Vol. 57, No. 5, September-October, 2009, pp. 578-583 Original Article The correlation between magnetic resonance imaging features of the brainstem and cerebellum and clinical features of spinocerebellar ataxia 3/Machado-Joseph disease Liang Xiaochun1,3 , Jiang Hong1,2 , Chen Changqing3 , Zhou Gaofeng3 , Wang Junling1 , Zhang Shen1 , Lei Liwang1 , Wang Xiaoyi 3 , Tang Beisha1,2,4 1 Departments of Neurology, Xiangya Hospital, Date of Acceptance: 02-Jul-2009 Code Number: ni09166 PMID: 19934555 DOI: 10.4103/0028-3886.57803 Abstract Background : Brainstem and cerebellar atrophy are the most important features in magnetic resonance imaging (MRI) in spinocerebellar ataxia type 3/Machado-Joseph disease (SCA3/MJD). However, the correlation between brainstem and cerebellar atrophy and the clinical features has not been well studied.Aim : To study the correlation between MRI features of the brainstem and cerebellum and predominant clinical features in SCA3/MJD. Design and Setting : University teaching hospital. Patients and Methods : By using the linear measurement method, we assessed 32 patients with SCA3/MJD to study the correlations between the morphometric data of the brainstem and cerebellum and clinical features: Duration of the disease, age of onset, total international cooperative ataxia rating scale (ICARS) score; total scale for the assessment and rating of ataxia (SARA) score; ICARS subscores, and SARA subscores. Statistical Analysis : Pearson correlation test. Results : There was a significant invese correlation between anteroposterior diameter of the midbrain and pons and total ICARS scores, total SARA scores, ICARS and SARA subscores (r= -0.381~-0.57, P < 0.05 or 0.01) and disease duration (r=- 0.42~-0.51, P < 0.05 or 0.01). Additionally, superoinferior diameter of the cerebellum was inversely correlated with total SARA scores and ICARS and SARA subscores except for ataxia of posture and gait in both scales (r=- 0.37~-0.44, P < 0.05). The superoinferior diameter of the fourth ventricle was inversely correlated with age of onset (r=-0.45, P < 0.05). Conclusion : The effect on the cerebellum and brainstem is related to predominant clinical features in SCA3/MJD patients. Keywords: Clinical feature, correlation, magnetic resonance imaging, spinocerebellar ataxia type 3/Machado-Joseph disease Introduction Spinocerebellar ataxias (SCAs) are a group of inherited neurodegenerative disorders with clinical heterogeneity. [1],[2] Worldwide spinocerebellar ataxia type 3, also known as Machado-Joseph disease (SCA3/MJD), is the most common SCA subtype. In China the reported frequency of SCA3/MJD is about 50% of SCAs. [3] The disease-causing gene MJD1 has been mapped to chromosome 14q32.1. [4] The molecular basis of SCA3/MJD is an uns and expanded (CAG) n trinucleotide repeat within the coding region of the MJD1 gene, ranging from 45 to 86 repeats (normal is less than 47). [5] Clinically, SCA3/MJD is characterized principally by cerebellar ataxia and also nystagmus, dysarthria, pyramidal and extrapyramidal signs and peripheral neuropathy at variable frequency. [6] Morphological changes of the brain associated with various neurodegenerative disorders can best be studied in vivo with magnetic resonance imaging (MRI). The most important MRI feature in SCAs is brainstem and/ or cerebellar atrophy. [7],[8],[9],[10] Previous studies in patients with SCA3/MJD have shown a close correlation between brainstem and cerebellum atrophy and CAG trinucleotide repeat lengths. [11],[12],[13] Till date there are no studies correlating brainstem and cerebellum atrophy and the clinical features in SCA3/MJD. By using the linear measurement method, we assessed 32 patients with SCA3/MJD to study the correlations between the morphometric data of the brainstem and cerebellum and clinical features. Patients and Methods Patients Thirty-two patients with SCA3/MJD (16 males and 16 females; mean age, 39.91 ± 7.38 years; age range, 20-58 years) and 36 healthy control (16 male and 20 female subjects; mean age, 36.53 ± 10.18 years; age range, 25-64 years), matched by age, sex and handedness were recruited for the study from the Neurodegenerative Disorders clinic, Xiangya Hospital, Central South University, China between December 2005 and October 2007. The diagnosis of SCA3/MJD was based on genetic studies and neurological findings, Harding criteria. [14] All patients were individually interviewed and examined clinically to evaluate the neurological status. Ataxia was assessed quantitatively using international cooperative ataxia rating scale (ICARS) and scale for the assessment and rating of ataxia (SARA). [15],[16] The CAG trinucleotide repeat length in each patient was identified by a genetic diagnosis of the MJD1 gene. Patients with a significant medical, neurological or psychiatric disorder and tumors, and also patients with contraindications for MRI examination were excluded from the study. The study has the approval by the Ethics Committee of the Xiangya Hospital, Central South University, China. Informed consent was obtained from all the patients and control subjects to participate in the study. Magnetic resonance imaging scan Brain MRI scan were done on a Siemens Sonata 1.5-tesla whole body MR scanner, using a circularly polarized head coil (Siemens Medical Systems, Erlangen, Germany). The MRI protocol included axial, sagittal and coronal T 1 -weighted series, and axial T 2 -weighted series. Axial, sagittal, and coronal T 1 -weighted images of the entire brain were taken using spin-echo sequence with the following technical parameters: 450/10 (TR/TE), a field of view of 26 cm, an imaging matrix of 256 x 256, 6 mm slice thickness and 1.5 mm gap with sagittal and coronal images, 5 mm slice thickness, and 1.5 mm gap with axial images. Axial T 2 -weighted images were acquired through the entire brain by using a fast spin-echo sequence with parameters of 4200/98 (TR/TE), a field of view of 24 cm, an imaging matrix of 256 x 256, 5 mm slice thickness and a 1.5 mm gap. Linear measurements Measurements were performed separately by three neuroradiologists and they were blinded to the clinical details. Anteroposterior diameters of the midbrain (A), pons (B), and medulla (C and D), superoinferior diameter of the fourth ventricle (E), and anteroposterior and superoinferior diameters of the cerebellum (F and G), were measured on T 1 -weighted mid-sagittal images [Figure - 1a]. The shortest diameter of anterior medullary cistern (H) and prepontine cistern (I) and the shortest diameter between the midbrain and dorsum sellae (J) were also measured on T 1 -weighted mid-sagittal images [Figure - 1b]. We also calculated ratios of A/J, B/I, and C/H. Statistical analysis Independent sample t-test using SPSS for Windows 13.0 (SPSS, Chicago, IL) was performed for the morphometric data differences between patients in the SCA3/MJD group and the control subjects. Pearson correlations test was employed to assess the correlation between CAG trinucleotide repeat lengths and the following: Total ICARS scores, total SARA scores, ICARS and SARA subscores and the ratios of individual morphometric data of the brainstem and cerebellum to age of the patients. Then, we used Pearson correlations test to assess the correlation between the morphometric data of the brainstem and cerebellum and total ICARS scores, total SARA scores, ICARS and SARA subscores, disease duration and the patient's age of onset. Results CAG trinucleotide repeat lengths In patients with SCA3/MJD, CAG trinucleotide repeat length ranged from 65 to 77, with a mean of 71.84 (SD = 2.61) and there was a good correlation between CAG trinucleotide repeat length and kinetic function scores on SARA scale (r = 0.36, P< 0.05) and morphometric measurement C (r = 0.38, P < 0.05), E (r = 0.45, P 5 0.01), F (r = 0.45, P < 0.01), and G (r = 0.39, P < 0.05). Categorical comparison The categorical comparison of morphometric data between the patients and control subjects showed a pattern of atrophy of the cerebellum and whole brainstem [Table - 1]. Anteroposterior diameter of the midbrain, superoinferior diameter of the fourth ventricle, the ratios B/I and C/H were significantly different in patients with SCA3/MJD when compared to control subjects (P< 0.05). Unlike the midbrain and the fourth ventricle, anteroposterior diameters of the pons and medulla, anteroposterior and superoinferrior diameters of the cerebellum and the ratio A/J were not significantly different in patients with SCA3/MJD (P 5 0.50). Discrimination between patients with SCA3/MJD and healthy controls by A, B/I, C/H, E, showed higher sensitivity in B/I (90%) than in C/H (78%), E (75%) and A (72%); and higher specificity in A (100%) than in C/H and B/I (92%) and E (72%). Clinical correlation Clinical correlations for the primary clinical features, including ICARS scores, SARA scores, disease duration and age of onset are given in [Table - 2],[Table - 3],[Table - 4]. International cooperative ataxia rating scale The patients showed a phenotypic spectrum of cerebellar signs ranging from mild to moderate. Total ICARS scores ranged between 9 and 50 with a mean of 26.81 (SD = 10.82), posture and gait: Range = 3-28, mean = 11.23 (SD = 5.86); kinetic function: Range = 2-23, mean = 11.23 (SD = 5.00); speech disorder: Range = 0-5, mean = 2.06 (SD = 1.34); oculomotor disorder: Range = 1-6, mean = 2.26 (SD = 1.18). The anteroposterior diameters of the midbrain and pons showed a significant inverse correlation with total ICARS scores, scores of ataxia of posture and gait, kinetic functions , upper limb ataxia, speech disorders and oculomotor disorders (r = - 0.38~ - 0.57, P < 0.05 or 0.01) Additionally, the superoinferior diameter of the cerebellum was inversely correlated with scores of upper limb ataxia, speech disorders and oculomotor signs (r = - 0.37~ - 0.65, P < 0.05 or 0.01) [Table - 2]. Scale for the assessment and rating of ataxia The patients showed a phenotypic spectrum ranging from mild to moderate cerebellar signs with total scores ranging from 3 to 20 on the SARA with a mean of 9.44 (SD = 4.40); posture and gait: Range = 1-11, mean = 4.52 (SD = 2.29); kinetic function: Range = 1-7, mean = 3.21 (SD = 1.60); and speech disorder: Range = 0-4, mean = 1.71 (SD = 1.40). The anteroposterior diameters of the midbrain and pons showed a significant inverse correlation with total SARA scores, and scores of ataxia of posture and gait, kinetic functions , upper limb ataxia, speech disorders and oculomotor disorders (r = - 0.39~ - 0.55, P < 0.05 or 0.01). Additionally, the superoinferior diameter of the cerebellum was inversely correlated with total SARA scores and scores of kinetic functions, low limb ataxia, speech disorders and oculomotor signs (r = - 0.37~ - 0.44, P < 0.05) [Table - 3]. Disease duration and age of onset The disease duration ranged from 1 to 18 years with a mean of 4.81 (SD = 3.63), whereas the age of onset ranged from 17 to 47 years with a mean of 34.88 (SD = 6.64). The anteroposterior diameters of the midbrain and pons and the ratio of A/J were inversely correlated with disease duration years (r = - 0.42~ - 0.51, P , 0.05 or 0.01). Moreover, the superoinferior diameter of the fourth ventricle was inversely correlated with age of onset (r = - 0.45, P < 0.05) [Table - 4]. Case examples A 58-year-old man started to stagger at the age of 40. Neurological deficits progressed slowly over the following 18 years. Gait and stance abnormalities, limb and truncal ataxia, dysarthria, gaze-evoked optokinetic nystagmus, dysphagia, muscle fasciculations, and peripheral neuropathy were clinical features observed. Ataxia was quantitatively assessed by ICARS and SARA, total scores (48; 17.5), posture and gait scores (24; 9) kinetic function scores (17; 4.5), upper limb scores (8; 3), lower limb scores (9; 1.5), speech disorders scores (5; 4) and oculomotor disorders scores (2). The morphometric data of the brainstem and cerebellum was obtained by linear measurement method: A (0.9 cm), B (2.0 cm), C (1.2 cm), D (1.0 cm), E (1.7 cm), F (2.4 cm), G (5.3 cm), H (1.1 cm), I (1.3 cm), J (2.2 cm), A/J (0.4), B/I (1.5), C/H (1.1). Discussion The characteristic MRI findings observed in patients with SCA3/MJD were atrophy of the cerebellum and whole brainstem and marked dilatation of the fourth ventricle, similar to the observation in the other MRI studies. [11],[12],[13] Particularly the anteroposterior diameter of the midbrain and B/I, the most characteristic feature, showed the highest specificity and sensitivity in differentiating patients with SCA3/MJD from healthy controls. Previous MRI studies have shown that atrophy of the superior cerebellar peduncle as a characteristic feature of SCA3/MJD. [11],[17] Taken together, these observations suggest that the characteristic MRI feature in SCA3/MJD is the atrophy of the afferent and efferent system of the cerebellum. Cerebellar and brainstem atrophy also occurr in SCA1 and SCA2, [9] significant cerebellar atrophy in SCA6 and brainstem atrophy in SCA7; [7],[10] but caudate and putamen volumes were reduced only in patients with SCA3/MJD. [9] Thus in SCA3/MJD the focus should be on the degeneration of the extrapyramidal motor system. The diagnosis of SCA3/MJD based on clinical assessment has limited accuracy; however, MRI evaluation may be helpful in the diagnosis of SCA3/MJD and may also show the significant differences in the pattern and extent of the morphological alteration in SCA3/MJD and other SCAs. This study identified three specific clinical-morphological correlations between age of onset of the disease, duration of the symptoms, ataxia symptoms and atrophy of the cerebellum and/or brainstem. In our study, the anteroposterior diameters of the midbrain and pons showed significant inverse correlation with total ICARS and SARA scores and subscores. The superoinferior diameter of the cerebellum was inversely correlated with total SARA scores. These results suggest a good correlation between the severity of ataxia symptoms and the extent of brainstem and cerebellar atrophy in patients with SCA3/MJD, especially those with mesencephalic and pontine atrophy. Similar were the findings in our magnetic resonance spectroscopy (MRS) and diffusion tensor imaging (DTI) studies (unpublished observation), confirming that the cerebellum and its afferent and efferent systems are mainly affected in SCA3/MJD. [17] Neuropathological studies in SCA3/MJD also showed neuronal loss and gliosis in the cerebellum and brainstem, especially in the midbrain and pons. [18] MRI and voxel-based morphometry (VBM) studies in patients with other types of SCAs have also document similar observations. [19],[20],[ 21] All these observations suggest that the effect on the brainstem and/or cerebellum is quantitatively associated with the ataxia symptoms of SCAs. Additionally, anteroposterior diameters of the midbrain and pons showed a significant inverse correlation with disease duration, suggesting that the duration of this disease accounts for the extent of the mesencephalic and pontine atrophy, especially that of the midbrain. Similar results were found in a VBM study in patients with SCA17 [20] thus establishing the time dependency of the pathological changes. Moreover, pathological changes in afferent and efferent systems of the cerebellum may begin at a later age than at the onset of the disease and have distinct effects on the primary clinical symptoms in SCA3/MJD. These conclusion were in agreement with our previous MRS and DTI studies, thus confirming the importance of the cerebellar afferent and efferent systems on the evolution of the clinical features. The superoinferior diameter of the fourth ventricle was inversely correlated with the age of onset, suggesting that the extent of cerebellar atrophy affected the age of onset of SCA3/MJD. Though the diameters of the cerebellum studied were inconsistent with ataxia symptoms and age of onset, none of the diameters were related to disease duration. These observations may suggest that the rate of progression in the affected cerebellar system is not associated with disease development, and the effects in different subregions of the cerebellar system account for different clinical features. Taken together, these observations reveal that the atrophy of the cerebellar system can be detected before the age of onset and atrophy of the afferent and efferent systems after the age of onset, emphasizing the sequence of pathological changes in the cerebellum and brainstem. Furthermore, this study also suggests that pathological changes in different subregions of the cerebellum and brainstem result in the common clinical features of SCA3/MJD. Finally, our data demonstrate for the first time that severity of clinical symptoms reflected by the CAG trinucleotide repeat length [22] is significantly associated with age of onset and a reduction of volume in the cerebellum and brainstem. This highlights the interrelationship between genetic, clinical and morphological findings. That is, the pattern and extent of the morphological alteration in SCA3/MJD is determined by the CAG trinucleotide repeat length. Clinician can use CAG trinucleotide repeat length as a tool to evaluate the severity of clinical symptoms. A limitation of this study is that the MRI findings in the brainstem and cerebellum of SCA3/MJD patients, by the use of linear measurement method, are the only focus. Subsequent studies will assess whether the volume of gray matter and white matter can be correlated with the clinical features found in SCA3/MJD patients, applying voxel-based morphometry in a whole brain manner. In conclusion, this study illustrates the relationship between characteristic MRI findings in the cerebellum and brainstem, primary clinical features and the CAG trinucleotide repeat length, providing a better understanding of the pathophysiological basis of SCA3/MJD. Acknowledgment We thank all of the members of the families we studied and we are grateful to the physicians who cared for these families. This work was supported by series of grants including the National Science and Technology Pillar program in the Eleventh Five-year Plan Period (2006BAI05A07) (Dr. Tang); the National High-Tech Research and Development Program of China (863 Program) (2006AA02A408) (Dr. Tang); the Major State Basic Research Development Program of China (973 Program) (2006cb500700) (Dr. Tang); the National Key Technologies Research and Development Program of China (2004BA720A03) (Dr. Tang); the National Natural Science Foundation of China (30871354, 30971585, 30710303061, 30400262 and 30470619) (Dr. Jiang); Key Project in the Natural Science Foundation of Hunan Province (08JJ3048) (Dr. Jiang). References
Copyright 2009 - Neurology India The following images related to this document are available:Photo images[ni09166f1a.jpg] [ni09166t4.jpg] [ni09166f1b.jpg] [ni09166t1.jpg] [ni09166t3.jpg] [ni09166t2.jpg] |
| |||||||||