 |
| About Bioline | All Journals | Testimonials | Membership | News |
|
||||||
|
||||||
Neurology India, Vol. 58, No. 1, January-February, 2010, pp. 90-94 Brief Report Ischemic hyperintensities on T1-weighted magnetic resonance imaging of patients with stroke: New insights from susceptibility weighted imaging Neeraj N. Baheti, Ajith Cherian, Wattamwar P. R. Chandrasekharan Kesavadas1 , Bejoy Thomas1 Departments of Neurology, 1 Imaging Sciences and Interventional Radiology, Sree Chitra Tirunal Institute for Medical Sciences and Technology, Trivandrum - 695 011, India Correspondence Address: Dr. C. Kesavadas, Department of Imaging Sciences and Interventional Radiology, Sree Chitra Tirunal Institute for Medical Sciences and Technology, Trivandrum - 695 011, India, chandkesav@yahoo.com Date of Acceptance: 23-Oct-2009
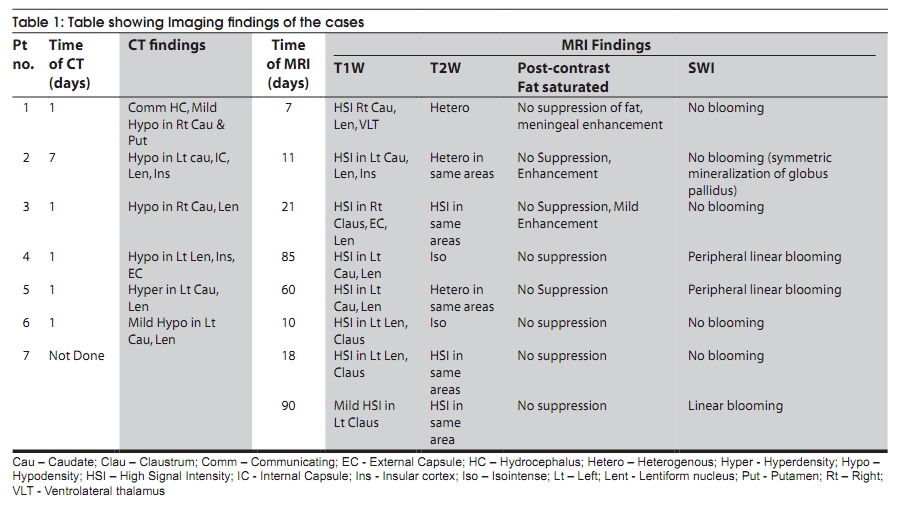
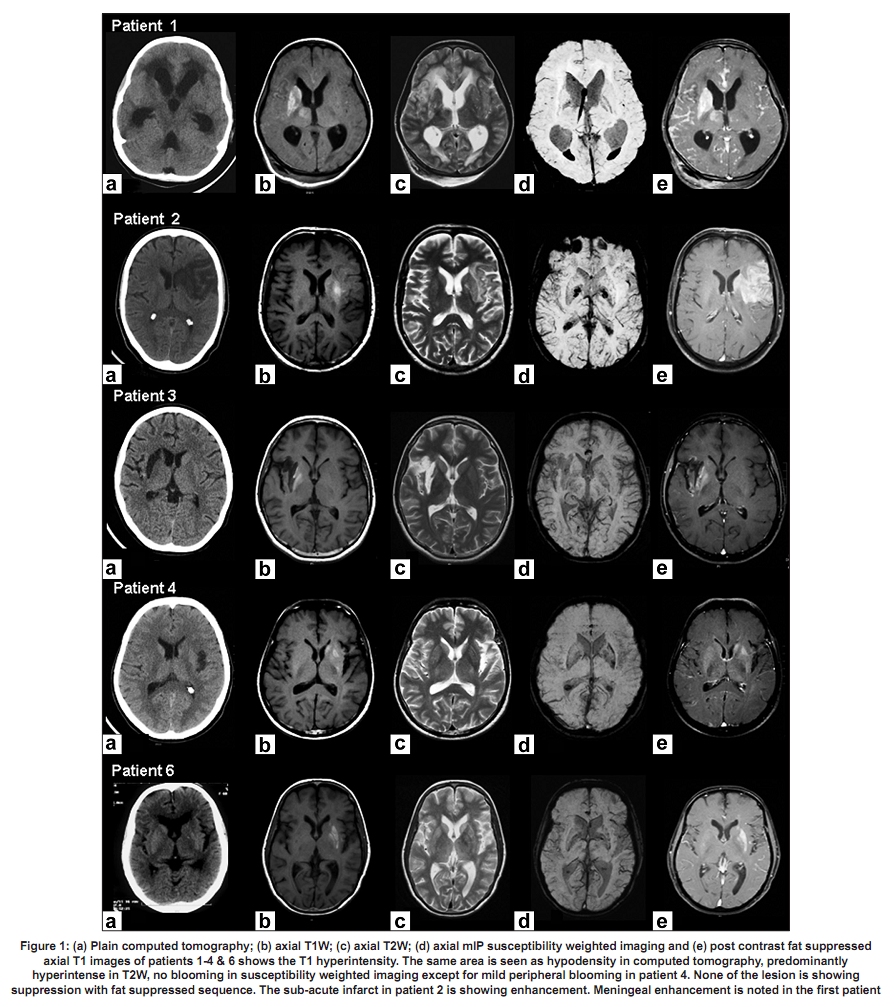
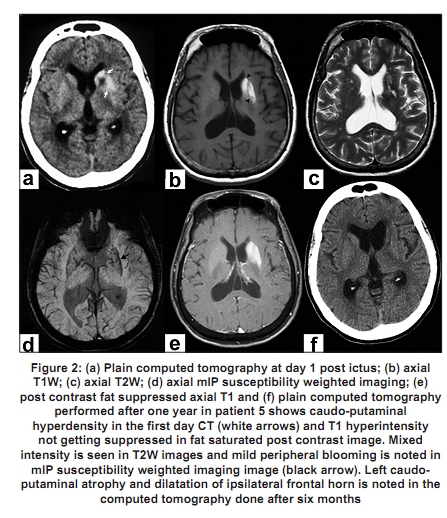
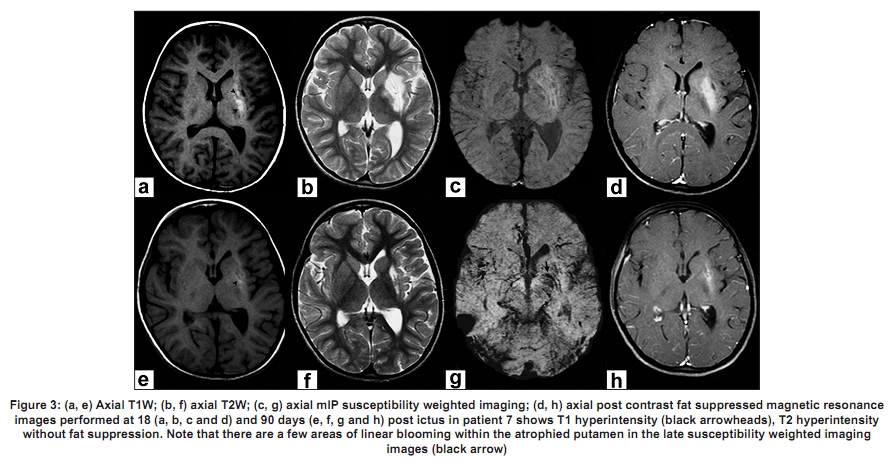
Code Number: ni10018 DOI: 10.4103/0028-3886.60408 Abstract Hyperintensities on T1-weighted magnetic resonance imaging (MRI) in the setting of brain ischemia are usually considered hemorrhagic transformations. Such changes can also be seen due to "incomplete infarction" with selective neuronal loss. Arguments regarding the cause of these T1 hyperintensities have shuttled between gemistocytic astrocyte accumulation, tissue calcification and paramagnetic substance deposition. Susceptibility weighted imaging (SWI), a sensitive modality for detecting paramagnetic agents and blood products, has never been used to resolve this issue. The study was aimed to evaluate the SWI signal changes of T1 hyperintense lesion in stroke patients and understand its usefulness in differentiating a hemorrhagic infarct and an incomplete infarct. All the seven patients with infarct, having hyperintensities on T1 weighted MR imaging seen over the last one year were subjected to SWI. In none of the patients SWI failed to show any blooming. By doing SWI for T1-weighted hyperintensities, we can differentiate hemorrhagic infarct and a non-hemorrhagic "incomplete infarct". This differentiation will immensely help in planning management strategy and prognostication.Keywords: Gemistocytic astrocyte, incomplete infarct, ischemic hyperintensities, microbleeds, Susceptibility weighted imaging, T1 weighted hyperintensity Introduction Hyperintensities on T1-weighted magnetic resonance imaging (MRI) in brain ischemia are usually considered as hemorrhagic transformations. However, such changes are also seen in "incomplete infarction" with selective neuronal loss. [1] These T1 hyperintensities are caused by mechanisms related to selective neuronal death in mild energy failure. [2] Arguments regarding the cause of ischemic T1 hyperintensities have shuttled between gemistocytic astrocyte accumulation, tissue calcification, lipid deposition and paramagnetic substance deposition. [3],[4],[5] Susceptibility-weighted imaging (SWI) is a newer MR imaging technique reported to be exquisitely sensitive to paramagnetic agents and blood products. Various investigators have described the technique and its applications in neurological diseases. [6] SWI has never been used to resolve this issue. The aim of the study was to evaluate the SWI signal changes of T1 hyperintense lesion in stroke patients and to understand its usefulness in differentiating a hemorrhagic infarct and an incomplete infarct. In this report, we describe our observations and discuss the various plausible mechanisms responsible for the observed findings. Materials and Methods All patients with ischemic infarct, having hyperintensities on T1 weighted MR imaging were subjected to SWI. Data acquisition and analysis All the patients underwent imaging with a 1.5 T super conducting MR imaging system (Avanto- SQ Engine; Siemens, Erlangen, Germany). MRI sequences included T1-weighted (T1W), T2-weighted, Fluid attenuated inversion recovery (FLAIR); diffusion weighted imaging, post contrast fat saturated axial, post contrast coronal and sagittal without fat suppression and SWI. SWI is a high resolution 3-D fully velocity compensated gradient echo sequence wherein the phase images are used to create a phase mask after unwrapping and high pass filter, which is then multiplied with the magnitude images to enhance the conspicuity of small veins and other paramagnetic substances. [7] The physics and mathematical principles of this technique and its applications are described in detail by various investigators. [6],[7],[8] The following imaging parameters were used for SWI in this study: TR, 48 ms; TE, 40 ms; flip angle, 208; bandwidth, 80 kHz; matrix size, 512 x 256, slice thickness, 2 mm, 56 slices in a single slab and iPAT factor, 2. The acquisition time was 2.58 min. After post processing 9-12 thick mIP (minimum intensity projection) slabs were generated. Results In the last one year we encountered seven patients with hyperintensities on T1 weighted MR imaging wherein SWI failed to show any blooming artifact. Clinical details Case no. 1: A 12 - year-old girl with tubercular meningitis on regular anti tubercular therapy and steroids. Three weeks later, she had worsening of sensorium and developed acute onset left hemiparesis. Case no. 2: A 61-year-old male admitted with acute onset right hemiplegia with global aphasia six days before admission. He had history of systemic hypertension and diabetes mellitus, both of which were well controlled. Blood glucose on admission was 151 mg/dl. Case No. 3: A 14 - year-old boy diagnosed as a case of nephrotic syndrome on steroids was admitted with acute onset left hemiparesis of three weeks duration. His evaluation for vasculitis and hypercoagulable state was negative. Case No. 4: A 53-year-old male came with a history of transient right hemiparesis two months back. He had a history of systemic hypertension and dyslipidemia, both of which were well controlled. Case No. 5: A 57 - year-old female presented with acute onset right hemiparesis of one-day duration. She had past history of poorly controlled diabetes mellitus. Blood glucose on admission was 342 mg/dl. Serum osmolality was 290 mosmol/L. Case No. 6: A 61-year-old female presented with acute onset right hemiparesis of one-day duration. She had past history of coronary artery disease and dyslipidemia, on regular medications. Case No. 7: A s ix-year-old girl presented with acute onset right hemiparesis and hemidystonia of two weeks duration. Evaluation for vasculitis and hypercoagulable state was negative. Imaging findings Computed tomography (CT) and MRI findings are as summarized in [Table - 1]. All patients underwent MR imaging in subacute to chronic period (range 11-90 days). Imaging features are shown in [Figure - 1],[Figure - 2],[Figure - 3]. The CT showed hyperdensity in one patient (case no. 5). Repeat CT imaging in this patient after six months showed complete resolution of caudo-putaminal hyperdensity [Figure - 2]. SWI failed to show blooming in four patients (case no. 1, 2, 3 and 6) whose MRI was done within one month and showed linear blooming at the periphery in three patients (case no. 4, 5 and 7) where SWI was done late. Furthermore, in case no. 7 the first SWI done in the sub-acute period failed to show any blooming and repeat SWI after three months showed linear peripheral blooming [Figure - 3]. Post contrast fat saturated axial and non fat saturated coronal and sagittal images showed meningeal enhancement due to meningitis in case no. 1 and enhancement of subacute infarct in case no. 2. No fat suppression was appreciated in any patient. Discussion The severity and duration of hypoxic injury determines the degree of injury. Severe and prolonged ischemia can result in wide spread damage and necrosis across the brain. Brief focal ischemia induces selective neuronal death and glial responses without tissue pannecrosis. [1],[2],[9],[10] These areas of "incomplete infarction" characteristically manifest with hyperintensities on T1 weighted MR imaging. Possible causative factors proposed are macromolecular hydration effect or surface relaxation mechanism (e.g., protein, lipid accumulation or calcification), lipid deposition and paramagnetic substance deposition (e.g., methemoglobin in hemorrhagic tissue, manganese, molecular oxygen, melanin, and metals such as iron, copper). [3] Aoe et al. [11] recently reproduced similar MR imaging findings in 29 rats after a 20-minute occlusion of cerebral arteries and disclosed the accumulation of fatty droplets in the activated microglia. Another study with high-resolution 1H-nuclear MR spectroscopy in biopsy specimens also showed a marked increase of lipids. [3] However, none of our cases showed suppression on post-contrast fat saturated images ruling out fat deposition. Still presence of non-significant microscopic fatty changes within the lesions can not be ruled out. The MR signal-intensity changes were restricted to the vascular territory of ischemia in all our cases hence distant glial reaction secondary to neuronal changes seems unlikely. Instead, direct ischemic insults are the most likely cause. All our patients were in subacute to chronic phase when imaging revealed T1 weighted hyperintensities. Fujioka et al. [2] reported similar delayed ischemic hyperintensities in the rat striatum at day seven after transient middle cerebral artery occlusion. Histologically, it corresponded to selective neuronal death and glial proliferation without infarct or hemorrhage. These gemistocytic astrocytes have protein hydration layer which shortens T1 relaxation, contributing to the T1 hyperintensity. Post-ischemic ultrastructural change in astrocyte cytoplasm (e.g., proliferation of mitochondria, rough endoplasmic reticulum, and vacuoles) also shortens the T1 relaxation times via surface relaxation mechanism. Absence of blooming on SWI rules out bleed and pathological manganese, iron and copper deposition. [6],[8],[12],[13] SWI failed to show blooming in all cases whose MRI was done within one month. It showed linear blooming at the periphery in three cases whose imaging was done late (60-90 days) after the ictus. Further, in one of these patients (case no. 7) SWI done in the first month was normal while it showed blooming at the end of three months. We hereby propose that at the gemistocytic astrocyte proliferation site, over a period there is reactive mineral deposition. Thus, the SWI findings of the lesion suggest incomplete infarction with gemistocytic astrocytosis. Also, similar gemistocytic astrocytosis with hyperintensity on T1 weighted MR imaging have been reported in hyperglycemic states manifesting as hemichorea. [14] One of our cases had uncontrolled diabetes mellitus with hyperglycemia at presentation but he had presented with focal deficit and did not have any abnormal movements. Hyperglycemia can aggravate hypoxia by decreasing regional cerebral blood due to increased vascular resistance. [15] In one of our cases, the CT scan showed hyperdensity involving same area still without any blooming on SWI, implying these ′incomplete infarcts′ can be variable iso to hyper dense on CT imaging probably depending on extent and severity of injury and local astrocytosis. The same patient underwent repeat CT imaging on follow-up after six months, which showed complete resolution, again a strong point against calcification, mineralisation and fat deposition. Our study has important limitations. None of our cases underwent tissue biopsy and hence we could not precisely elucidate what exactly these hyperintensities represent histologically. The best available evidence points towards incomplete infarction with gemistocytic astrocytosis. Also, one intriguing thing noted was these changes were seen only in basal ganglionic regions. In addition, none of our patients were evaluated during the window period of thrombolysis hence it will be very difficult to generalize the findings. Further studies with larger number of patients in different time frames after ictus and having pathological correlation are needed to clarify all these issues. Although similar T1-weighted hyperintensities are seen in cortical laminar necrosis, its location and settings are different. [16] In this era wherein post-thrombolysis imaging is repeated, more often than ever, one can come across high signal intensities on CT or T1 weighted MR imaging. Whenever one encounters such cases, SWI must be done to establish whether the hyperintensity is due to hemorrhage or incomplete infarction with gemistocytic astrocytosis. Differentiating between a hemorrhagic infarct and a non-hemorrhagic "infarct" is important for management strategy and prognostication. Our study proves the importance of thinking beyond the routine considerations for T1W hyperintensities in ischemic settings and reestablishes the great importance of SW imaging to differentiate hemorrhagic infarct from incomplete infarction with gemistocytic astrocytosis. References
Copyright 2010 - Neurology India The following images related to this document are available:Photo images[ni10018f2.jpg] [ni10018t1.jpg] [ni10018f3.jpg] [ni10018f1.jpg] |
| |||||||||