 |
| About Bioline | All Journals | Testimonials | Membership | News |
|
||||||
|
||||||
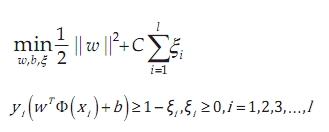
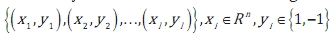
Neurology India, Vol. 58, No. 5, September-October, 2010, pp. 685-690 Original Article A new method to classify pathologic grades of astrocytomas based on magnetic resonance imaging appearances Zhong-Xin Zhao1, Kai Lan2, Jia-He Xiao3, Yu Zhang1, Peng Xu1, Lu Jia1, Min He1 1 Department of Neurosurgery, West China Hospital, Sichuan University, Chengdu Sichuan - 610 041, P.R., China Correspondence Address: Date of Acceptance: 24-Jun-2010 Code Number: ni10190 PMID: 21045488 DOI: 10.4103/0028-3886.72161 Abstract Background: Astrocytoma is the most common neuroepithelial neoplasm, and its grading greatly affects treatment and prognosis. Objective: According to relevant factors of astrocytoma, this study developed a support vector machine (SVM) model to predict the astrocytoma grades and compared the SVM prediction with the clinician's diagnostic performance. Patients and Methods: Patients were recruited from a cohort of astrocytoma patients in our hospital between January 2008 and April 2009. Among all astrocytoma patients, nine had grade I, 25 had grade II, 12 had grade III, and 60 had grade IV astrocytoma. An SVM model was constructed using radial basis kernel. The SVM model was trained with nine magnetic resonance (MR) features and one clinical parameter by fivefold cross-validation and differentiated astrocytomas of grades I-IV at two levels, respectively. The clinician also predicted the grade of astrocytoma. According to the two prediction methods above, the areas under receiving operating characteristics (ROC) curves to discriminate low- and high-grade groups, accuracies of high-grade grouping, overall accuracy, and overall kappa values were compared. Results: For SVM, the overall accuracy was 0.821 and the overall kappa value was 0.679; for clinicians, the overall accuracy was 0.651 and the overall kappa value was 0.466. The diagnostic performance of SVM is significantly better than clinician performance, with the exception of the low-grade group. Conclusions: The SVM model can provide useful information to help clinicians improve diagnostic performance when predicting astrocytoma grade based on MR images. Keywords: Astrocytoma, magnetic resonance imaging, pathology, support vector machine Introduction Astrocytomas are one of the most lethal and difficult to treat tumors among neuroepithelial neoplasms. [1] According to the 2007 World Health Organization (WHO) classification of tumors of the central nervous system, astrocytomas can be classified into grades I-IV. [2] Because exact grading was obtained by pathologists through examining tissue section slides, and malignancy grading of astrocytomas is fundamentally important due to its effects on accurate treatment planning and patient management, it is important to assess tumor grading before operation. [1],[3],[4],[5],[6] Today, pre-operative tumor grade prediction generally depends on imaging techniques such as magnetic resonance imaging (MRI), which is used to locate the position and extent of brain tumors. [7] Additionally, studies have shown that the MRI characteristics from astrocytomas of different grades have been documented in the radiologic literature, and the accuracy of access is dependent on edema, hemorrhage, cyst, and so on. [8],[9],[10] However, tumor staging is subjective, and its accuracy may be limited by the radiologist's experience. Therefore, we consider the application of some auxiliary methods, with the aim of improving the prediction of tumor grades. Support vector machine (SVM) modeling is a novel and useful classification method. As a cutting-edge algorithm, it maps input vector current space to higher dimensional space, and a separating hyperplane is found that transforms the set of data into linearly separable data. Recent researches have reported that SVM has a good performance. [10],[11],[12],[13],[14],[15] In this study, SVM was applied and compared with the predictions of clinical observers to determine whether SVM can help to predict astrocytoma grades. Patients and Methods Case selection In this study, patients were recruited from a cohort of astrocytoma patients in our hospital, between January 2008 and April 2009. Patients had to satisfy the following inclusion criteria: 1) new diagnosis of astrocytoma at our hospital; 2) clear pathologic grading (grades I-IV); and 3) complete pre-contrast T1-weighted images (T1WIs), T2-weighted images (T2WIs), and post-contrast T1WIs. Cases were excluded if their grades were overlapping, or if they had received previous radiation therapy. Database All astrocytoma patients were classified into four groups (WHO grades I-IV) according to the 2007 WHO classification of tumors of the central nervous system. In all patients, MRI was conducted with a 1.5-Tesla unit (TOSHIBA, Tokyo, Japan) and a 3.0-Tesla unit (GE Medical Systems, Milwaukee, WI, USA). For every recruited patient, pre-contrast and post-contrast T1WIs (TR, 380-523 ms; TE, 7-26 ms) and pre-contrast T2WIs (TR, 3500-5659 ms; TE, 82-113 ms) were collected. Other MRI parameters were set to a 256 Χ 192 or 256 matrix, a 200 Χ 230-mm field of view (FOV), and a 5-mm slice thickness. Gadopentate dimeglumine (Magnevist, Berlex, Cedar Knolls, New Jersey) at 0.1 mmol/kg body weight was administered intravenously for post-contrast MRI. As described in [Figure - 1], a neuroradiologist without the knowledge of pathologic results reviewed the images independently and scored 10 parameters: one clinical parameter (age) and nine MRI characteristics (signal intensity on T1W imaging, signal intensity on T2W imaging, contrast enhancement, edema, location, heterogeneity, border definition, cyst formation, mass effect) [Table - 1]. Design of the classification scheme As shown in [Figure - 2], a hierarchical tree classification scheme was designed to discriminate among astrocytoma grades I through IV. At the first level, the astrocytomas were grouped into two parts: low-grade (grades I to II) and high-grade (grades III to IV). At the second level, we discriminated between the individual grades. At each level, classification was done using two methods based on the score. The first method was the cooperative prediction from clinical observers: a fully experienced neuroradiologist and neurosurgeon. The neurosurgeon analyzed the clinical feature to help the radiologist to read images in predicting the grades. The second method was the SVM-based grade prediction. At the first level, when astrocytomas were classified into low-grade and high-grade groups, receiving operating characteristics (ROC) curves were employed to demonstrate and compare the performance between two methods. We defined two classification results: SVM output (1, −1) and observers' conclusion (high-grade marked with 1 and low-grade marked with −1) as an actual positive result if the prediction was correct and as an actual negative result if the prediction was wrong. Accordingly, true pathologic grade score and prediction score fit a nonparametric ROC curve. Observers and the SVM model demonstrated two ROC curves to discriminate the classification of the first level by the areas under ROC curves. At the second level, low-grade and high-grade groups' accuracies were calculated from two methods, and the results of the two methods were compared for each group. Finally, according to the results of the second level, the overall accuracy and kappa values of two methods can be obtained and compared. Development of support vector machine model The theory of SVM is as follows. In brief, given a training set,
where xi are observations, and yi are corresponding labels (e.g., −1 for low-grade, +1 for high-grade), [16],[17] the following quadratic optimization problem is solved:
where C is the constant, and ξ are positive slack variables allowing some examples to lie on the wrong side of the soft margin. Here, training vectors are mapped into a higher dimensional space by the φ function. Furthermore, K(xi, xj) is the kernel function. In this study, the kernel function was set to the radial basis function:
Therefore, the SVM model is defined by parameters C and γ. In this research, they were found by a "grid-search" using fivefold cross-validation. In fivefold cross-validation, the training is set into five subsets of equal size; when one subset is designated as the test set, the others comprise the training set; each subset is designated as the test set in turn. The "grid-search" tries every combination of (C, γ) with values ranging from C = 2-5 … 215 to γ = 2-15… 23, and receptively computes the accuracy and finds the combination of (C, γ) with maximum accuracy. At the first level, all the data are set to input vectors to determine the best C and γ, but at the second level we use the right grade to search for C and γ. For example, for the low-grade group, after prediction of the first level, the data with grade III to IV were excluded from training set. When the suitable combination of (C, γ) was found, the SVM model was applied to predict the whole low-grade group, including the data for grade III to IV above. In this way, three different (C, γ) values can be calculated. Data processing and statistical analysis To develop the SVM model, the libsvm tools version 2.9 based on Python was implied. [18] The Bowker test (i.e., generalized McNemar test) and kappa value for overall accuracy were computed by using PASW Statistics 18.0.0. [19] Other statistical analysis was conducted using Stata11.0 (MP edition). For all comparisons, a two-tailed statistical significance level was set at P < 0.05. Results A total of 106 patients with astrocytoma (39 males and 67 females; median age 43 years; age range 2-77 years) met the inclusion/exclusion criteria. Among all the patients, the grades ranged from grades I to IV: n = 9 grade I, n = 25 grade II, n = 12 grade III, and n = 60 grade IV cases. The distribution of patients' scores is summarized in [Table - 1]. After development and training of the SVM model, there were three different (C, γ) parameters - (3, −5), (9, −13) and (3, −5) - to three corresponding SVM models at different levels of the scheme. The models were assessed separately for the whole data set, the subset comprising grades I and II, and the subset comprising grades III and IV. After the whole data with grades I-IV were divided into low-grade and high-grade groups by two methods, the areas under the ROC curves (AUCs) can be respectively computed for comparison. As shown in [Figure - 3], the areas of two methods were both above 0.5 due to the lower limit of each confidence interval upon 0.5. Furthermore, as given in [Table - 2], the AUC of the SVM was significantly greater than that of the observers (P = 0.004). In the following comparison, although the accuracies of two methods in the low-grade group were not the same, the result is not statistically significant (P = 0.092). However, the accuracies of the two methods in the high-grade group were 0.846 and 0.662 (P = 0.008). Finally, in general comparison, the overall accuracies and kappa values were calculated. The accuracy of SVM differed significantly from the accuracy of the observers (P = 0.001); the kappa values of SVM and observers were 0.679 (P < 0.001) and 0.466 (P < 0.001), respectively. Discussion Grading of astrocytomas is an important task because it affects treatment planning and is of prognostic importance. [2] In this study, nine MR features and one clinical parameter were extracted and merged to analyze and predict astrocytoma grades. The results demonstrated satisfactory performance of the SVM model, indicating that the SVM model can merge a large amount of information based on one clinical parameter and MR features and find the hyperplane through computation to accurately discriminate among the range astrocytoma grades. In this research, MR features (e.g., enhancement, edema, cyst formation) were selected because prior research has verified that astrocytoma grading is dependent on the association of MR features. [8],[9],[20],[21],[22],[23] Among the selected MR features, edema and enhancement were most important to discriminate the pathologic grade of astrocytoma.[24],[25] In addition, apparent diffusion coefficient (ADC) values were affected by the change from encephalic cyst, necrosis, hemorrhage, and air of skull base bone or sinus, and the change of ADC affected other types MR such as perfusion-weight images (PWIs), diffusion-weight images (DWIs), MR spectroscopy, and fluid-attenuated inversion-recovery images. Although susceptibility-weighted imaging is very sensitive regarding tumor hemorrhage and venous structure, there was no clear conclusion regarding whether susceptibility-weighted imaging would provide better demonstration of the tumor edema and boundary than conventional MR. [26],[27] Therefore, in this study, only T1WI (pre- and post-contrast) and T2WI were selected. [28],[29] A previous study showed that radiologists were able to discriminate low-grade and high-grade astrocytomas with an accuracy of 0.806 (29/36). [20] In this study, observers correctly classified 81 cases of 106 astrocytomas at the first level, resulting in an accuracy of 0.764 (81/106), in accordance with the prior study (χ2 = 0.264, P = 0.607). This demonstrated that ability of observers to predict astrocytoma grade in this study was credible. The MR diagnosis of astrocytomas was usually made subjectively. Therefore, an auxiliary computerized scheme capable of providing objective information was applied to discriminate the grades of astrocytomas. [20],[22],[30] Most computerized schemes only elaborated the discrimination of low-grade and high-grade astrocytomas rather than grades I-IV. In this study, we used two level classification to individually discriminate grades I-IV. This type of hierarchical tree classification scheme was preferred because it was similar with the diagnostic procedure: initially, astrocytomas were separated into low-grade and high-grade groups, and subsequently separated into each individual grade. This hierarchical tree classification scheme had also given good results in similar researches conducted earlier. [31],[32],[33] According to the parameters selected as described above, the prediction is shown in [Table - 2]. Every diagnostic performance of the SVM model was better in terms of accuracy than the observers' predictions, but the difference in predictive accuracy between the two methods had no statistical significance in the low-grade group. At the first level, ROC was applied to evaluate and compare SVM and observer methods. This is because for the binary classification problem, ROC analysis has proven very useful for evaluating the two-class classifier. [34] The AUCs differ significantly between SVM and the clinical observers (P = 0.004). This indicates that the SVM can provide information to help clinicians discriminate between low-grade and high-grade astrocytomas. At the second level, the accuracies of only two methods were compared because it was not certain that there were two or more categories of grade. There was no significant difference between methods in the low-grade group (P = 0.092). A larger sample size might reduce the P value and improve the precision of SVM-based prediction. In the high-grade group, as a result of the significantly different accuracies of the two methods (P = 0.008), SVM can be used to help clinicians to distinguish between grade III and grade IV astrocytomas. For the overall grading, we compared the accuracies using the Bowker test, as it is suitable to the multi-class classification paired problem. [19] The result demonstrated that the overall accuracies differed significantly between the two methods. Overall, SVM may be particularly helpful for readers with limited clinical experience. In conclusion, as a classification model, SVM has demonstrated the ability to discriminate astrocytoma grades I through IV and can improve the diagnostic performance of clinicians in staging astrocytomas. References
Copyright 2010 - Neurology India The following images related to this document are available:Photo images[ni10190t1.jpg] [ni10190f3.jpg] [ni10190t2.jpg] [ni10190f1.jpg] [ni10190f2.jpg] |
| |||||||||
![[Figure - 1]](/showimage?ni/photo/ni10190f1.jpg)
![[Table - 1]](/showimage?ni/photo/ni10190t1.jpg)
![[Figure - 2]](/showimage?ni/photo/ni10190f2.jpg)
![[Figure - 3]](/showimage?ni/photo/ni10190f3.jpg)
![[Table - 2]](/showimage?ni/photo/ni10190t2.jpg)