 |
| About Bioline | All Journals | Testimonials | Membership | News |
|
||||||
|
||||||
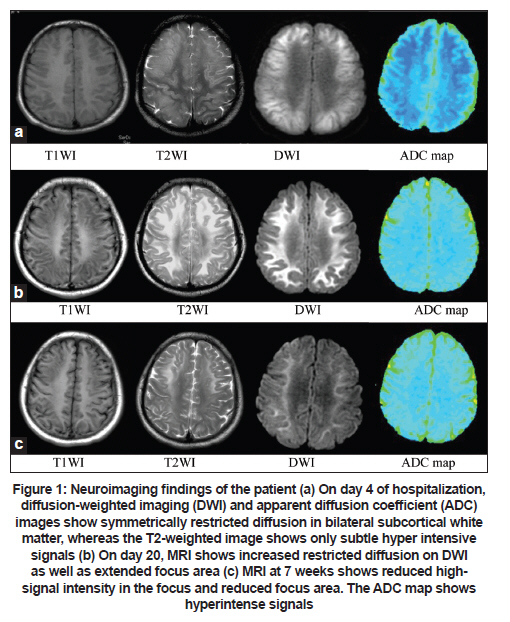
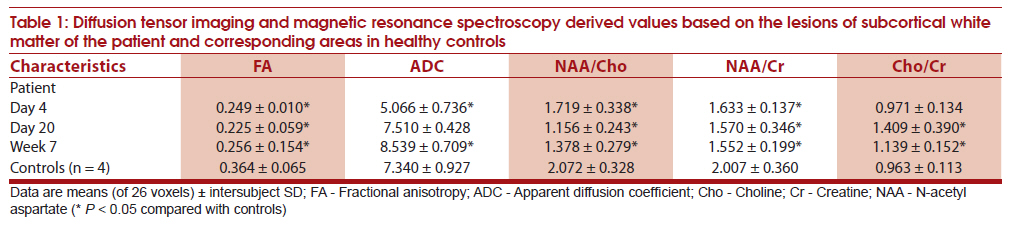
Neurology India, Vol. 59, No. 1, January-February, 2011, pp. 108-110 Case Report Diagnosis and prognosis evaluation of 1,2-dichloroethane encephalopathy - Magnetic resonance imaging combined with diffusion tensor imaging and magnetic resonance spectroscopy study Fulan Zhan1, Wenbin Zheng1, Lian Liu2, Lingmei Kong1 1 Department of Radiology, The Second Affiliated Hospital, Medical College of Shantou University, Shantou, China Keywords: 1, 2-Dichloroethane poisoning, DTI, encephalopathy, MR spectroscopy Introduction 1,2-dichloroethane (1,2-DCE) is a commonly used industrial solvent. [1] People working as spray painters and printers are occupationally exposed to DCE, which can be inhaled or taken up through the skin and may cause 1,2-DCE encephalopathy. [2],[3] We aim to investigate the value of conventional magnetic resonance imaging (MRI) combined with functional MRI in the early diagnosis and prognostic evaluation of 1,2-DCE-encephalopathy, and ultimately, to provide a more reliable basis for clinical diagnosis and treatment. Case Report A 20-year-old man, who was occupationally exposed to 1,2-DCE for six months, presented with headache, dizziness, nausea, vomiting, and a slow response to verbal commands. Laboratory test results were normal. Computed tomography (CT) of the brain showed shallow sulci, widened gyri, and symmetrical hopodensities in both the white matter and the external capsule. He was treated with tranquilizers, mannitol and dexamethasone. He underwent magnetic resonance imaging (MRI) using a GE 1.5-T MR scanner equipped with high-performance gradients. Diffusion tensor imaging (DTI) and 1 H-magnetic resonance spectroscopic imaging ( 1 H-MRS) were also done. Regions of interest of 31.6 mm 2 were located inside the abnormal signal region for apparent diffusion coefficient (ADC), fractional anisotropy (FA), and metabolic changes measurements. Imaging data for the lesions were measured automatically with the scanner's software (GE Medical System). Correlations between time of MRI and mean ADC and FA values, including those for normal controls, were analyzed by ANOVA. Statistical analysis was performed using SPSS v15.0 software (SPSS Inc., Chicago, IL). T2-weighted imaging (T2WI) on day-4 of hospitalization showed bilateral, moderate, and diffuse high-signal intensity in the subcortical white matter. DWI revealed hemispheric lesions with high-signal intensity and low-mean ADC (5.066 ± 0.736 × 10⁻⁴ mm 2 /s) in the corresponding areas [Figure - 1]a. On 1 H-MRS, the ratios of N-acetyl aspartate to creatinine (NAA/Cr), choline to creatinine (Cho/Cr), and NAA to Cho (NAA/Cho) for the lesions were 1.632 ± 0.138, 0.971 ± 0.135, and 1.719 ± 0.338, respectively [Table - 1]. On day 20, brain MRI revealed increased signal intensity of the bilateral lesions and external capsule on T2WI and DWI with increased mean ADC (7.510 ± 0.428 × 10⁻⁴ mm 2 /s) [Figure - 1]b. The NAA/Cr and NAA/Cho ratios were reduced and the Cho/Cr ratio was increased [Table - 1]. At seven weeks, T2WI and DWI revealed reduced high-signal intensity in the focus [Figure - 1]c and the mean ADC value was further increased (8.539 ± 0.709 × 10⁻⁴ mm 2 /s). The mean FA values for the three successive DTI were lower than the values of normal controls and with the most severely reduced FA value at day 20. All the results of the MRI examination were compared with those of the healthy controls (n = 4, age 20−25 years old) [Table - 1]. FA values for the three examinations and ADC values on day four and week seven, significantly differed from those of the normal controls and there were significant differences among the mean ADC values for the three examinations (P < 0.05). The neuronal metabolite ratios (NAA/Cho, Cho/Cr) by 1 H-MRS were correlated with FA values on day-20 (r = 0.458, P < 0.05; r = −0.497, P < 0.01). Discussion This patient is remarkable for its neuroimaging findings using conventional MRI combined with DTI and 1 H-MRS. [4] DTI is a technique based on measurement of the Brownian motion of water molecules. It has been used to evaluate various physiological and pathological processes. [5] The two commonly used DTI-derived measurements are FA and ADC. 1 H-MRS is a non-invasive method for detecting and quantifying biochemical cerebral disturbances in metabolic encephalopathy. Previous studies showed that cerebral edema is a common major characteristic feature of acute and subacute DCE encephalopathy. [6],[7] A low ADC is reported to be associated with poor prognosis in experimental ischemia models, and ADC values from 4.50 to 5.50 × 10 -4 mm 2 /s were suggested as a threshold for irreversible damage. [8] There is a negative linear correlation between ADC value and the degree of cytotoxic edema. [9] In our patient, DTI examination revealed a low ADC value in the acute stage (day-4) and a higher ADC value in the subacute stage (day-20). Combined with the DWI features, we can conclude that edema was mainly cytotoxic in the acute stage, but vasogenic in the subacute stage. These observations are consistent with several other reports. [6],[10] Although the intracellular function is not clear, NAA is found predominantly within neurons, and thought to be a neuronal axonal marker. In this patient, the NAA/Cho ratio decreased on day-20 and the mean FA levels reached the lowest at the same time, reflecting some degree of neuronal necrosis and white matter demyelination. These findings also favored the increased T2 signal hyperintensity with widened focus area on day-20 and are consistent with previous reports on organic solvent poisoning and multiple sclerosis. [11],[12] Therefore, the FA values, NAA content, and neuronal structure may be associated or independent of the pathology involved. In the early phase, DWI can reveal extensive brain changes earlier than with conventional T2WI. Changes in ADC values could explain the formation of brain edema and corresponding brain symptoms in the patient. DTI and 1 H-MRS were more sensitive in detecting and demonstrating the extent of cerebral lesions than routine MRI. The dynamic changes in FA values and neuronal metabolite ratios derived from DTI and MRS sequences can objectively reflect the degree of nerve damage and progression of brain damage. All these further our understanding of the mechanism of 1,2-DCE encephalopathy and may provide valuable information in its diagnosis and prognosis. References
Copyright 2011 - Neurology India The following images related to this document are available:Photo images[ni11027t1.jpg] [ni11027f1.jpg] |
| |||||||||
