 |
| About Bioline | All Journals | Testimonials | Membership | News |
|
||||||
|
||||||
Mem Inst Oswaldo Cruz, Rio de Janeiro, Vol. 97(3) 2002, pp. 351-352 SHORT COMMUNICATION
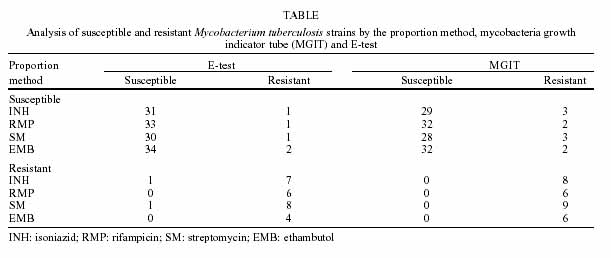
Comparison of the Proportion Method With Mycobacteria Growth Indicator Tube and E-test for Susceptibility Testing of Mycobacterium tuberculosis Asuman Birinci, Ahmet Yilmaz Coban+, Bora Ekinci, Belma Durupinar
Ondokuz Mayýs University Medical
School, Department of Microbiology, Samsun, Turkey Received 3 August 2001 Code Number: oc02067 The aim of this study was to investigate the correlation between proportion method with mycobacteria growth indicator tube (MGIT) and E-test for Mycobacterium tuberculosis. Forty clinical isolates were tested. MGIT and E-test with the first line antituberculous drugs correlated with the proportion method. Our results suggested that MGIT and E-test methods can be routinely used instead of the proportion method.
Key words: Mycobacterium tuberculosis - E-test - mycobacteria growth indicator tube The resurgence of tuberculosis and outbreaks of multidrug-resistant Mycobacterium tuberculosis has increased the emphasis on rapid turn-round time for mycobacterial cultures and susceptibility testing for effective treatment and control of the disease (Zapata et al. 1999). The proportion method (on Middlebrook 7H10-11 agar) and Bactec TB 460 system (Becton Dickinson Microbiology System, Cockeysville, MD, USA) are the most commonly used methods to determine drug susceptibility of M. tuberculosis (NCCLS 1995). Recently, new methods were developed including, BBL mycobacteria growth indicator tube (MGIT) (Becton Dickinson Microbiology System) and E-test (AB BIODISK) (Palaci et al. 1996, Wanger & Mills 1996). The purpose of this study was to compare the proportion method with MGIT and E-test for susceptibility testing of M. tuberculosis. Forty clinical isolates were tested using the proportion method, MGIT and E-test. Agar dilution susceptibility testing was performed according to the proportion method as described NCCLS tentative standard-M24-T (NCCLS 1995). M. tuberculosis H37Rv, susceptible to all antimicrobials, were included as control strain. E-test susceptibility testing was performed as described by Wanger and Mills (1996). MGIT susceptibility testing was performed according to the protocol provided by the manufacturer and as described elsewhere (Palaci et al. 1996). The results were compared using Kappa (measurement of agreement) and Mc Nemar statistical tests. Analysis of susceptible and resistant M. tuberculosis strains by the proportion method, MGIT and E-test are summarized in the Table. The correlations between E-test/MGIT with the agar proportion method were 84.4/79.5, 90.8/82.8, 85.7/80.8 and 77.3/82.8 % for isoniazid, rifampicin, streptomycin and ethambutol, respectively. There were no significant differences between the proportion method and E-test and MGIT susceptibility testing. The average time required to obtain susceptibility results were 6 days for MGIT, 7 days for E-test and 21 days for the agar proportion method. In case of discordances, the tests were repeated, and no difference was noted on the susceptibility profiles. Among all plates, used on E-test, only one had contamination, which necessitated the repeat of the experiment. The commonly used agar proportion method for mycobacterial susceptibility testing requires a three-week period of incubation before an isolate can be reported as drug susceptible. However, the Bactec radiometric susceptibility method has the advantage of being more rapid than the agar proportion method (4-7 days) but it requires the use of radioisotopes and can be costly to perform (Sanic et al. 2000). Wanger and Mills (1996) and Sanic et al. (2000) found that E-test correlated with the proportion method. Palaci et al. (1996) found that sensitivity (64.7%) of rifampicin-containing MGIT when compared with that of the proportion method was less sensitive. Zapata et al. (1995) found a better correlation between MGIT and the proportion method on Löwenstein-Jensen medium than with the Bactec 460 method, but a poorer correlation was seen when isoniazid tested. Our results showed that there were no statistically significant differences in susceptibility testing results between MGIT, E-test and the proportion method. The results thus suggest that MGIT and E-test methods can be routinely used instead of the proportion method because the average times required for obtaining the final result with new methods are less than the proportion method. REFERENCES
The following images related to this document are available:Photo images[oc02067t1.jpg] |
| |||||||||
