 |
| About Bioline | All Journals | Testimonials | Membership | News |
|
||||||
|
||||||
Mem Inst Oswaldo Cruz, Rio de Janeiro, Vol. 99, No. 7, November, 2004, pp. 683-686 Spatial Analysis of the Distribution of Leprosy in the State of Ceará, Northeast Brazil Ana Cláudia Dorta Montenegro, Guilherme Loureiro Werneck*/**/+, Ligia Regina Sansigolo Kerr-Pontes, Maurício Lima Barreto***, Hermann Feldmeier**** Departamento
de Saúde Comunitária, Faculdade de Medicina, Universidade Federal
do Ceará, Fortaleza, CE, Brasil *Departamento de Epidemiologia, Instituto
de Medicina Social, Universidade do Estado do Rio de Janeiro, Rua São
Francisco Xavier 524, 7o andar, bloco D, 20559-900 Rio de Janeiro,
RJ, Brasil **Núcleo de Estudos de Saúde Coletiva, Universidade
Federal do Rio de Janeiro, Rio de Janeiro, RJ, Brasil ***Instituto de Saúde
Coletiva, Universidade Federal da Bahia, Salvador, BA, Brasil ****Fachbereich
Humanmedizin, Freie Universität Berlin, Berlin, Germany Received 21 June
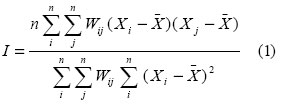
2004 Code number: oc040139 The aim of this study was to describe spatial patterns of the distribution of leprosy and to investigate spatial clustering of incidence rates in the state of Ceará, Northeast Brazil. The average incidence rate of leprosy for the period of 1991 to 1999 was calculated for each municipality of Ceará. Maps were used to describe the spatial distribution of the disease, and spatial statistics were applied to explore large- and small-scale variations of incidence rates. Three regions were identified in which the incidence of leprosy was particularly high. A spatial gradient in the incidence rates was identified, with a tendency of high rates to be concentrated on the North-South axis in the middle region of the state. Moran's I statistic indicated that a significant spatial autocorrelation also existed. The spatial distribution of leprosy in Ceará is heterogeneous. The reasons for spatial clustering of disease rates are not known, but might be related to an heterogeneous distribution of other factors such as crowding, social inequality, and environmental characteristics which by themselves determine the transmission of Mycobacterium leprae. Key words: leprosy - incidence - spatial analysis - clustering - Brazil Leprosy is still endemic in many developing and underveloped countries, affecting preferentially individuals of the lower socioeconomic stratum (Van Beers et al. 1996). The prevalence of leprosy varies greatly, but most cases occur in India and Brazil (WHO 1998). In Brazil, the disease burden is particularly high in the Northeast region (Brasil 2001). Whereas important progress has been made in the treatment of leprosy, its epidemiology is still poorly understood (Mani 1996). One of the characteristic facets of the epidemiology of leprosy is the extremely irregular geographical distribution (Van Beers et al. 1996). In the state of Ceará, for instance, leprosy is endemic, but the variations in the prevalence and incidence rates are enormous. There are many municipalities with a prevalence of less than 0.1 per 10,000 inhabitants and a few with a prevalence as high as 25 per 10,000 people (Sesa 1999). Interestingly, municipalities with very high prevalence are usually surrounded by others with high and/or intermediate prevalence (Tavares 1997). The apparent existence of spatial clusters of high incidence and prevalence of leprosy suggests that the spatial distribution of the disease might be influenced by environmental factors (Sterne et al. 1995, Fine 1997). In Brazil, two interesting studies approached the problem of spatial heterogeneity of leprosy distribution, both focusing on urban areas of the state of Pernambuco (Souza et al. 2001, Lapa et al. 2001). In these applications of spatial analysis techniques, investigators were able to detect clustering of areas with high detection rates of the disease. In this study we used spatial statistical techniques to identify patterns of occurrence of leprosy in the state of Ceará. To accurately define these patterns it was necessary to examine both large-scale and small-scale variation in incidence rates (Richardson 1996). Large-scale variation, or spatial gradient, refers to the trend in the incidence rate in space and can be represented as a function of the geographical coordinates (Bailey & Gatrell 1995). Small-scale variation results from clustering of high or low values across the region and from spatial autocorre-lation, the property by which nearby areas tend to have similar values of a variable (Richardson 1996). To study small-scale variation accurately, it is often necessary to remove the effects of large-scale variation (Richardson 1996). We combined methods of evaluating large- and small-scale variation in order to identify high-risk areas and to generate new hypotheses about the spread of leprosy in the region. MATERIALS AND METHODS Study area - The Northeast of Brazil has a semi-arid climate and regularly suffers from droughts. It is one of the poorest and less developed regions of the federation. The state of Ceará is located in the center of this region, with an area of 148,000 km2 and population of roughly 7.5 million people (IBGE 2000). It is one of the three states of the region that show the highest level of income inequality (IBGE 2000). Only 3.7% of the population earn more than R$1300 (~US$450) per month. About 28% of people elder than 15 years old are illiterate. As to general poverty it ranks third in the Northeast (IBGE 2000). In 1991 the state of Ceará had 178 municipalities, which are the unities of analysis in this study. Data collection - Data on leprosy cases from 1991 to 1999 were extracted from the records of the Department of Health of Ceará State (Sesa 2002). The variable was calculated as follows. For each calendar year from 1991 to 1999 and for each municipality, the number of new leprosy cases and the mid-year population (interpolated by using a geometric growth equation using population data from the 1991 and 2000 census') were used to calculate incidence rates. Thus, for each municipality, the average incidence rate over the nine years was calculated by summing up the number of new leprosy cases and dividing it by the sum of the mid-year population estimates. We preferred to use the average incidence rather than yearly incidence in order to obtain more stable rates. Besides, it was supposed that variation in the incidence of new cases within a municipality could arise due to operational factors, e.g. personnel of the leprosy program left the municipality health department and was not replaced for a prolonged period, which in turn would have an impact on the annual detection rate. Incidences were linked to each municipality on a digital map obtained from the Brazilian Institute of Geography and Statistics (Instituto Brasileiro de Geografia e Estatística or IBGE). Statistical analysis - The standard procedure to explore large-scale variation is to derive a trend surface in which the outcome variable is expressed as a polynomial function of the spatial coordinates (Bailey & Gatrell 1995). We fitted a locally-weighted regression model (Hastie & Tibshirani 1990) to the entire trend surface as a single smoothed function of spatial coordinates, where: log(rate) = LOESS(longitude, latitude) and LOESS stands for locally-weighted regression smoothing; in this analysis, window span was set to 0.5. The LOESS smoother first identifies the 50% of observations that are nearest geographically to the target observation. The smoothed value at the target point is the fitted value from a locally-weighted quadratic fit. Weights are supplied by a tri-cube kernel, which is centered at the target observation and decline to zero at the furthest neighbor (Hastie & Tibshirani 1990). Since 13 municipalities had no cases of leprosy in the period, we arbitrarily added one case to each region in order to be able to calculate logarithm of the rates. We then used the residuals of this model to explore the second-order component of variation. We used Moran's I as a measure of spatial autocorrelation to identify the degree of spatial clustering of rates of leprosy (Cliff & Ord 1981). Moran's I statistic is defined as (Cliff & Ord 1981):
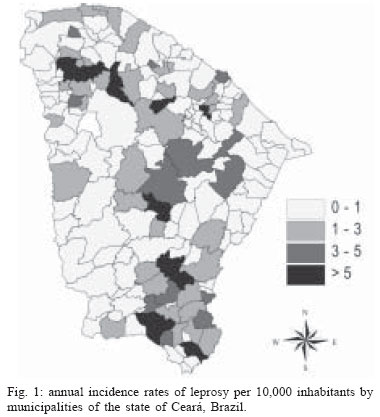
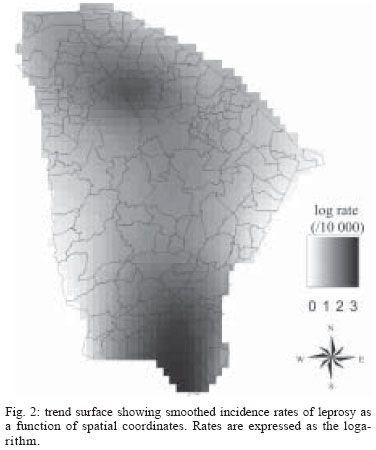
where n is the number of regions; Xi and Xj are the values of the variable of interest at regions i and j; and Wij is a measure of connectivity between all pairs of regions (i,j). In this study, we used a first order adjusted connectivity matrix, in which region i is considered neighbor of region j if they share a common boundary or if the distance between their centroids is less than the average distance between the centroids of region i and the centroids of all regions that share a common boundary with region i. Whenever a pair of regions (i,j) are considered neighbours, then Wij = 1, otherwise, Wij = 0. Moran's I is similar to the Pearson correlation coefficient with values ranging from -1 to +1. When there is no spatial autocorrelation its value equals zero. Clustering leads to positive values of I, while negative autocorrelation leads to negative values. Under the assumptions of normally distributed variables and constant variances, the distribution of Moran's I under H0 (no spatial autocorrelation) is normal with a known mean and variance, and its significance can be calculated by computing standardized normal variables (Cliff & Ord 1981). The residuals of our smoothed trend surface were approximately normally distributed, and in any case, the autocorrelation statistic presented here is robust to departures from normality when the sample size is greater than 20 observations (Walter 1993). Statistical analysis was carried out using S+SpatialStats (Mathsoft, Seattle, WA). RESULTS Fig. 1 shows the average incidence rates of leprosy in the municipalities of Ceará for the period of 1991 to 1999. Areas with high incidence rates cluster in the northwestern, center, and southeastern regions of the state. Fig. 2 shows the trend surface produced by the LOESS model. Since there is a tendency of higher incidence rates to concentrate along the North-South axis in the middle region of the state, there seems to be an interaction between latitude e longitude, A statistically significant spatial autocorrelation was identified in the residuals of the LOESS model (Moran's I = 0.37, p-value < 0.001). DISCUSSION The spatial distribution of leprosy in the state of Ceará is extremely heterogeneous. In this study we were able to identify clusters of high incidence rates in the northwestern, center, and southeastern regions of the state. The reasons for spatial clustering of disease rates may lay in the heterogeneous distribution of underlying factors such as crowding, social inequality, access to health services or environmental characteristics that determine the transmission of M. leprae and hence the incidence of leprosy in a given area (Kerr-Pontes et al. 2004). Surprisingly, the regions with the highest incidences are among the most urbanized and economically developed of Ceará. This seems to be paradoxical, but one explanation is that, although the population of these municipalities has better absolute economic indicators, they are subject to higher levels of social inequalities, which in turn is thought to increase susceptibility to infectious disease (Kerr-Pontes et al. 2004). Income inequality may have a negative impact on self-esteem, causes stress and unhappiness, and lowers social cohesion, factor that might negatively affect the health of an individual (Wilkinson 1997). Another explanation for the observed spatial irregularities is based on the massive population movements having occurred in Ceará during the last decades, particularly towards existing urban centers. Uncontrolled urbanization usually results in disorganized settlement of the periphery of the cities. Such poor neighborhoods tend to maintain some characteristics of the rural hinterland such as bad housing, lack of sanitation, presence of gardens for horticulture and keeping livestock (Mani 1996). This, in turn, is expected to provide non-human reservoirs for M. leprae and/or to increase the number of individuals susceptible to the infection with M. leprae. Accordingly, it may not be by coincidence that heavily urbanized areas were found to have higher levels of incidences of leprosy than districts with a low urbanization rate. On the other hand, municipalities which are economically better off tend to have more efficient health services and by consequence should be able to detect new cases of leprosy more efficiently. Therefore, another explanation would be that the heterogeneity in the distribution of disease rates might simply reflect distortions provoked by municipal surveillance systems of different quality. However, as the mean incubation time of leprosy is almost five years and our study comprised a period of nine years, differences between municipalities in active case finding should be leveled out during time of observation, since new patients will report positively to health units once their symptoms cannot be ignored anymore. Spatial analytical techniques were mainly developed to approach problems in geology, plant and animal ecology, and agricultural field trials (Marshall 1991). Applications for epidemiological research on disease patterns are still being developed. In this study, we identified patterns of variation of incidence of leprosy that suggest heterogeneities in the underlying factor determining the transmission of M. leprae and/or the detection of new cases of leprosy between administrative districts. ACKNOWLEDGEMENTS To the Coordenação de Aperfeiçoamento de Pessoal de Nível Superior and Deutscher Akademisher Austauschdienst for supporting the exchange program between the Fachbereich Humanmedizin of the Freie Universität Berlin and the Universidade Federal do Ceará. REFERENCES
Copyright 2004 Instituto Oswaldo Cruz - Fiocruz The following images related to this document are available:Photo images[oc04139f2.jpg] [oc04139f1.jpg] |
| |||||||||
