 |
| About Bioline | All Journals | Testimonials | Membership | News |
|
||||||
|
||||||
Mem Inst Oswaldo Cruz, Rio de Janeiro, Vol. 101,Suppl. I, October ,2006, pp. 91-96 Analysis and estimative of schistosomiasis prevalence for the state of Minas Gerais, Brazil, using multiple regression with social and environmental spatial data Ricardo JPS Guimarães*****, Corina C Freitas/+, Luciano V Dutra, Ana CM Moura*, Ronaldo S Amaral**, Sandra C Drummond***, Márcio Guerra******, Ronaldo GC Scholte****/*****, Charles R Freitas*, Omar S Carvalho**** Instituto Nacional de Pesquisas Espaciais, Caixa Postal 515,
12201-970 São José dos Campos, SP, Brasil *Universidade Federal
de Minas Gerais/UFMG, Belo Horizonte, MG, Brasil **Secretaria de Vigilância
em Saúde/MS, Brasíla, DF, Brasil ***Secretaria Estadual de Saúde,
Belo Horizonte, MG, Brasil ****Centro de Pesquisas René Rachou-Fiocruz,
Belo Horizonte, MG, Brasil *****Programa de Pós-Graduação
em Clínica Médica/Biomedicina da Santa Casa de Misericórdia
de Belo Horizonte, Belo Horizonte, MG, Brasil ******Companhia de Tecnologia
da Informação do Estado de Minas Gerais, Belo Horizonte, MG,
Brasil
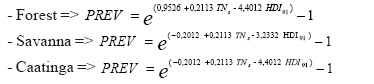
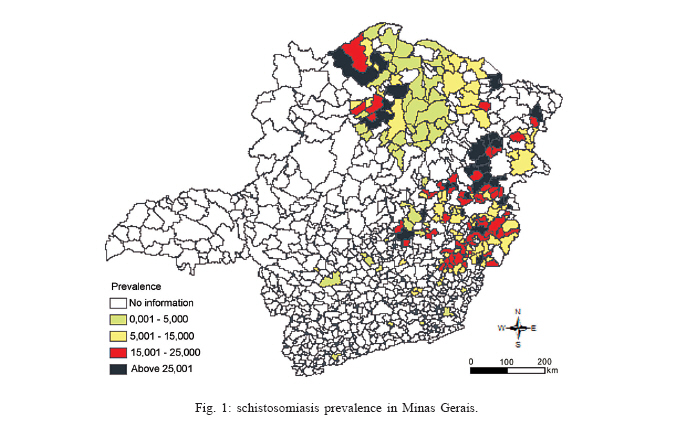
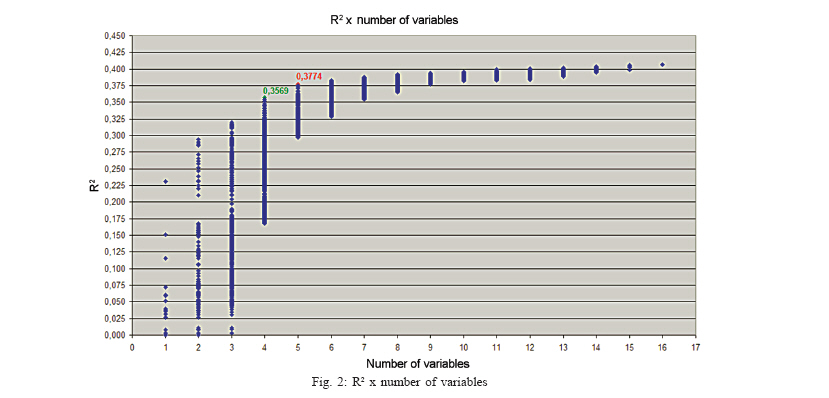
Financial support: Inpe, CNPq (309922/2003-8; 305546/2003-1; 380203/2004-9), Fapemig (EDT 1775/03; EDT 61775/03; CRA 0070/04) Received 25 May 2006 Code Number: oc06172 The aim of this work is to establish a relationship between schistosomiasis prevalence and social-environmental variables, in the state of Minas Gerais, Brazil, through multiple linear regression. The final regression model was established, after a variables selection phase, with a set of spatial variables which contains the summer minimum temperature, human development index, and vegetation type variables. Based on this model, a schistosomiasis risk map was built for Minas Gerais. Key words: schistosomiasis - risk map - geographical information system - multiple linear regression Schistosomiasis is endemic in 74 tropical developing countries. It is estimated that 200 million people are already infected, and that 600 million people are at risk of becoming infected (WHO 1999). Disease prevalence is heterogeneous in vulnerable locales and tends to be worse in areas with extreme poverty, poor sanitation, increased freshwater irrigation usage, and with inadequacy or total lack of public health facilities. The treatment for schistosomiasis is simple, due to the availability of fast action drugs prescribed in one single oral dose (Katz et al. 1989). However, the disease prevalence remains unchanged in endemic regions and it is expanding mainly in the urban centers periphery (Neves 2005). The extensive distribution of the intermediate hosts, from Biomphalaria species, in Minas Gerais, Brazil gives to schistosomiasis an expansive characteristic, even for indene areas (Katz & Carvalho 1983, Carvalho et al. 1988, 1989). In the endemic areas, the high concentration of the hosts, associated to other risk factors, favors the existence of communities with high prevalence of schistosomiasis. The distribution of the schistosomiasis in the state of Minas Gerais is not regular, intercalating areas of high prevalence with others where the transmission is low or null. The disease is endemic in the north (comprising the Médio São Francisco and Itacambira zones), oriental, and center regions (zones of Alto Jequitinhonha, Metalúrgica, Oeste, and Alto São Francisco). The higher infection indices are found in the northeast and in the east part of the state, which includes the zones of Mucuri, Rio Doce, and Mata (Pellon & Teixeira 1950, Katz et al. 1978, Carvalho et al. 1987, Lambertucci et al. 1987). Since schistosomiasis is a disease determined in space and time by risk factors, the Geographical Information System (GIS) is a very powerful tool that might be used for better understanding the disease prevalence and risk factors distributions. The use of GIS in the identification of environmental characteristics allows the determination and the delimitation of factors and risk areas, leading to the optimization of the resources and to the choice of better strategies for controlling the disease. The prediction of schistosomiasis using GIS was first attempted in the Philippines and the Caribbean by Cross et al. (1984). The influence of climate and environmental variables to the distribution of schistosomiasis was documented by Brown (1994) and Appleton (1978). The use of GIS for the study of schistosomiasis was also done in several other countries: in Asia (Cross et al. 1996), China (Zhou et al. 2001, Seto et al. 2002, Yang et al. 2005), Ethiopia (Kristensen et al. 2001, Malone et al. 2001), Egypt (Malone et al. 1994, 1997, Abdel-Rahman et al. 2001), Uganda (Kabatereine et al. 2004), Tanzania (Brooker et al. 2001), Chad (Beasley et al. 2002, Brooker et al. 2002). In Brazil, one of the first studies trying to correlate disease distribution with environmental variables was conducted by Bavia et al. (2001), in Bahia. The objective of this paper is to provide a risk map for the state of Minas Gerais, by establishing a relationship between prevalence of schistosomiasis and social-environmental variables through multiple linear regression and geographical information system. Also, we extend the methodology in several directions by introducing new explicative variables: climate variables and categorical data from standard biomes in Minas Gerais. MATERIALS AND METHODS Variables acquisition - The geo determination quality of a spatial model depends on how accurate the spatial positioning of involved variables is. Ideally it is desirable that each disease occurrence would be geo located by Geographic coordinates. Prevalence data, however, has been acquired for several years- even before the GPS technology became commonly available- being associated with the municipality center or some countryside village. Because of this limitation it was decided to integrate the environmental variables over the municipality territory to be used as an input to the modeling process. This is also coherent with the fact that the sociological indexes, also used here, are associated with the municipalities. The schistosomiasis prevalence data (dependent variable) for 189 municipalities in Minas Gerais were obtained from Brazilian Health Ministry and from Health Secretariat of Minas Gerais State Annual Reports. The prevalence spatial distribution for Minas Gerais can be observed in Fig.1. Fourteen quantitative independent variables were used in the statistical analysis: three climatic variables (total precipitation, minimum and maximum temperature) in summer (from 17/Jan/2002 to 01/Feb/2002 period) and in winter (from 28/Jul/2002 to 12/Aug/2002 period) seasons, and four social variables [human development index (HDI), income, longevity and education indices] for the years of 1991 and 2000. Besides quantitative variables, two qualitative variables (binary) were also used, to represent three vegetation types: savanna, caatinga, and forest. The climatic variables were obtained from CPTEC/Inpe, the sociological ones from Brazilian Human Developing Atlas, and the qualitative variable from Geominas Project (Prodemge 1996). All independent and dependent data were given in a municipality base, with exception of the climatic data, which were given in a grid of 250 ´ 250 m. These data were, however, integrated over the municipality territory as explained. Variables selection - The independent variables were used as input variables to establish the multiple regression model for prevalence risk. Since multicollinearity effects among the independent variables were detected, variables selection techniques were used in order to choose a set of variables (or transformations of them) that better explain the dependent variable. A logarithmic transformation for the dependent variable (prevalence, denoted by PREV) was made as it improved the correlation with independent variables. The variables selection was done by the R2 criterion, using all possible regression procedure (Neter et al. 1996). This selection technique consists in the identification of a subset with few variables and a coefficient of determination R2 sufficiently closed to that when all variables are used in the model. Interaction effects were also included in the model. After choosing the model, the estimated regression function was applied to all municipalities to build a risk map for schistosomiasis prevalence. RESULTS To illustrate the variables selection technique, Fig.2 contains a plot of the highest R2 values against the number of variables in the model. In this figure the chosen model is highlighted in red, with R2 = 0.3774, consisting of a model with five variables: summer precipitation (PCs), summer minimum temperature (TNs), 1991 Human Development Index (HDI91) and two binary variables representing the vegetation types: The analysis of this model showed that the regression coefficient of the variable PCs was not statistically significant at 5% level. Therefore, this variable was also discarded from the model. The model with four variables (TNs, HDI91, V1, and V2) has a coefficient of determination of 0.3569, and it is highlighted in green in Fig.2 After choosing the variables, the significance of several cross-product interaction effects were tested. The final selected model, with R2 = 0.3631, consisted of the aforementioned variables and the interaction between HDI91, and V1, showing that the influence of HDI for the explanation of prevalence is different for savanna when compared to forest and caatinga. The general estimated regression function is:
This model for each vegetation type can be written as:
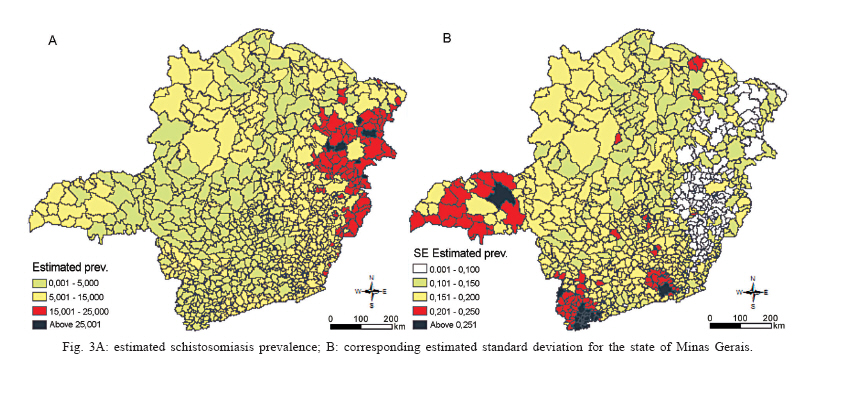
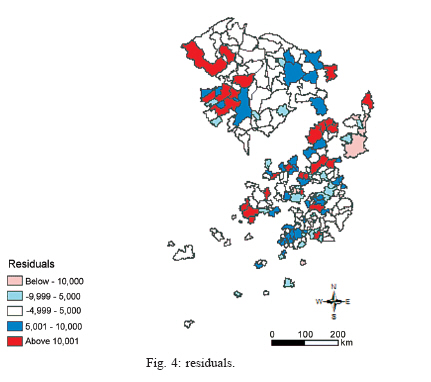
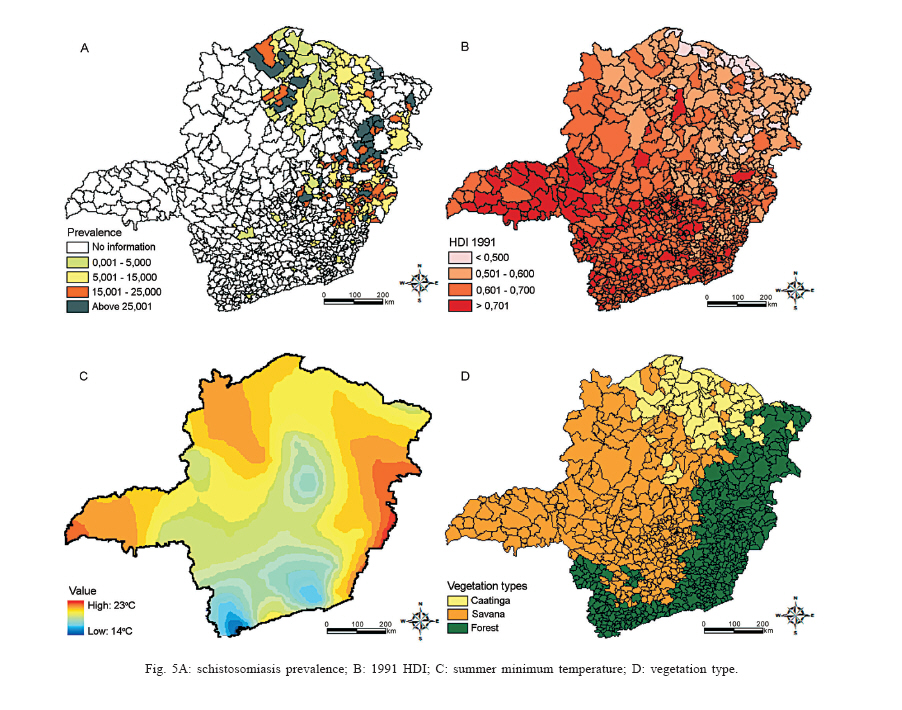
Fig.3a shows the estimated prevalence and Fig.3b its corresponding estimated standard deviation, for all municipalities of the state of Minas Gerais. Fig.4 shows the plot of the residuals, resulting from the difference between observed (Fig.1) and estimated (Fig.3a) schistosomiasis prevalence. In this Figure, dark colors (red and blue) represent overestimated values, light colors (cyan and magenta) underestimated ones, and in white are the municipalities with good estimative. DISCUSSION The spatial distributions of the observed prevalence and of the selected variables for the regression model are illustrated in Fig. 5. It can be seen that summer minimum temperature, 1991 human development index and vegetation types are most related with schistosomiasis prevalence. During the summer season the risk of contracting schistosomiasis increases, due to high concentrations of the snails in the drainage caused mainly by lack of sanitation, small amount of rain, high temperature, among other factors, and by the population searching for water bodies, either for drinking or as a form of minimizing the warmth. The analyses of the estimated regression function and Figs.3, 4, and 5 shows that: (i) summer minimum temperature has positive correlation with schistosomiasis prevalence, while human development index has negative correlation; (ii) the effect of summer minimum temperature over schistosomiasis prevalence is the same for all vegetation types; (iii) the effect of 1991 human development index is lower for savanna than for forest and caatinga biomes; (iv) for fixed values of summer minimum temperature and 1991 human development index, the regression models for caatinga and forest differ approximately by a factor, being the schistosomiasis in forest regions about three times higher than that for caatinga; (v) the precision (standard deviation) of the estimative are quite good for the municipalities where the prevalence data were available, but there is a tendency of decreasing when the estimative are made for far away municipalities. Therefore, even with a low coefficient of determination, it might be concluded that the joint use of geographical information systems and statistical techniques allows the determination of related factors and the delimitation of risk areas for schistosomiasis. Several other variables related to the use of the water, such as sanitation, water quality, water retention by the soil, existence of intermediate hosts, and remote sensing variables, might be tested as explanatory variables to improve the model.
Copyright 2006 Instituto Oswaldo Cruz - Fiocruz The following images related to this document are available:Photo images[oc06172f5.jpg] [oc06172f4.jpg] [oc06172f3.jpg] [oc06172f2.jpg] [oc06172f1.jpg] |
| |||||||||
