 |
| About Bioline | All Journals | Testimonials | Membership | News |
|
||||||
|
||||||
Memórias do Instituto Oswaldo Cruz, Vol. 102, No.2, March 2007, pp. 169-174 Genetic relationship of diarrheagenic Escherichia coli pathotypes among the enteropathogenic Escherichia coli O serogroup Silvia Y Bando, Luiz R Trabulsi†, Carlos A Moreira-Filho+ Departamento de
Imunologia, Instituto de Ciências Biomédicas, Universidade de
São Paulo, Av. Prof. Lineu Prestes, 1730, 05508-900 São Paulo,
SP, Brasil Financial support: Fapesp grant 99/12695-4 Received 6 October
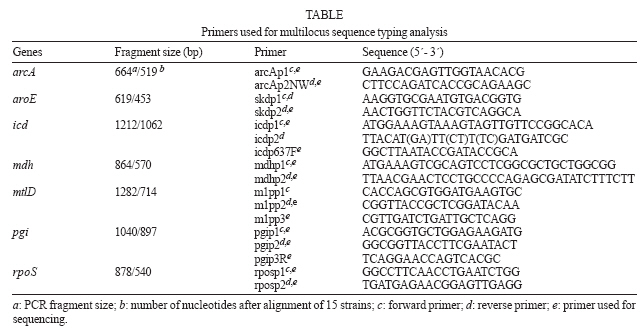
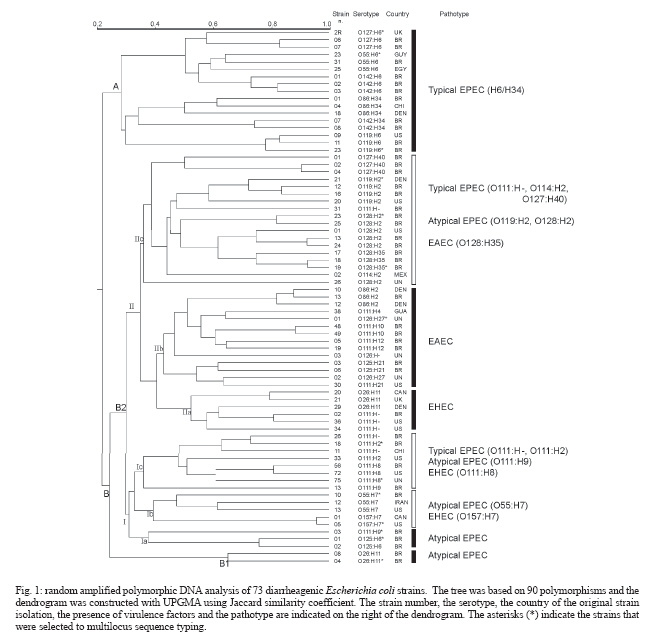
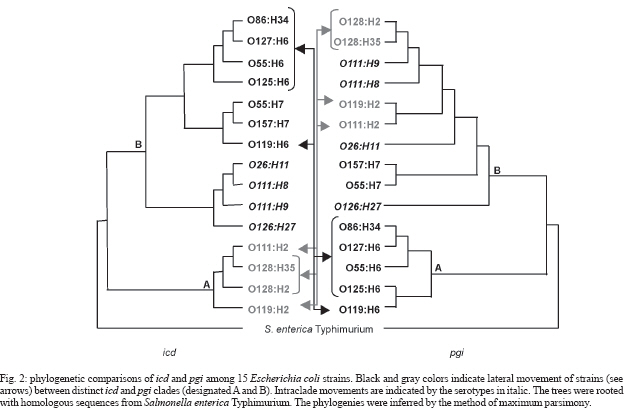
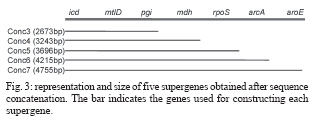
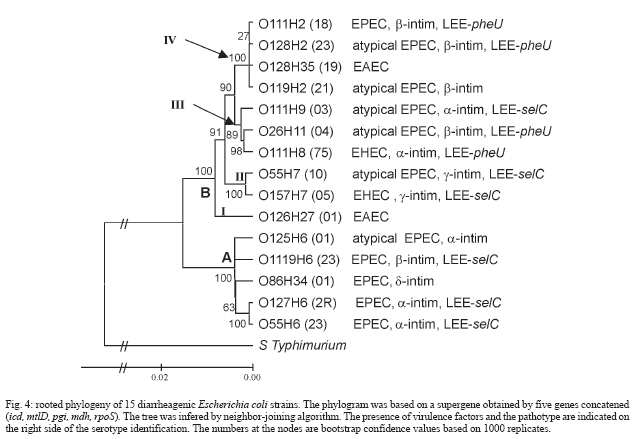
2006 Code Number: oc07030 The genetic relationship among the Escherichia coli pathotypes was investigated. We used random amplified polymorphic DNA (RAPD) data for constructing a dendrogram of 73 strains of diarrheagenic E. coli. A phylogenetic tree encompassing 15 serotypes from different pathotypes was constructed using multilocus sequence typing data. Phylogram clusters were used for validating RAPD data on the clonality of enteropathogenic E. coli (EPEC) O serogroup strains. Both analyses showed very similar topologies, characterized by the presence of two major groups: group A includes EPEC H6 and H34 strains and group B contains the other EPEC strains plus all serotypes belonging to atypical EPEC, enteroaggregative E. coli (EAEC) and enterohemorrhagic E. coli (EHEC). These results confirm the existence of two evolutionary divergent groups in EPEC: one is genetically and serologically very homogeneous whereas the other harbors EPEC and non-EPEC serotypes. The same situation was found for EAEC and EHEC. Key words: clonal structure - genetic relationship - diarrheagenic Escherichia coli -random amplified polymorphic DNA - multilocus sequence typing Neter et al. (1955) proposed the term enterophatogenic Escherichia coli (EPEC) O serogroups to designate E. coli antigenic O groups associated with diarrhea. World Health Organization (WHO 1987) defined as EPEC O serogroups the following E. coli antigenic O groups: O26, O55, O86, O111, O114, O119, O125, O126, O127, O128, O142, O158. It was initially accepted that these serogroups comprised only EPEC and due to this belief these organisms were routinely identified by their O antigens only. Studies initiated in the early 1990s, and over the following years, revealed that the EPEC O serogroups would contain not only EPEC but also enterohemorrhagic E. coli (EHEC) and enteroaggregative E. coli (EAEC) (Campos et al. 1994, Rodrigues et al. 1996, Scotland et al. 1996, Valle et al. 1997, Gonçalves et al. 1997, Trabulsi et al. 2002, Ghilardi et al. 2003, Campos et al. 2004). It was further verified that there were two classes of EPEC: one harboring the EPEC adherence factor (EAF) plasmid and the other without this plasmid. The first class was designated typical EPEC and the second atypical EPEC (Kaper 1996, Trabulsi et al. 2002). It is now well established that the EPEC O serogroups contain EPEC (typical and atypical), EHEC and EAEC, and also that the four pathotypes are characterized by distinct serotypes (Campos et al. 2004). The clonal structure and genetic relationships of EPEC O serogroups pathotypes have already been studied by other authors (Whittam & McGraw 1996, Reid et al. 2000), although on the basis of an incomplete list of this pathotype. In this study we included a representative number of strains of typical and atypical EPEC, EHEC, and EAEC of different origins, all previously identified in regard to serotypes and virulence characteristics. This study aimed at a better understanding of the genetic relationships and evolutionary patterns within diarrheagenic E. coli pathotypes. The objectives of this work were: (a) to evaluate the genetic diversity of diarrheagenic E. coli by dendrogram constructed by random amplified polymorphic DNA (RAPD) data, (b) to perform a phylogenetic analysis of 15 diarrheagenic E. coli serotypes based on multilocus sequence typing (MLST) using five genes that codify metabolic enzymes: aroE, icd, mdh, mtlD, and pgi, and regulation proteins: arcA and rpoS, (c) to validate the RAPD data on clonality analyses comparing the dendrogram and phylogram topology. MATERIALS AND METHODS Bacterial strains - We studied 73 different O EPEC serogroups categorized in serotypes and pathotypes. E. coli O157:H7 strains do not belong to the EPEC O serogroups but were included for comparison purposes. These strains belong to the E. coli collection kept at Instituto Butantan (São Paulo, Brazil), isolated in different countries. RAPD - All 73 strains were processed according to Bando et al. (1998). Briefly E. coli strains were grown on MacConkey's agar overnight at 37ºC. A single colony was transferred to 3 ml of Luria Bertani broth and grown overnight under agitation at 37ºC. Chromosomal DNA was obtained using the Wizard Genomic DNA Purification Kit (Promega, Madison, WI, US). Each reaction was performed in a final volume of 20 μl containing 10 ng of DNA and 0,3 μM of random primer. Four random primers: OPE-16 (5´-ggtgactgtg-3´), OPK-04 (5´-ccgcccaaac-3´), OPO-06 (5´-ccacgggaag-3´), OPP-03 (5´-ctgatacgcc-3´) (Table) were used, separately, in each PCR reactions. The PCR products were electrophoresed in 1.4% agarose gel in 1x TBE (0.1 M Tris, 0.09 M boric acid and 1 mM EDTA) and the gels were stained with ethidium bromide and photographed using UV light. Dendrogram - The RAPD polymorphisms were handily determined and the statistical analysis of data was performed using the NTSYS-pc program 1.7 version (James 1992). The polymorphisms were used to construct a binary data matrix of presence and absence of bands. This matrix served to calculate the Jaccard's distance. The similarity matrix obtained was used to construct a dendrogram based on unweighted pair group method of averages (UPGMA). DNA sequencing of housekeeping genes - ifteen strains, representing the commom serotypes found in differente pathotypes, were selected for phylogenetic analysis by MLST. We analysed the following 7 housekeeping genes previously used for phylogenetic analysis of pathogenic E. coli strains (Reid et al. 2000): aerobic respiratory control protein (arcA), shikimate dehydrogenase (aroE), isocitrate dehydrogenase (icd), malate dehydrogenase (mdh), mannitol 1-phosphate dehydrogenase (mtlD), phosphoglucose isomerase (pgi), and sigma factor (rpoS). Template DNA was obtained by PCR amplification for 35 cycles as follows: 95°C for 45 s, (55 68, see Table) °C for 45 s, and 72°C for 2 min, with an initial denaturating step of 95°C for 5 min and final extension step of 72°C for 7 min. The primers (Table) used were previously designed by Reid et al. (1999). The amplification products were purified using Concert PCR Purification Kit (Life Technologies, CA, US). The concentration was determined by agarose gel electrophoresis. Cycle sequencing was performed with Cycle Sequencing Cy-5 Dye Terminator Kit (Amersham Biosciences, Uppsala, Sweden). Sequencing gel were run on an ALFexpress automated sequencer (Amersham Biosciences, Uppsala, Sweden). Phylogenetic analysis -Multiple-sequence alignment of the nucleotide sequences was performed with GeneDoc v.2.6.01 (Nicholas et al. 1997). Phylogeny was based on a supergene constructed by concatenating the five genes and the tree was rooted with the homologous sequences from Salmonella enterica Typhimurium extracted from the GenBank database. Phylogenetic trees were inferred by the neighbor-joining algorithm and by the method of maximum parsimony using PHYLIP v.3.5c (Felsenstein 1989). RESULTS Evaluation of genetic diversity using RAPD data - The dendrogram in Fig. 1 illustrates the clonal structure and the genetic relationships of the 73 strains here studied. The strains are distributed through several groups related at different similarity levels. Two main divergent clusters, A and B, are evident. Cluster A is genetically homogeneous containing only typical EPEC strains which have the H6 and H34 antigens and belong to serogroups O55, O86, O119, O127, and O142. Cluster B is very heterogeneous containing EPEC but also atypical EPEC, EAEC, and EHEC distributed through four subclusters. In contrast to cluster A, cluster B is more complex and includes the remaining 56 strains. This group can be divided in subgroups B1 and B2. B1 contains only two atypical EPEC strains of serotype O26:H11. Group B2 comprises 6 subclusters (Ia, Ib,Ic IIa, IIb, IIc) encompassing the four pathotypes studied here. Subclusters Ia, IIa and IIb are genetically homogeneous and contains atypical EPEC, EHEC, and EAEC, respectively. Subclus-ters Ib, Ic, and IIc are heterogeneous: Ib is composed of EHEC and atypical EPEC, Ic includes typical and atypical EPEC and EHEC strains of O111 serogroup, and IIc is composed of typical and atypical EPEC and EAEC, most of them possessing the H2 antigen. Variability of E. coli housekeeping genes - Multiple-sequence alignment of nucleotide sequences and of the inferred amino acid sequences showed a total of 262 variable sites were found among 4755 nucleotides, 40 of which involved amino-acid replacements. Fig. 2 shows the phylogenetic comparison between the phylogenies based on icd and pgi genes. In both trees two major clusters, A and B, were formed. However nine strains occupied different clade positions depending on the gene under analysis. Besides these interclade transpositions, four intraclade differences were also observed. Brown et al. (2001) had already observed this phylogenetic discordance when investigating the horizontal transfer of mutS alleles among E. coli strains. Phylogenetic analysis - Rooted trees were constructed using the neighbor-joining algorithm based on four different concatened genes (Fig. 3). Only the phylogeny based on the supergene containing five genes is showed in Fig. 4, because the others trees showed lower bootstrap values. This phylogram (Fig. 4) showed two divergent groups in 15 strains belonging to different pathotypes. Cluster A includes EPEC and atypical EPEC (H6/H34 strains), and cluster B contains other serotypes (H2/H9/H7/H11 strains) of EPEC and atypical EPEC, EHEC/STEC, and EAEC. The cluster B can be divided in four subclusters: I, II, III, and IV. These subclusters distributed EHEC in two different groups: subcluster II includes O157:H7 (EHEC) and atypical EPEC O55:H7 serotype; subcluster III contains other EHEC and atypical EPEC serotypes. A similar division was observed within EAEC strains: one group forms an exclusively EAEC branch (subcluster I) and the other encompasses some EPEC and atypical EPEC strains (subcluster IV). DISCUSSION RAPD is largely used for genetic variability analyses. On the other hand, there are some limitations for the use of RAPD data on phylogenetic inferences: the lack of data on coding regions, or on the homology of size-comparable bands, renders difficult to evaluate genetic distances. RAPD has been more used for genetic diversity evaluation and isolate characterization. In the present work the efficiency of RAPD for assessing clonality was demonstrated. The dendrogram and the phylogenetic tree of EPEC O serogroups strains based on RAPD and MLST data are very similar. These results indicate a correspondence between genetic variability and phylogenetic relationships, but RAPD allows the study of a large number of samples at a low cost. Both analyses (Figs 1, Fig. 4) showed that EPEC harbor two divergent groups, one is genetically homogeneous (cluster A, corresponding to the EPEC1 group of Whittam & McGraw 1996) and the other is very heterogeneous (cluster B). Whittam and McGraw (1996) conducted a genetic study on EPEC and EHEC strains based on MLEE. They proposed that EPEC strains could be divided in two clonal groups designated EPEC 1 and EPEC 2. EPEC 1 would be composed of serotypes with the H6/H34 antigens and EPEC 2 of serotypes possessing the H2 antigens. In both clonal groups the H antigens are associated with different O antigens. Our results confirmed the findings of Whittam and McGraw (1996) only in regard to EPEC 1. We found that strains classified as EPEC 2 by Whittam and McGraw are actually distributed in two clonal groups, here called Ic and IIc. Moreover, these two subclusters contain some non-H2 serotypes and other pathotypes besides EAEC and EHEC. It is interesting to note that serotype O125:H6 (atypical EPEC) occupies distinct clusters in the dendrogram and in the phylogram. Probably O125:H6 genomic variability is better assessed by RAPD and this serotype is genetically close to atypical EPEC. Strains of different serotypes and pathotypes appear in cluster B (Figs 1,4). However, it is possible to identify some grouping among these strains: B1 contains atypical EPEC strains of serotype O26:H11, distantly related to the EHEC strains of the same serotype. This finding confirms that the O26:H11 atypical EPEC and EHEC belong to distinct clonal groups, as previously demonstrated (Peixoto et al. 2001). Moreover EHEC and EAEC pathotypes are divided in two divergent groups and EPEC and atypical EPEC strains are almost evenly distributed through the subclusters. This pattern was previously observed in analyses using MLEE (Whittam & McGraw 1996, Czeczulin et al. 1999) and MLST (Reid et al. 2000). These data suggest that genetically homogeneous groups (like A and IIb clusters) suffered less recombination events involving strains from other pathotypes. On the other hand, the strains grouped in the clusters B (Fig. 2) experienced many recombination and horizontal transfer events. Moreover, these strains occupied different clade positions within seven phylogenies (based on single housekeeping gene) suggesting the occurrence of many interclade recombinations or/and horizontal transfer among these strains. Regarding virulence factors, EPEC, atypical EPEC, EHEC strains possess distinct intimins (a, b, g and d) and different insertion regions (selC ou pheU) for LEE, or Locus of Enterocyte Effacement (Adu-Bobie et al. 1998, Sperandio et al. 1998, Trabulsi et al. 2002). This suggests that gain or loss of virulence elements, like phage (STX), plasmids (EHEC, EAF) and pathogenic islands (LEE), occurred in parallel among diarrheagenic E. coli strains. Moreover, the capacity of some EPEC and atypical EPEC strains for expressing potential virulence factors is not encoded in the LEE region (Trabulsi et al. 2002), like EAST1 (heat-stable toxin 1 of EAEC), CDT (cytolethal distending toxin) and E-hly (EHEC hemolysin), suggesting again that these virulence elements are transferred horizontally and in parallel among different strains. It is interesting to note that strains belonging to the same pathotype isolated in different countries grouped toghether suggesting one more time the parallel transference of virulence factors. Horizontal transfer is supported by two other works (Pupo et al. 1997, Boyd & Hartl 1998) on the phylogenetic relationship between pathogenic and non-pathogenic E. coli, both claiming for the non-existence of clonal lineages within E. coli. In conclusion, the typical and atypical EPEC, EHEC, and EAEC belonging to the EPEC O serogroups correspond to different genetic clusters, as determined by RAPD analyses. Some of these clusters are very homogeneous, as the H6/H34 typical EPEC and the EAEC groups, resembling clonal groups. However, most of the other groups are heterogeneous and include two or more pathotypes. The heterogeneous clusters seem to group according to their antigenic characteristics rather than to their virulence traits. It seems unlikely that a sole specific lineage transferred virulence factors to their descendents, thus originating a clonal group of new pathotype strains. However, some strains in different serotypes probably have a favorable genetic background for recombination and acquisition of virulence elements through horizontal transfer. More genetic studies are required to identify the genetic mechanisms allowing some pathogenic E. coli to retain a high potential for recombination. REFERENCES
Copyright 2007 Instituto Oswaldo Cruz - Fiocruz The following images related to this document are available:Photo images[oc07030f4.jpg] [oc07030f3.jpg] [oc07030t1.jpg] [oc07030f1.jpg] [oc07030f2.jpg] |
| |||||||||
