 |
| About Bioline | All Journals | Testimonials | Membership | News |
|
||||||
|
||||||
Memórias do Instituto Oswaldo Cruz, Vol. 102, No.3, June 2007, pp. 255 - 262 A population genetics study of Anopheles darlingi (Diptera: Culicidae) from Colombia based on random amplified polymorphic DNA-polymerase chain reaction and amplified fragment lenght polymorphism markers Ranulfo González/+, Richard Wilkerson*, Marco Fidel Suárez, Felipe García, Gerardo Gallego**, Heiber Cárdenas, Carmen Elisa Posso, Myriam Cristina Duque** Facultad
de Ciencias y Facultad de Salud, Universidad del Valle, Cali, Colombia
*Department of Entomology, Walter Reed Army Institute of Research,
Silver Spring, MD, US **International Center of Tropical Agriculture,
Cali, Colombia Financial support: National Program of Science and Technology of Colciencias (Code No. 1106-04-168-95), Universidad del Valle, Cali, Colombia Received
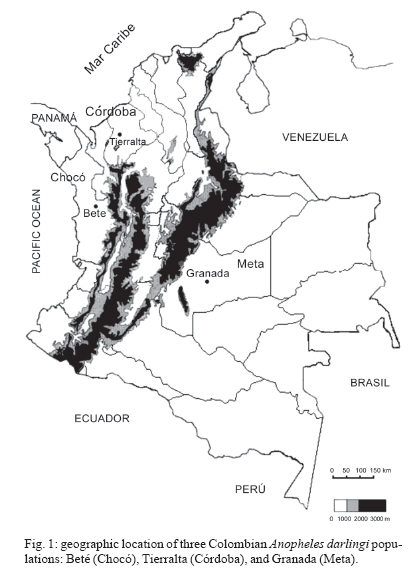
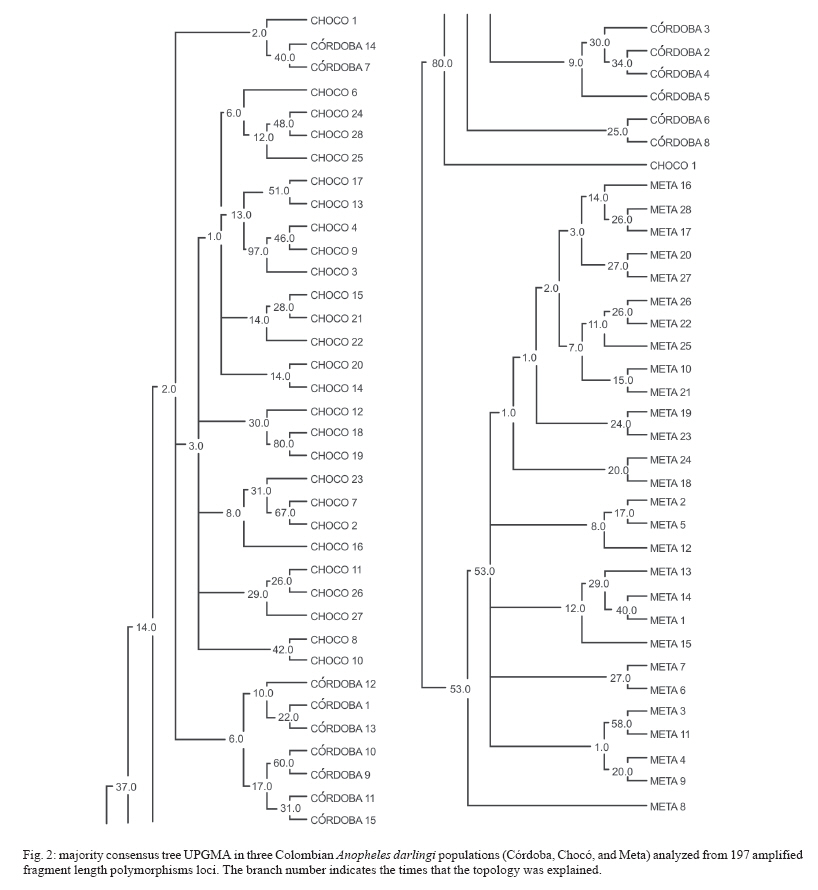
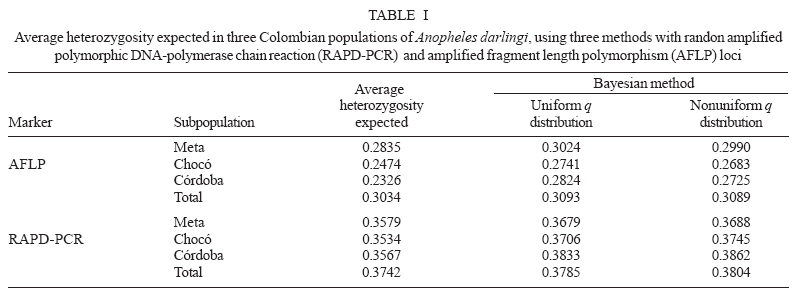
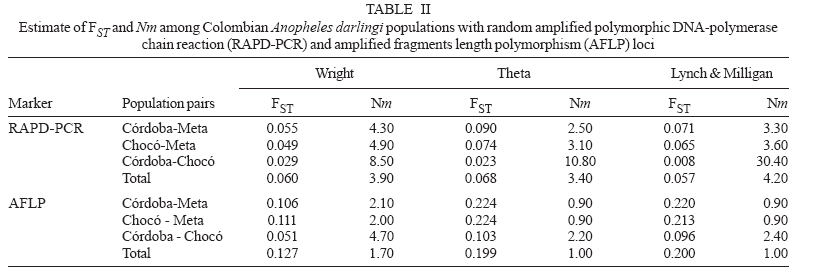
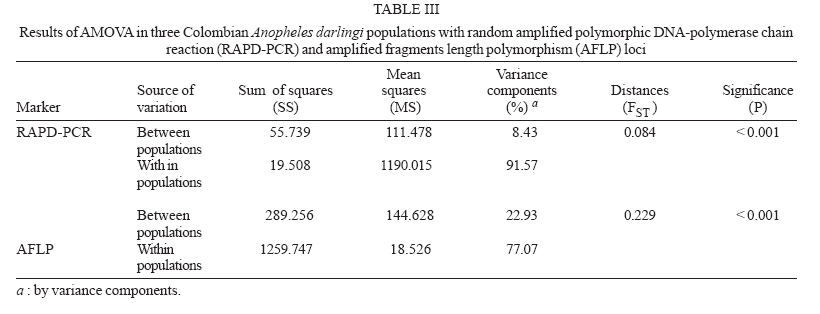
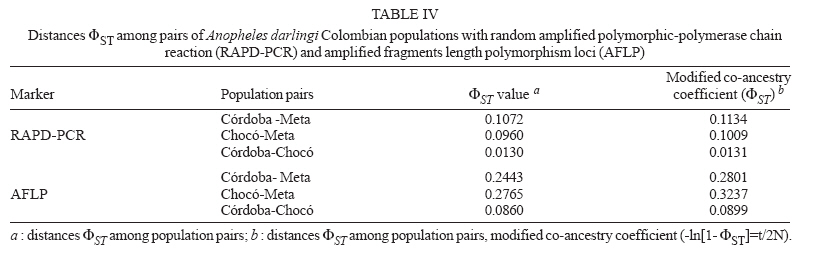
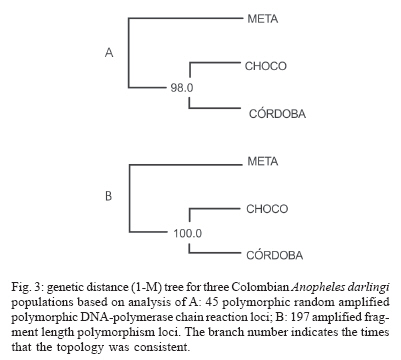
19 June 2006 Code Number: oc07046 The genetic variation and population structure of three populations of Anopheles darlingi from Colombia were studied using random amplified polymorphic markers (RAPDs) and amplified fragment length polymorphism markers (AFLPs). Six RAPD primers produced 46 polymorphic fragments, while two AFLP primer combinations produced 197 polymorphic fragments from 71 DNA samples. Both of the evaluated genetic markers showed the presence of gene flow, suggesting that Colombian An. darlingi populations are in panmixia. Average genetic diversity, estimated from observed heterozygosity, was 0.374 (RAPD) and 0.309 (AFLP). RAPD and AFLP markers showed little evidence of geographic separation between eastern and western populations; however, the FST values showed high gene flow between the two western populations (RAPD: FST = 0.029; Nm: 8.5; AFLP: FST = 0.051; Nm: 4.7). According to molecular variance analysis (AMOVA), the genetic distance between populations was significant (RAPD:FST = 0.084; AFLP:FST = 0.229, P < 0.001). The FST distances and AMOVAs using AFLP loci support the differentiation of the Guyana biogeographic province population from those of the Chocó-Magdalena. In this last region, Chocó and Córdoba populations showed the highest genetic flow. Key words: amplified fragment length polymorphism - Anopheles darlingi - genetic diversity - malaria vectors - random amplified polymorphic DNA - polymerase chain reaction - Colombia Anopheles darlingi is recognized as the most anthropophillic and endophagous species of Anopheles in the Americas (Fleming 1986), the primary malaria vector in the Neotropics (Conn et al. 2001), and is considered the most important malaria vector in the Amazon Basin (Conn et al. 1999). It is most frequently found in the hot and humid lowlands, with a discontinuous distribution from Southern Mexico to Northern Argentina, but not reported in Costa Rica, Nicaragua, and Panama (Linthicum 1988, Manguin et al. 1999). In Colombia, it is found up to an altitude of 450 m in the premontane zone of the Andes (Fleming 1986), which is characterized by three large mountain ranges and variety of geographic features (Fig. 1) that clearly separate the eastern from the western regions and possibly limit the free gene flow between these regions. Based on the original description of An. darlingi by Root (1926), phenotypic variation and differences in hematophagous behavior have contributed to generating a certain degree of confusion regarding its specific taxonomic status (Galvão et al. 1937, Galvão & Barreto 1938, Galvão 1940, Linthicum 1988, Rubio-Palis 1998). Given the foregoing and the great importance of this species, a series of population studies were conducted, using morphological and molecular tools (Manguin 1999), oriented toward clarifying both taxonomic status and genetic structure within its range of distribution. Lounibos and Conn (2000) recently reviewed the use of molecular markers in the study of the ecology and genetics of An. darlingi. Its biting behavior was summarized by Rosa-Freitas et al. (1992), and Zimmerman (1992) demonstrated great variability in post-blood feeding/resting behavior. Depending on the region of study, one, two, and even three peaks of major biting activity have been observed, as well as variation in the extension or time interval of peak hematophagous activity. Hudson (1984) and Klein and Lima (1990) suggest that this indicates the existence of a species complex. Nevertheless, from morphological studies did not reveal substantial differences among populations throughout the area of distribution, including populations in isolated zones (Linthicum 1988, Rubio-Palis 1998, Manguin et al. 1999). According to Linthicum (1988) the diagnostic characters are very constant, even for the Guatemalan and Honduran populations and interpopulational variation is almost equal to intrapopulational variation. Additionally, several studies on this species have shown great genetic population variability (Kreutzer et al. 1972, Steiner et al. 1982, Tadei et al.1982, Rosa-Freitas et al. 1992, Freitas-Sibajev et al. 1995, Mendes dos Santos et al. 1996, Rafael & Tadei 1998, 2000, 1999, Manguin et al. 1999, Conn et al. 1999, Malafronte et al. 1999, Conn 2001). Mendes dos Santos et al. (1996) analyzed 11 enzymes in four Amazonian populations and found variation with respect to the number of alleles and polymorphism in all the studied populations. Later, Mendes dos Santos et al. (1999), analyzed 19 isozyme loci in four populations from the Amazon River Basin and found that they were genetically similar, but that the one from the central Amazon region had high polymorphism in comparison to the marginal populations, which were primarily monomorphic. Using a combination of morphological data, random amplified polymorphic DNA-polymerase chain reaction (RAPD-PCR), isozymes and internal transcribed spacer (ITS2) sequences in samples from Central and South America, Manguin et al. (1999) found that although the fragments produced by RAPD-PCR showed evidence of geographic partition, all populations were separated by relatively short genetic distances. According to Conn et al. (1999), the heterogeneity observed in this species' biting behavior (Rosa-Freitas et al. 1992), variation in size (Lounibos et al. 1995, Charlwood 1996), and geographic differences in blood seeking periodicity can be partly explained by population structure and gene-flow patterns that could also affect the species' vector capacity. Analyzing the ITS2 sequences from five Brazilian states, Malafronte et al. (1999) found that they were almost identical. However, the population from the Southeast (Dourado, state of São Paulo) had 4-5% divergence with respect to the others. This is in contrast with findings using an mtDNA marker (Conn et al. 1999), in which nine collection sites were compared, including Dourado in Brazil, with no substantive differences detected in haplotype or nucleotide diversity. In Colombia, according to González (2001), An. darlingi showed morphological variation and different biting behavior between populations from the Chocó-Magdalena biogeographic region and Guyana. In this study, based on observed polymorphism, using two dominant markers, RAPD-PCR and amplified fragment length polymorphism (AFLP), we analyzed three populations separated by a geographic gradient in order to determine whether genetic structure exists in Colombian An. darlingi populations. MATERIALS AND METHODS Collection, handling and identification of An. darlingi - The analysis was carried out using samples of An. darlingi collected from three locations in Colombia: Beté (06o 00' 00'' N and 76o 46' 60'' W) in the municipality of Medio Atrato, Chocó Province; GranadA (03o 32' 19'' N and 73o W) in the municipality of Granada, Meta Province; and Tai in the municipality of Tierralta, Córdoba Province (Fig. 1). Mosquito samples were collected using human bait following standard WHO (1975) recommendations. They were identified morphologically (Linthicum 1988) and preserved in 1.5 ml-microcentrifuge tubes at -70oC. DNA extraction and RAPD-PCR and AFLP conditions - DNA isolation was done according to Coen et al. (1982), modified as in Romans (Black IV & DuTeau 1997). The samples were analyzed using RAPD-PCR and AFLP markers. RAPD-PCR - Specific amplification reaction conditions were standardized in order to obtain well-defined, consistent and reproducible banding patterns: 1 ng/µl DNA, 1X buffer, 2.5 mM MgCl2, 0.2 mM dNTPs, 0.2 mM oligonucleotides, 1U Taq, adjusted to 25 µl with H2O. The RAPD amplification was done with a seven-step profile (initial denaturation cycle at 94oC for 3 min; 35 cycles at 94oC for 30 s, 35oC for 45 s and 72oC for 1 min 30 s. The final extension was done at 72oC for 5 min). Followed by a soak temperature of 4oC. The amplifications were done in a MJ Research PTC-100 plate thermocycler. Amplification products were visualized on 1.5% agarose gels according to the method of Sambrook et al. (1989). A total of 75 RAPD-PCR 10-mer oligonucleotides from Operon Technologies® were first tested on three individuals from each locality. Negative controls were used in all reactions in order to detect artifacts and to verify the amplification reliability. Six RAPD-PCR primers (A05, A13, B05, B12, B14, W09) were chosen for testing 64 samples (24 from Chocó, 26 from Meta, and 14 from Córdoba). The location selection criteria was based on separation by distance and the presence of the Andean mountain range as a geographic barrier (Fig. 1). Samples were run in gels at 300 V in a horizontal electrophoresis chamber (Life Technologies Inc.) for approximately 1 h. Lambda DNA, digested with Pst I, was used as the molecular-size standard in each run. The banding patterns were visualized with ethidium bromide (0.8 µg/ml). Gels and banding patterns were recorded with EagleEye II™ (Stratagene) equipment. AFLP - An analytical system II kit (GIBCO BRL) was used. Sixteen AFLP primer combinations were iniatilly screened and two combinations were chosen from those: (E-AC/M-CAA and E-AG/M-CAG). Preamplification was done with a 20-cycle PCR (30 s at 94oC, 60 s at 56oC, and 1 min at 72oC, soak at 4oC). The radioactive labeling of primer EcoR I (selected) was done with dATP[γ-32P]. The selective AFLP amplification was done with an 11-step profile (initial cycle at 94oC for 30 s, 65oC for 30 s, and 72oC for 1 min; 12 cycles at 94oC for 30 s, 65oC for 30 s (lowering 0.7oC per cycle each time), and 72oC for 1 min; and 23 cycles at 94oC for 30 s, 56oC for 30 s, and 72oC for 1 min). Both the preamplification and selective amplification were done in a MJ Research PTC-100 thermocycler. Seventy samples (28 from Chocó, 27 from Meta and 15 from Córdoba) were tested. Amplification products were separated on 6% polyacrylamide vertical gels at constant current (~ 100 W and approximately 1800 V). The gel was placed on Whatman 3 MM, covered with vinyl film, dried and exposed to x-ray film, developed and kept for further analyses. Data from the RAPD and AFLP banding patterns from each sample were coded in a binary data matrix. Analysis of the RAPD and AFLP patterns - A distance matrix (1-M) was generated with the RAPDPLOT program of Black IV (1993, 1995). This matrix was estimated from the fraction of pairings (M), using the formula M = NAB/NT, where NAB is the total number of pairings between individuals A and B (for both the absent or present bands) and NT, the total number of "loci" (fragments) in the study. These were then used to generate the respective sets of 100 matrices read by PHYLIP 3.5C (Felsenstein 1993). Each matrix of the set was collapsed, using "Neighbor joining" algorithm with the UPGMA method for generating dendrograms from which the definitive tree was obtained by means of the strict-consensus and majority-rule options Black IV (1993, 1995). In order to analyze the consistency with which the RAPD and AFLP datasets supported the phenetic ratio between the possible taxa, a bootstrap analysis of 100 pseudoreplicates was run, using the RAPDBOOT 1.0 program (Black IV 1995). Population genetics analysis - Genetic variation and the genetic structure of the three An. darlingi populations were assessed by calculating heterozygosity, the FST statistics, migration/generation rates (Nm), molecular analysis of variance (AMOVA) and the genetic distances. Population diversity and genetic differentiation were analyzed using the allelic RAPD and AFLP allele frequencies. Three methods were used: the traditional square root of q (Apostol et al. 1996), the Lynch and Milligan (1994) method, and a Bayesian method proposed by Zhivotovsky (1999). Because of the difficulties of obtaining heterozygosity from dominant markers (Black IV 1993, 1995, Black IV & Munstermann 1996, Taba-chnick & Black IV 1996, Yan et al. 1999), we calculated it according to Black IV and Munstermann (1996) and Apostol et al. (1996), who take into account the absent bands (q) and estimate of the null allele frequency qj(i) at locus i (I = 1,...,L) in populations j(j = 1,...,r) as: qj(I) = √xj (i), where xj (i) is the null recessive homozygotes frequency in population j at locus i. The FST values and the Nm migration rates were calculated using the RAPDFST program (Black IV 1995), assuming RAPD locus and AFLP dominance and a population at Hardy-Weinberg equilibrium. The RAPDFST program estimates the FST from the formula proposed by Wright (1951). It also estimates the effective migration rate (Nm) and the population structure (θST). Genetic variation components within and among populations were estimated by AMOVA using WINA-MOVA 1.5 (Excoffier et al. 1992) and AMOVA-PREP 1.01 (Miller 1998) programs. The ΦST value, which is analogous to FST, represents the population structure. Significance levels and the F values were computed 1000 times by nonparametric exchange procedures. In addition, the genetic distances between the populations were analyzed with the RAPDDIST 1.0 program (Black IV 1997). Based on each RAPD or AFLP data set, a distance matrix (1-S) was generated (Nei's similitude, 1972); S = 2NAB /(NA + NB), where NAB is the number of fragments that individuals A and B share in common, NA is the number of fragments from individual A and NB, the number of fragments from individual B. The consistency with which the data set supported the estimated ratios between the populations was evaluated by means of a bootstrap of 100 pseudoreplicates as described earlier. RESULTS In the three populations, the six RAPD oligos (A05, A13, B05, B12, B14, W09) produced 45 polymorphic bands, while the two AFLP primer combinations (E-AC/M-CAA and E-AG/M-CAG) produced 197. Analysis of the RAPD and AFLP patterns - The cluster analyses with the RAPD markers using the RAPDPLOT (Black IV 1993), based on two genetic distance matrices (1-M and 1-S) and the subsequent bootstrapping, showed different individuals clustering degrees from the three populations analyzed (Chocó, Meta, and Córdoba) (cluster not presented). The low levels of probability obtained in these clusterings with AFLPs do not indicate a significant geographic partition (Fig. 2). Population genetics analyses - Both the RAPD and AFLP patterns revealed great genetic diversity (Nei 1972). The expected average heterozygosity is presented in Table I. The average values ranged from 0.3534 to 0.3862 throughout the 45 RAPD loci and from 0.2326 to 0.3093 throughout the 197 AFLP loci. Population genetic structure - The results of the Wright's estimate (1951) and Lynch and Milligan's (1994) FST and theta indices, using the data from RAPD loci, ranged from 0.023 to 0.090; while the AFLP data ranged from 0.051 to 0.224 (Table II). These statistics based on AFLP data were approximately double of those obtained with RAPD data. Both markers showed the same trend; that is, the FST values for population pairs using the RAPD and AFLP data, respectively, had higher values for Chocó-Meta (RAPD = 0.055-0.090; AFLP = 0.106-0.224) and Córdoba-Meta (RAPD = 0.049-0.074; AFLP = 0.111-0.224) in comparison with those for Chocó-Córdoba (RAPD = 0.008-0.029; AFLP = 0.051-0.103). Using the RAPD markers, the three gene flow estimators showed greater flow among the three populations (Nm = 2.5-30.4) than with the AFLP markers (Nm = 0.9-4.7) (Table II). With both markers it was observed that there was greater gene flow between Chocó and Córdoba. Similarly, the AMOVA for both sets of markers produced higher ΦST values for the analyses with AFLP data (Table III). The percent variation explained on the basis of the variance components also showed appreciable differences between the two types of markers: 8.4 and 23% for RAPD and AFLP, respectively. Despite there being high values of intrapopulation variation (92 and 77% for RAPD and AFLP, respectively), a significantly high interpopulation variance was detected for both markers (p < 0.001). The ΦST calculated with the AFLP data set was similar to the other FST statistics calculated (Table IV). On the other hand, the estimators ΦST between population pairs and the modified coancestry coefficient showed once again that the populations from Chocó and Córdoba had greater genetic distances with respect to the population from Meta. In confirmation of the foregoing, the alleles frequencies were consistently different for a large number of loci from evaluated populations. When calculating Nei's (1972) genetic distances between populations using both data sets, with a bootstrapping of 100 pseudoreplicates, the consensus tree showed a greater genetic similarity between the populations from Chocó and Córdoba than between Meta and Chocó or Meta and Córdoba (Fig. 3). DISCUSSION The results based on the cluster analyses, especially for RAPD loci, showed that the Colombian An. darlingi populations are panmitic. Similarly, based on the information of five RAPD-PCR primers, Manguin et al. (1999), demonstrated evidence of geographic partitioning among the analyzed populations, however, the genetic distances separation were very small and, they concluded, that the An. darlingi populations are conspecific. The values of genetic diversity obtained in this study are nearly three times greater than those observed by Manguin et al. (1999) (0.063-0.122), who used 31 isozyme loci from seven populations from throughout the range of distribution of An. darlingi. However, Mendes dos Santos et al. (1999), working with isozymes, recorded higher values with a greater observed and expected intralocus heterozygosity, respectively, in the Manaus population (Amazonas) (Ho = 0.432 ± 0.11; He = 0.375 ± 0.08) than for the population from Cachoeira Porteira, Pará (Ho = 0.236 ± 0.09; He = 0.290 ± 0.11). Although these values are similar to those obtained by us with the aforementioned markers, they are lower than those obtained using co-dominant markers (Yan et al. 1999). With data from RAPD loci of Aedes aegypti from Puerto Rico, Apostol et al. (1996) found an expected heterozygosity of 0.354, similar to that found by Posso et al. (2003) in An. nuneztovari from Colombia and by us in this study. Yan et al. (1999) discuss the variations that can occur when calculating genetic diversity depending on the marker type used. In Ae. aegypti from Trinidad and Tobago, they found that the heterozygosity observed with the RFLPs was significantly higher (0.47-0.60) than expected with the AFLP data (0.39), values considered to be fairly high. The FST calculations of Manguin et al. (1999) in the seven An. darlingi populations, obtained on the basis of 31 isozymatic loci, are comparable with those for RAPDs (0.102), but lower than those for the AFLPs in this study. Based on the Nm calculations between pairs of populations, greater gene flow was observed between the Chocó and Córdoba populations, as expected from the cluster analyses described previously; but that was apparently overestimated with the RAPD technique, given that according to its loci, the Nm values between Chocó-Córdoba were high, especially based on Lynch and Milligan's FST (1994). The differences observed in the FST, estimated with both types of markers in this study, could be explained in the same sense that Yan et al. (1999) argue. They indicate that the differences found among the Fst estimates in Ae. aegypti, when using RAPD, AFLP, RFLP, and iso-zyme markers, could be the result of differences in the mutation rate of these loci, which can be examined in Wright's (1951) FST formula: FST = 1/[1+4Ne(m+u)], where Ne is the effective size of the population, m the migration rate and u the mutation rate. Thus the FST value can be seriously underestimated if the loci mutation rates are is relatively high. RAPD loci tend to have higher mutation rates than the AFLP and rflp loci; thus the FST calculated from RAPD markers could be underestimated. On the other hand, the isozymatic markers mutation rate is generally lower than for the DNA markers so higher FST estimates can be expected. According to Slatkin and Barton (1989), the theta statistic tends to overestimate the migration rate; but with our RAPD data we observed that although theta was slightly higher than Wright's FST, it was, in any case, threefold less than that of Lynch and Milligan (1994) for the Chocó-Córdoba comparison. In the case of Lynch and Milligan's AFLP, theta and FST, the data were practically identical; the highest value was obtained with Wright's FST. In the AMOVA (Table III), we observed, that the percentage of the variance components among populations, was less with RAPD than AFLP markers. Considering that the sample size used with both markers types were approximately the same, the results differences should stem basically from the mutation rate and the number of analyzed traits (bands) (Yan et al. 1999). Based on the AFLP loci analyses, it was observed that there was an indication of geographic subdivision between the western and eastern populations, the same as for the clustering methods. Between the two western populations (Chocó-Córdoba), there were indications of a difference comparable to random mating. For both types of data, there was a high value in the intrapopulation variance component (RAPD = 0.91, AFLP = 0.77). If we consider that the populations from Chocó and Córdoba correspond to one ecoregion and Meta to a different one, the ΦST values could correspond to a structure type similar to that reported by Conn et al. (1999), based on mitochondrial DNA data from samples of An. darlingi in Bolivia, Brazil, and Venezuela. In conclusion, it is possible that the eastern and western populations of An. darlingi are genetically different. Nevertheless, given the detected differences with the two markers used, the search for the population structure should be re-analyzed, using other molecular markers such as microsatellites and mitochondrial DNA. At the same time, parameters should be measured to permit the analysis of its dispersion, its vectorial capacity and competence, as well as other factors that may contribute to defining whether the populations can be considered epidemiologically different.
ACKNOWLEDGMENTS To Dr J Tohme, International Center of Tropical Agriculture for use of the laboratory facilities, Yadira Rangel, Jan Conn, J Montoya, N Carrejo, and RE Gonzalez for their support in the manuscript critical reading. This research was performed under a Memorandum of Understanding between the Walter Reed Army Institute of Research and the Smithsonian Institution, with institutional support provided by both organizations. The material to be published reflects the views of the authors and should not be construed to represent those of the US Dept. of the Army or the Dept. of Defense. REFERENCES
Copyright 2007 Instituto Oswaldo Cruz - Fiocruz The following images related to this document are available:Photo images[oc07046t4.jpg] [oc07046t3.jpg] [oc07046f3.jpg] [oc07046t1.jpg] [oc07046f1.jpg] [oc07046f2.jpg] [oc07046t2.jpg] |
| |||||||||
