 |
| About Bioline | All Journals | Testimonials | Membership | News |
|
||||||
|
||||||
Memórias do Instituto Oswaldo Cruz, Vol. 102, No.3, June 2007, pp. 319-327 Population genetic structure of the major malaria vector Anopheles darlingi (Diptera: Culicidae) from the Brazilian Amazon, using microsatellite markers Vera Margarete Scarpassa/+, Jan E Conn* Coordenação
de Pesquisas em Entomologia, Instituto Nacional de Pesquisas da
Amazônia, Av. André Araújo 2936, 69011-970 Manaus,
AM, Brasil *Griffin Laboratory, Wadsworth Center, New
York State Department of Health, Slingerlands, NY, US Financial support: Ministério da Ciência e Tecnologia/Inpa, Brazil, National Institutes of Health (AI 40116 and AI R0154139 to JEC). This research was part of a Post-Doctoral fellowship of the first author undertaken at Conn's Lab in the Wadsworth Center, Albany, NY, US. Received
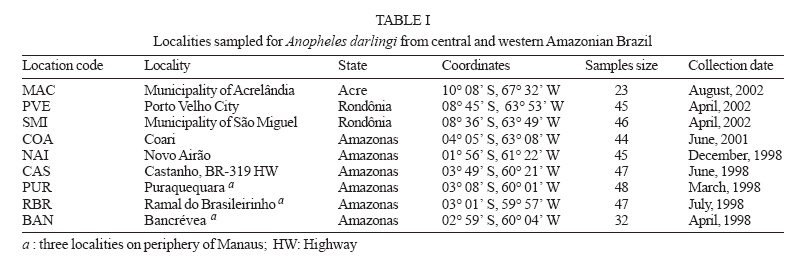
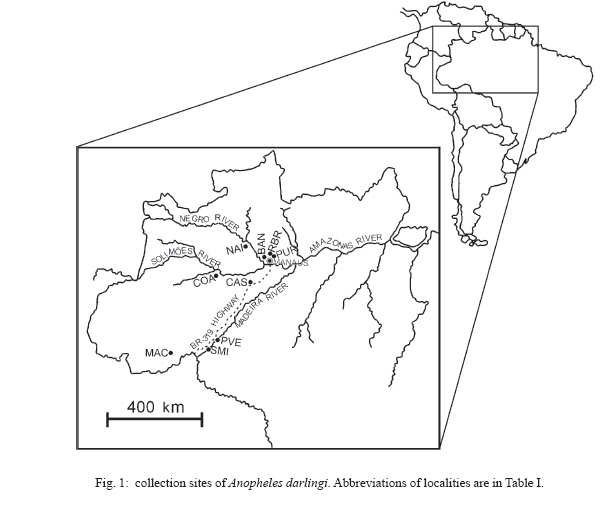
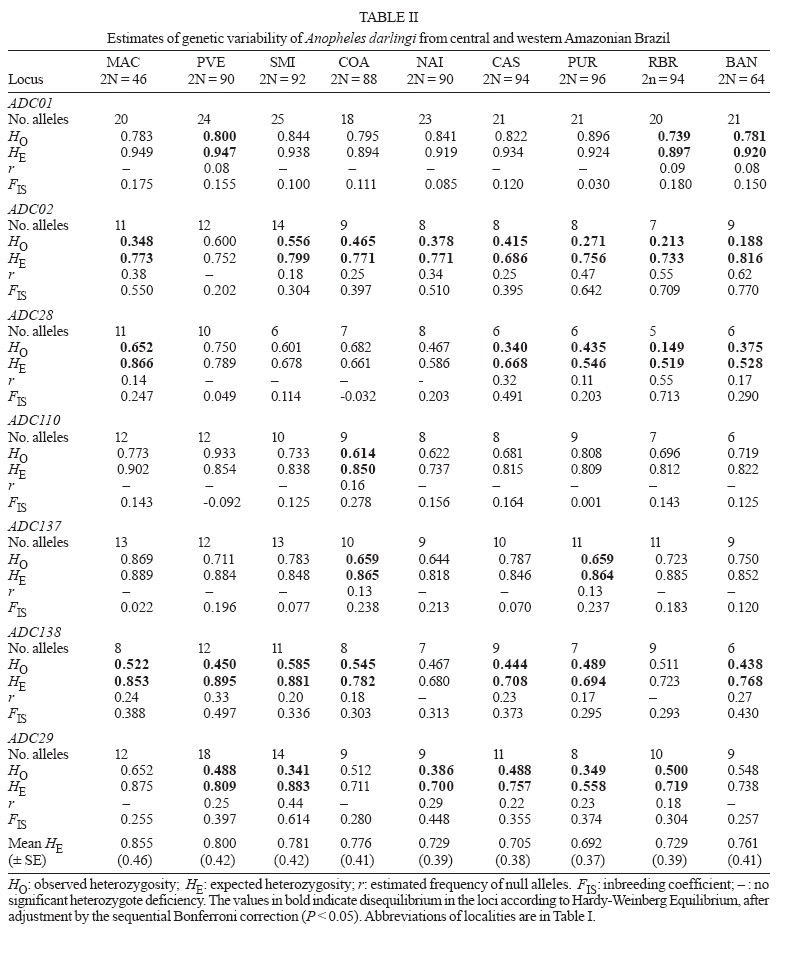
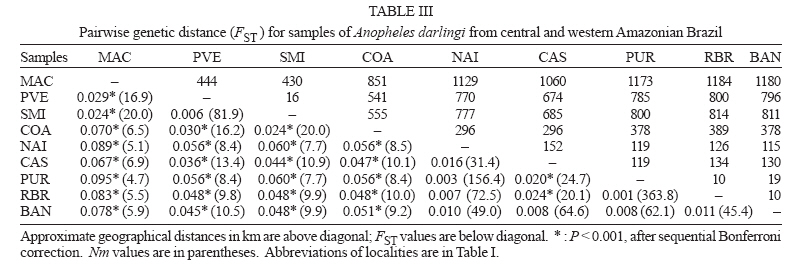
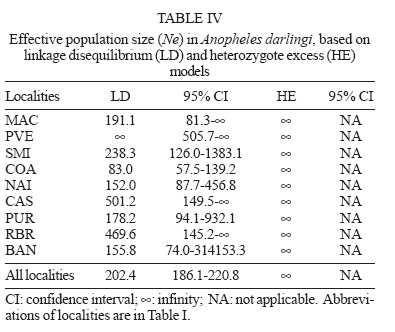
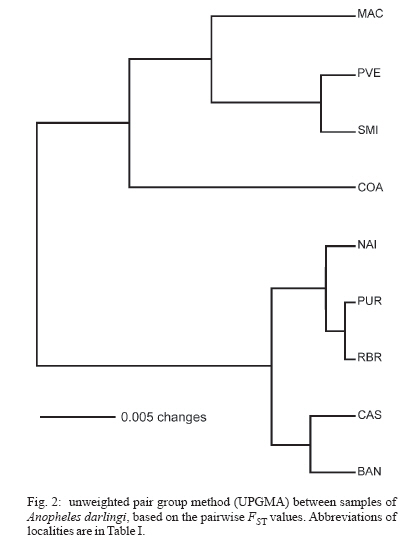
6 February 2007 Code Number: oc07054 The population genetic structure of Anopheles darlingi, the major human malaria vector in the Neotropics, was examined using seven microsatellite loci from nine localities in central and western Amazonian Brazil. High levels of genetic variability were detected (5-25 alleles per locus; HE = 0.519-0.949). There was deviation from Hardy-Weinberg Equilibrium for 59.79% of the tests due to heterozygote deficits, while the analysis of linkage disequilibrium was significant for only two of 189 (1.05%) tests, most likely caused by null alleles. Genetic differentiation (FST = 0.001-0.095; Nm = 4.7-363.8) indicates that gene flow is extensive among locations ≤ 152 km apart (with two exceptions) and reduced, but not absent, at a larger geographic scale. Genetic and geographic distances were significantly correlated (R2 = 0.893, P < 0.0002), supporting the isolation by distance (IBD) model. The overall estimate of Ne was 202.4 individuals under the linkage disequilibrium model, and ∞ under the heterozygote excess model. Analysis of molecular variance showed that nearly all variation (~ 94%) was within sample locations. The UPGMA phenogram clustered the samples geographically, with one branch including 5/6 of the state of Amazonas localities and the other branch the Acre, Rondônia, and remaining Amazonas localities. Taken together, these data suggest little genetic structure for An. darlingi from central and western Amazonian Brazil. These findings also imply that the IBD model explains nearly all of the differentiation detected. In practical terms, populations of An. darlingi at distances ≤ 152 km should respond similarly to vector control measures, because of high gene flow. Key words: Anopheles darlingi - malaria vector - microsatellites - population genetics - Brazil In Brazil after 1970, malaria was restricted to the Amazon Region, where currently more than 99% of all malaria cases are reported. In the 1980s in the Amazon, there was a progressive increase in malaria cases, as a result of extensive migration of human populations, deforestation, highway construction, uncoordinated settlements, hydroelectric dams, pipelines, and gold-mining camps. These factors affected the distribution and density of the major malaria vector Anopheles darlingi resulting in an increased burden of malaria in Amazonian Brazil (Charlwood 1996, Tadei et al. 1998, Gil et al. 2003). In 1999 more than 637,000 cases of malaria were reported, followed by a reduction for the three next years, presumably due to the intensification of malaria control programs (Funasa 2002); however, in last few years the malaria indices are on the rise again. Of the nine states that constitute the Amazon Region, Amazonas, Pará, and Rondônia showed the highest malaria incidence (together they represent 76% of all cases recorded) with infection rates of 78.6% for Plasmodium vivax and 21.40% for P. falciparum (Funasa 2002, WHO 2005). In the state of Amazonas in particular, the spread of the areas of malaria transmission, including historically low prevalence areas, has been documented. For example, in 2003, in Manaus, the state capital, an increase of ~ 250% of malaria cases was reported compared with 2002, a historically high index. This index has been attributed to especially high temperature and humidity in the tropical forest, which offers favorable conditions for breeding and longevity of vector mosquitoes; environmental variation such as changes in rainy and dry seasons; social factors, population movement to the periphery of Manaus followed by deforestation; and uncoordinated settlements and precarious dwellings, providing contact between humans and vectors (Tadei et al. 1998, MS 2003, Susam/Devis 2004, WHO 2005). An. darlingi is the major malaria vector in Brazil (Rachou 1958) and the most anthropophilic and efficient malaria vector in the Brazilian Amazon (Deane et al. 1948, Tadei et al. 1998, Gil et al. 2003). It is also a significant vector in other countries of its distribution such as Colombia, Peru, and Suriname (Rozendaal 1990, Olano et al. 2001, Vittor et al. 2006). Because of its importance as a human malaria vector, geographic populations of An. darlingi have been the subject of several studies. Polytene chromosome analysis revealed high polymorphism in An. darlingi, with fixed inversions between samples from Southeastern and Northern Brazil, and a high frequency of heterozygote inversions detected in Northern Brazil (Kreutzer et al. 1972, Tadei et al. 1982). Subsequently, other population studies of An. darlingi have revealed high levels of genetic variability and low to moderate heterogeneity with a wide array of markers (Steiner et al. 1982, Rosa-Freitas et al. 1992, Freitas-Sibajev et al. 1995, Santos et al. 1999, Malafronte et al. 1999, Mira-bello & Conn 2006, González et al. 2007). However, a study conducted near the city of Iquitos, Peru, detected high homogeneity in nine populations, using random amplified polymorphic DNA-polymerase chain reaction (RAPD-PCR) (Pinedo-Cancino et al. 2006). Much of the variability detected in An. darlingi could be related to an adaptive strategy to exploit distinctive ecological niches within its extensive range (Kreutzer et al. 1972, Tadei et al. 1982, 1998) while the population structure and differentiation may be explained by differences in the effective population size, patterns of gene flow and historical and recent colonization events across its range. The vast geographic distribution of An. darlingi from Southern Mexico to Northern Argentina (Linthicum 1988), as well as significant differences between populations documented by polytene chromosome (Kreutzer et al. 1972), isozyme (Steiner et al. 1982) and behavioral (revision in Rosa-Freitas et al. 1992) studies have led to the hypothesis of a species complex (Charlwood 1996). This hypothesis was rejected by Manguin et al. (1999) based on results of a multi-marker study (morphology, isozymes, ITS2-internal transcribed spacer two, and RAPD) that included samples from much of its range. Recently, a study based on mitochondrial DNA COI sequences detected a significant genetic division between Central America plus NW Colombia, and the rest of South America (Mirabello & Conn 2006) and microsatellite data also detected significant differentiation across the eastern Amazonian region (Conn et al. 2006). The aims of the present study were to estimate genetic variability and population structure and to infer the extent of gene flow among nine populations of An. darlingi from central and western Brazilian Amazon, using seven dinucleotide microsatellite loci. MATERIALS AND METHODS Mosquito collection -The specimens of An. darlingi were collected in Amazonian Brazil from March 1998 to August 2002. The samples were from the municipality of Acrelândia (MAC), state of Acre; Porto Velho city (PVE), and municipality of São Miguel (SMI), both in the state of Rondônia; and Coari (COA), Novo Airão (NAI), Castanho (CAS), Puraquequara (PUR), Ramal do Brasileirinho (RBR), and Bancrévea (BAN), all in the state of Amazonas (Table I, Fig. 1). The latter three localities are situated on the periphery of Manaus, separated by about 10 to 19 km. PUR and RBR are east of Manaus and nearest to it; BAN, to the north, is slightly farther away. The two localities, PVE and SMI from Rondônia are separated by about 16 km, and they are on opposite sides of the Madeira River. The female mosquitoes were captured using human landing catches and resting on cattle corrals or on vegetation near human dwellings from 18:30 to 21:00 h. The standard human landing catch protocol in use in the Brazilian localities during the collection period (1998-2002) was reviewed and approved by the Institutional Review Board of the University of Vermont, US. After capture, the mosquitoes were transported to the Instituto Nacional de Pes-quisas da Amazônia (Inpa), in Manaus, identified using the taxonomic key of Faran and Linthicum (1981), and immediately preserved in ethanol 95% or stored at -80ºC, until analysis. For COA, both wild-caught females and offspring (F1) were used. All localities are in endemic malaria areas. Microsatellite analysis - DNA was extracted from individual whole mosquitoes as described in Sambrook and Russel (2001). Eight microsatellite loci designed according to Conn et al. (2001) were used in the analyses and are as follow: ADC01, ADC02, ADC28, ADC107, ADC110, ADC137, ADC138, and ADC29. The same sample size was used for the eight loci; the ADC107 locus, however, failed to amplify many individuals in all the samples after two attempts, even though these individuals were amplified for the remaining loci. Also, in the few individuals that did yield a PCR product, an excessive number of genotypes homozygous for different alleles were observed during the genotyping. Therefore, the ADC107 locus was excluded from the analyses. The PCR reactions were prepared containing 10 pmols of each primer, 1/100th of the genomic DNA, puRe TaqTM Ready TO GOTM PCR Beads, and distilled water to complete the final volume of 12 µl. The forward primer of each primer pair was labelled with a fluorescent dye (6FAM, HEX or TET, Applied Biosystems, Foster City, CA). DNA amplifications were carried out on a PTC-200 thermal cycler (MJ Research, Waltham, MA) as described in Conn et al. (2001). PCR products were then checked by electrophoresis in 1.5% agarose gels. The reactions for automated sequencing were carried out as follows: each PCR reaction (1.5 µl aliquot) was prepared using standard protocols (Applied Biosystems) and analyzed on an ABI Prism 377 DNA Sequencer (Applied Biosystems). Gels were analyzed, and project and sample files were generated using ABI GENESCAN software, version 3.1 (Applied Biosystems). Subsequently, allele sizes were scored and compared with internal size standards using GENOTYPER software, version 2.6 (Applied Biosystems). Statistical analyses - The analyses were performed using ARLEQUIN software, version 3.01 (Excoffier et al. 2006). The genetic variability was estimated using frequency of alleles, departure from Hardy-Weinberg Equilibrium (HWE), observed and expected heterozygosity (HO and HE, respectively) per locus, linkage disequilibrium and AMOVA. For the loci that were not in HWE, frequencies of null alleles (r) were calculated using the following expression: r = (HE HO)/(HE + HO). The inbreeding coefficient FIS was calculated for all loci using the expression: FIS = HE HO/HE (Wright 1965). The pairwise genetic distances, based on the FST statistic, and isolation by distance (IBD) test were calculated using ARLEQUIN software. The FST (Weir & Cockerham 1984) assumes the infinite alleles model (IAM) and was calculated based on the absolute frequencies of alleles. The significance of FST was determined by permuting genotypes between localities (10,100 permutations). We used the FST statistic only (not RST) because FST is considered more reliable when fewer than 20 microsatellite loci are analyzed (Gaggiotti et al. 1999). The number of migrants per population per generation (Nm = migration indices) between localities was estimated from pairwise FST values. IBD was estimated using the correlation between genetic and geographic distances by the regression of FST/1-FST on the natural logarithm (In) of straight-line geographical distance. The significance level was tested using 10,000 permutations. Effective population size (Ne) was calculated using NeEstimator software, version 1.3 (Peel et al. 2004), based on the linkage disequilibrium (LD) and heterozygote excess (HE) models. These estimates were calculated from the deviation of expected compared to observed degree of linkage disequilibrium and from the excess of heterozygotes in the sample compared to the proportion predicted under HWE. The genetic relationships between the populations were also assessed by a UPGMA phenogram using PAUP* software, version 4.0 (Swofford 2003). When multiple tests were performed, the nominal significance level (P < 0.05) was adjusted using the sequential Bonferroni procedure (Holm 1979). RESULTS A total of 377 individuals was analyzed (Table I). All loci revealed high levels of polymorphism, with a total of 105 alleles, and there were 5 to 25 alleles per locus in the nine populations (Table II). The ADC01 locus exhibited the largest allele number (from 18-25), whereas the ADC28 locus had the fewest (from 5-11). All western samples, from MAC, PVE, and SMI (states of Acre and Rondônia) had the highest allele number and mean expected heterozygosity levels (HE = 0.855; 0.800; 0.781, respectively) compared with the samples from state of Amazonas. No locus was in HWE for all the samples assayed (Table II). Thirty-two of the 63 (50.79%) comparisons exhibited significant departures from HWE after sequential Bonferroni correction (P < 0.05), due to heterozygote deficiencies, and the inbreeding coefficient (FIS) was positive in most cases. The ADC110 locus showed a significant departure from HWE for only one sample, whereas the ADC02 and ADC138 loci deviated from HWE for eight and seven samples, respectively. The PUR sample exhibited the highest number of loci deviating from HWE, which could be related to its lower gene diversity (0.692). In all samples, each locus failed to amplify for at least one specimen after two attempts, while the same specimen yielded PCR products for the remaining loci, strongly suggesting the presence of null alleles. Estimates of the frequency of null alleles are given in Table II. The ADC02 locus, for example, showed a high frequency of both null alleles and FIS values, primarily in the three samples from Manaus and in the NAI samples. The ADC28 locus in the RBR sample and the ADC29 locus in the SMI sample also showed high values (Table II). Analysis of linkage disequilibrium was carried out to confirm whether the deviations from HWE within-samples were due to Wahlund effect, inbreeding, selection or null alleles. Only two of 189 (1.05%) of exact tests were significant for linkage disequilibrium (P < 0.05), after sequential Bonferroni correction. The significant values were between the loci ADC29/ADC138 in the SMI sample and between the loci ADC110/ADC02 in the COA sample. Significant genetic differentiation was observed for the most of the comparisons between localities (P < 0.001), after the sequential Bonferroni correction (Table III). The average FST value over all loci was 0.044, with a large range (0.001 to 0.095). As expected if the IBD model is supported, the FST values were not significant for those population pairs separated by the smallest geographic distances (i.e., 10-152 km). The exceptions are CAS-PUR and CAS-RBR where the geographic distances are 119 and 134 km, respectively, but they are significantly differentiated (FST = 0.020; 0.024; P < 0.001). The highest genetic differentiation (FST = 0.067-0.095) was found among samples from MAC and state of Amazonas that were farthest apart geographically, with corresponding Nm values of 4.7 to 6.9. This result indicates reduced gene flow among them. Within state of Amazonas, COA was the most diverged (FST = 0.047-0.056; Nm = 8.4-10.1), however between COA and PVE/SMI (state of Rondônia), separated by greater geographic distances, the FST values were lower (FST = 0.030, 0.024; Nm = 16.2, 20.0; respectively). In an AMOVA, the placement of COA (either grouped with the other samples from Amazonas or with the samples from Acre and Rondônia) made no significant difference (data not shown). Most of the total variance was explained at the within population level (94-95%; P < 0.001). Only 3-4% of the variance was attributable to between groups (P < 0.05), and about 2% was attributable to among populations within groups (P < 0.001). The Mantel test showed a significant positive correlation between geographic distances and FST values (R2 = 0.893; P < 0.0002), indicating that most genetic differentiation can be explained by the IBD model. Effective population size (Ne) differed between two models employed (Table IV). Under the LD model, the average Ne was 202.4 individuals, with a 95% confidence interval of 186.1-220.8. Ne was lowest (83.0 individuals) in the COA sample and highest (∞ ) in the PVE sample. Under the HE model, Ne values were ∞ for all localities. The clusters in the UPGMA phenogram (Fig. 2) were much as expected, based on the IBD model, with COA (the most western of the Amazonas state localities) grouped with samples from Acre and Rondônia, and the five remaining samples from Amazonas state (more central) grouped together. DISCUSSION The microsatellite loci used in this study have not been physically mapped to the polytene chromosomes of An. darlingi, and therefore their location relative to inversions is unknown. If any are linked to chromosomal inversions, this may alter the interpretation of the data since neutrality cannot be assumed. Microsatellite loci analyzed in An. darlingi from central and western Brazilian Amazon were highly polymorphic and found to be at least six-fold more variable than isozymes (Rosa-Freitas et al. 1992, Manguin et al. 1999, Santos et al. 1999). Compared with others microsatellite studies, the HE values (0.519-0.949) reported here are in the same range as those found for An. darlingi from eastern Brazilian Amazon (Conn et al. 2006) and for other major malaria vectors, such as An. gambiae s. s. in Africa (Lehmann et al. 1997) and An. albimanus in Latin America (Molina-Cruz et al. 2004). In this study, significant deviations for HWE were due to heterozygote deficits. These could be the result of the Wahlund effect (population subdivision), inbreeding, selection or null alleles. Linkage disequilibrium was absent in 98.95% of the exact tests; therefore, it is highly unlikely that the Wahlund effect or inbreeding, which affect the entire genome, could be the cause. Earlier studies of An. darlingi from central Amazonian Brazil using polytene chromosomes (Kreutzer et al. 1972, Tadei et al. 1982) and isozymes (Rosa-Freitas et al. 1992, Man-guin et al. 1999) detected no suggested intra-populational differentiation making the Wahlund effect an unlikely explanation. Taken together, these observations strongly suggest the presence of null alleles in An. darlingi of this study, as have been observed in An. darlingi from eastern Brazilian Amazon (Conn et al. 2006), and in other microsatellite studies (Lehmann et al. 1997, Kamau et al. 1999). Previous studies employing mtDNA (Freitas-Sibajev et al. 1995) and isozymes (Santos et al. 1999) reported higher divergences for An. darlingi from Manaus compared with other samples. Freitas-Sibajev et al. (1995) described small sequence divergence values among all samples analyzed, except for comparisons involving Manaus, where these values were within the lower range of interspecific genetic distances, as observed for members of the An. quadrimaculatus complex (discussed in Freitas-Sibajev et al. 1995). For isozymes analyses, although genetic homogeneity was found among the samples (D = 0.011-0.024), those from Manaus were the most diverged (Santos et al. 1999). In the present study, the higher levels of heterozygote deficits detected in the samples up to 134 km from Manaus (NAI and CAS) and on the periphery of Manaus (especially, PUR and RBR) could be the result of a reduction of informativeness of these primers possibly due to a greater accumulation of different mutations in their flanking regions, that probably prevented PCR amplifications, resulting in a higher frequency of null alleles, and consequently higher levels of heterozygote deficits. We think the main reason for the presence of null alleles could be that the whole microsatellite library was constructed only of An. darlingi from Capanema (eastern Amazonian Brazil, Conn et al. 2001). Genetic differentiation was low and not significant between populations separated by distances less than 152 km, with two exceptions (CAS-PUR; CAS-RBR) and the Nm values suggest extensive gene flow among them. These results were similar to findings of low differentiation over a similar range of distances for An. arabiensis in Cameroon (Wondji et al. 2005). In a study of nine populations of An. darlingi within ~ 60 km of Iquitos (Peru), very low genetic structure was evident. The authors concluded that gene flow was the primary factor influencing structure (Pinedo-Cancino et al. 2006). Our data did not identify obvious genetic structure across the geographical scale up to 152 km, perhaps due to the abundance (reflected in the Ne values: 152.0-501.2) and dispersal ability of these populations (reflected in the high gene flow), as a consequence of some combination of the following: high availability of breeding sites especially during the rainy season, complex environmental and social factors, and expansion of human activities. At the macrogeographic level, from 296 to 1184 km, the data showed significant genetic differentiation in An. darlingi, primarily between samples with greater distances, for example between MAC and the samples from Amazonas state. According to Slatkin (1987) genetic differentiation will be substantial if Nm < 1 but not if Nm > 1. Our results for these comparisons showed Nm values > 1 (4.7 to 6.9), suggesting that gene flow is restricted but not absent, and probably prevented any diagnostic differences between them. The AMOVA analysis indicated low variance between groups (~ 3%) and among populations within groups (~ 2%), consistent with IBD and comparable to results from An. gambiae s. s. (Kamau et al. 1999). Conn et al. (2006)'s data showed higher genetic differentiation, based on the FST (highest values = 0.1464-0.1841) and hierarchic analysis (between groups = ~ 12%), indicating that populations of An. darlingi from eastern Brazilian Amazon are more genetically structured than An. darlingi in the present study. Likewise, the average Ne (202.4 individuals) in the present study was two-fold higher than that observed for An. darlingi from eastern Amazonian Brazil (Ne = 92.4, Conn et al. 2006) and for the other Neotropical malaria vector An. albimanus (Ne = 96, Molina-Cruz et al. 2004). Considering each population separately in the present study, all Ne values were high under the LD model, except for COA. It is also possible that the large range of Ne values for all populations under LD (83 - ∞) could have contributed to the genetic differentiation such that the FST estimates at the greatest geographic distances were statistically significant, despite obvious gene flow (Donnelly et al. 2002). In the sample from PVE, the Ne was ∞ under both models, which suggests a very high density of An. darlingi locally. In the state of Amazonas, primarily in Manaus, the use of insecticidal fogging has intensified during the past ten years due to high malaria transmission indices; nevertheless, the Ne values for these populations (PUR, RBR, BAN; Ne = 155.8-469.6) show that despite frequent application of insecticides, large populations of An. darlingi are being maintained. This implies that insufficient levels of insecticide are currently being used (notwithstanding the highly complex environmental and social factors in this region). Another explanation could be that exclusively local interventions may result in the influx of mosquitoes from untreated neighborhood areas, resulting in operational failures and large population size again a short time after fogging. Also, the increase of An. darlingi population size could be due to other factors, such as the availability of breeding sites and city expansion in the form of uncoordinated settlements near forests. In addition, compared with 50 yr. ago (Deane et al. 1948) some populations of An. darlingi have changed their behavior, now being more exophilic and exophagic and/or leaving dwellings immediately after feeding (Tadei 1987, Charlwood 1996, Gil et al. 2003), making the use of indoor insecticide and other individual protection measures less effective. This complex situation suggests that integrated and coordinated local or regional control must be considered. For example, a concerted effort to identify suitable An. darlingi breeding sites, particularly in proposed new settlements and discouraging people from living nearby, could be useful because An. darlingi does not seem to fly far to seek human bloodmeals if other mammal hosts are available (Zimmerman et al. 2006). In areas where people are already settled near breeding sites, another possibility might be the use of an environmentally acceptable insecticide, such as Bacillus sphaericus for aquatic stages (Rodrigues et al. 1998) combined with fogging for adults, focusing on the peak transmission time of the year. However, integrated malaria control also needs to take into account the proportion of asymptomatic malaria persons (Coura et al. 2006) and resistance to anti-malarial drugs (Vieira et al. 2004) in a given area to have any hope of success. The low Ne observed for An. darlingi from COA may have magnified differentiation between this and the other Amazonas populations by genetic drift, a fundamental parameter influencing genetic population structure. Interestingly, this locality showed linkage disequilibrium between the ADC110/ADC02 loci; nevertheless, its expected heterozygosity was high. The large populations of An. darlingi reflected in the high Ne values may be contributing to an increase in gene flow among subpopulations, resulting in little genetic structure for An. darlingi from central and western Brazilian Amazon, a result similar to that found with the use of multi-markers (Manguin et al. 1999, Santos et al. 1999) and also similar to results from Iquitos, Peru, with the use RAPD marker (Pinedo-Cancino et al. 2006). A recent study with three populations from Colombia showed also little evidence of geographic separation between eastern and western from mountains Andes, with the use RAPD and AFLP (Amplified Fragment Length Polymorphism) markers (González et al. 2007). Otherwise, the differences in population structure across Amazonian Brazil detected by microsatellite data, i. e., less structure and differentiation in central and western Brazilian Amazon compared with eastern Brazilian Amazon, are congruent with results using sequences of the nuclear white gene (L Mirabello & JE Conn, unpublished observations). This differentiation in An. darlingi probably has its origin in regional Amazonian biogeography, which is far from homogeneous. The samples of An. darlingi collected in the present study and those from Conn et al. (2006) are along different major Amazon river systems (Negro, Solimões, Madeira, and mouth of the Amazonas) which represent distinctive tectonic compartments, with distinctive geomorphological characteristics, believed to have influenced the evolutionary history of Amazonian organisms (Rossetti et al. 2005). These findings are of vital importance to region-wide control efforts currently underway among Amazonian countries to try to reduce malaria transmission. ACKNOWLEDGMENTS To Dr Wanderli Pedro Tadei (Inpa, Manaus, AM, Brazil) and Dr Fátima dos Santos (Porto Velho, RO, Brazil) for providing logistical support to collect the mosquitoes in the states of Amazonas and Rondônia, respectively. To Funasa's team from states of Acre, Amazonas, and Rondônia for providing logistic support to collect in all localities. To Drs Tomas Hrbek and Izeni Farias (Ufam, Manaus, AM, Brazil) for help with the statistical analysis. All of the DNA from the samples of An. darlingi was returned to Inpa, where it is being maintained at 80° C. REFERENCES
Copyright 2007 Instituto Oswaldo Cruz - Fiocruz The following images related to this document are available:Photo images[oc07054t4.jpg] [oc07054f1.jpg] [oc07054t2.jpg] [oc07054t1.jpg] [oc07054t3.jpg] [oc07054f2.jpg] |
| |||||||||
