 |
| About Bioline | All Journals | Testimonials | Membership | News |
|
||||||
|
||||||
Memórias do Instituto Oswaldo Cruz, Vol. 103, No. 5, August 2008, pp. 497-500 SHORT COMMUNICATION Genetic relationships between sympatric populations of Bacillus cereus and Bacillus thuringiensis, as revealed by rep-PCR genomic fingerprinting Ana Paula S Peruca; Gislayne T Vilas-Bôas*; OMN Arantes Departamento de
Biologia Geral, CCB, Universidade Estadual de Londrina, CP 6001, 86051-990 Londrina,
PR, Brasil Financial support: CNPq, CAPES Received 24 July
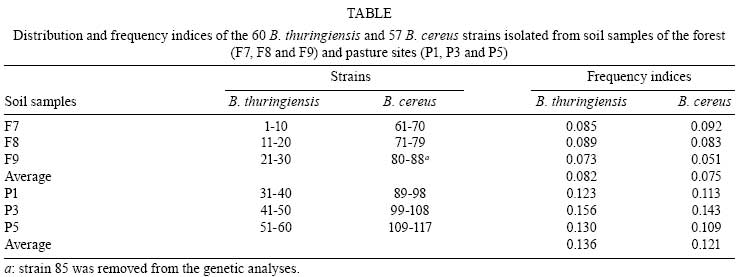
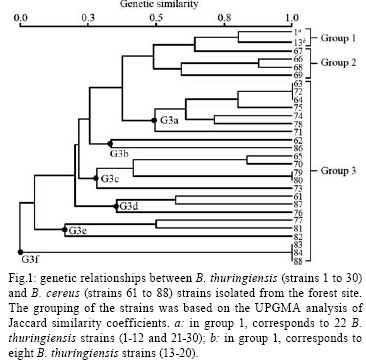
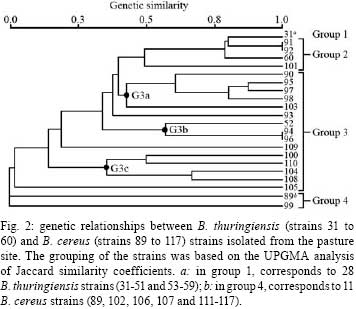
2007 Code Number: oc08088 ABSTRACT The bacterial strain Bacillus cereus is closely related to Bacillus thuringiensis, although any genetic relationship between the two strains is still in debate. Using rep-PCR genomic fingerprinting, we established the genetic relationships between Brazilian sympatric populations of B. cereus and B. thuringiensis simultaneously collected from two geographically separate sites. We observed the formation of both B. thuringiensis and B. cereus clusters, as well as strains of B. cereus that are more closely related to B. thuringiensis than to other B. cereus strains. In addition, lower genetic variability was observed among B. thuringiensis clusters compared to B. cereus clusters, indicating that either the two species should be categorized as separate or that B. thuringiensis may represent a clone from a B. cereus background. Key words: Bacillus cereus - Bacillus thuringiensis - genetic relationship The genetic relationships between Bacillus cereus and Bacillus thuringiensis have been extensively studied using various genomic techniques such as multi-locus enzyme electrophoresis (Helgason et al. 1998, Vilas-Bôas et al. 2002), sequencing of discrete protein-coding genes (Helgason et al. 2000), and the multi-locus sequence typing technique (Helgason et al. 2004, Ko et al. 2004, Priest et al. 2004). The results, however, remain conflicting - either supporting the view that the two bacteria should be classified as separate taxa or that B. thuringiensis represents a subspecies of B. cereus. Repetitive element polymorphism (rep)-PCR fingerprinting is one method frequently used to type bacteria (Versalovic et al. 1991) by analyzing the distribution of repetitive DNA sequences in several prokaryotic genomes. Primers specific to repeat sequences reveal inter-repetitive distances, and bacterial species-specific patterns and strains can be used for genetic analysis (van Belkum et al. 1998). Repetitive extragenic palindromic elements (REP) are the best characterized bacterial repetitive DNA sequences used to classify taxonomic relationships between B. cereus species (Shangkuan et al. 2000, Kim et al. 2001, Cherif et al. 2002, 2003, 2007). Local populations must be studied to determine natural genetic structures and relationships among bacterial populations (Vilas-Bôas et al. 2002). The present work aims at clarifying the genetic relationships between the Brazilian B. cereus and B. thuringiensis sympatric populations based on rep-PCR fingerprinting. Six soil samples were simultaneously collected in two restricted sites (about 100 m2) located 3 km apart in Londrina, state of Paraná, Brazil. One site was located within a subtropical forest (site F), and the other was within a pasture at the edge of site F (site P). Three soil samples were collected from each site (samples F7, F8, F9 and P1, P3, P5 at sites F and P, respectively). B. cereus and B. thuringiensis strains were isolated from one gram of each soil sample, heated at 70ºC for 30 min, plated on nutrient agar and incubated at 30ºC for five days. B. cereus or B. thuringiensis strains were identified as described by Vilas-Bôas et al. (2002). Ten strains of each species were isolated from each soil sample with the exception of samples F8, F9 and P5, from which only nine B. cereus strains were isolated, giving a total of 117 isolated strains (60 B. thuringiensis strains and 57 B. cereus strains) (Table). The frequency index of both species in each of the soil samples was calculated as the ratio between the number of identified B. cereus or B. thuringiensis strains and the total number of analyzed colonies. No statistically significant difference in the relative frequency of the studied species was observed at sites F and P [B. thuringiensis (Bt)-F 0.082 vs. B. cereus (Bc)-F 0.075; Bt-P 0.136 vs. Bc-P 0.121] according to the two-tailed Fisher's exact test with p < 0.001 (Table). However, the combined relative frequency of both species from the site F was statistically lower than that from the P site (Bt-F 0.082 vs. Bt-P 0.136; Bc-F 0.075 vs. Bc-P 0.121) according to the two-tailed Fisher's exact test with p < 0.001 (Table). Thus, we emphasize that (i) both Bacillus species were isolated from all soil samples at both studied sites; (ii) the frequency indices of both species were similar in soil samples from F and P (i.e., Bc/Bt ratio ~1:1); and (iii) forest soil samples displayed lower frequency indices than pasture samples in both species. Thus far, only Vilas-Bôas et al. (2002) have analyzed the presence of B. cereus and B. thuringiensis in the same soil samples and found a 10-fold lower frequency of B. thuringiensis. Several studies have analyzed the frequency index of B. thuringiensis in soil samples from both forest and agricultural lands (Martin and Travers 1989, Chilcott & Wigley 1993, Vilas-Bôas & Lemos 2004), and observed higher indices either in agricultural lands (Martin & Travers 1989, Vilas-Bôas & Lemos 2004) or in forest sites (Chilcott & Wigley 1993). Therefore, one can infer that the index variation may be a consequence of both biotic environmental factors (soil microorganisms, commonly found insects and vegetation coverage) as well as abiotic factors (pH, texture, oxygen, nutrient availability, temperature and humidity). As B. cereus and B. thuringiensis are both resistant to the antibiotic ampicillin while strains of B. anthracis are not, ampicillin exposure can be used to rapidly discriminate between different bacterial species (Slamti et al. 2004, Vilas-Bôas et al. 2007). All our 117 isolated strains were evaluated for resistance or sensitivity to 0.1 g/l of ampicillin on Luria-Bertani agar plates (1% tryp- tone, 0.5% yeast extract, 0.5% NaCl) after an incubation period of 24 h at 30ºC. Tests were performed in duplicate. Four strains of B. thuringiensis (23, 56, 57 and 58) and one strain of B. cereus (85) were ampicillin-sensitive, while all other strains were ampicillin-resistant. Thus with the exception of B. cereus strain 85, we can infer that all remaining strains do not belong to B. anthracis, as they either form a protein crystal (a trait of B. thuringiensis; Vilas-Bôas et al. 2007) or display resistance to ampicillin (a trait uncommon among B. anthracis strains). Therefore, B. cereus strain 85 was excluded from further analyses because of its ambiguous taxonomic categorization. The five ampicillin-sensitive strains can be further investigated to determine if sensitivity was due to mutations in the pleiotropic promoter plcR (Slamti et al. 2004). Genomic DNA was isolated from both bacterial species by phenol/chloroform extraction. Genetic diversity was evaluated by rep-PCR using the REP1R-I and REP2-I primers (Versalovic et al. 1991). Twenty-five microliter PCR reactions were prepared as follows: 100 ng of genomic DNA, 0.4 µM l-1 of each primer, 0.2 mM l-1 of each dNTP, 3.0 mM l-1 final concentration of MgCl2, and 1.25 U of Taq polymerase (Invitrogen). Amplification was performed with a Eppendorf Mastercycler Gradient thermocycler (Eppendorf) using a single denaturation step (5 min at 94ºC), followed by 40 cycles of 94 ºC for 1 min, 45ºC for 1 min and 65ºC for 4 min. A final extension step at 65ºC for 6 min was added. The amplified products were analyzed by 2% w/v agar- ose gel electrophoresis in TBE buffer (400 mM l-1 Tris, 100 mM l-1 EDTA, 10 mM l-1 boric acid), stained with 10g/l ethidium bromide. A 1 kb plus DNA ladder (Invitrogen) was used as a size reference. A set of amplicons including all monomorphic and polymorphic DNA fragments was created, and each strain fragment was compared with this set of amplicons. Distinct genotypes were designated as electrophoretic types (ETs). Similarity between the strains was determined by the amplicon-sharing coefficient calculated by Jaccard's formula, and strain clustering was performed by the unweighted pair-group method using arithmetic averages (UPGMA) and NTSYS software (Rohlf 2002). Rep-PCR patterns were reproduced by PCR on several strains using genomic DNA obtained from two independent extractions. The number of amplicons per strain varied from 1 to 11, and the apparent molecular size ranged from 200 bp to 3000 bp. In total, 42 different ETs were distinguished with all B. thuringiensis strains classified into four ETs (ET1 to ET4) and all B. cereus strains classified into 38 ETs (ET5 to ET42). No ET was shared by both species. The B. thuringiensis strains had a relatively uniform rep-PCR pattern with most strains classified as ET1, composed of four main amplicons that varied between 350 bp to 1000 bp. The remaining B. thuringiensis ETs (ET2, ET3 and ET4) were composed of one, eight and one strains, respectively, with only minor amplicon variations observed among the different strains. The maximum apparent amplicon size was approximately 3,000 bp. B. cereus strains showed wide polymorphic profiles with apparent molecular sizes ranging between 200 bp to 3000 bp. No signature amplicons could be identified. Both B. cereus and B. thuringiensis species from each site were analyzed using two dendrograms of genetic similarities. Fig. 1 was generated using 57 F strains categorized into groups 1 to 3. Group 1 was comprised of two ETs, one with 22 and another with eight B. thuringiensis strains (which were genetically indistinguishable and therefore considered as clones), and group 2 had four B. cereus strains (strains 67, 66, 68 and 69) closely related to the B. thuringiensis strains from group 1. Group 3 displayed a wide array of genetic variability and was the most complex, including 23 B. cereus strains classified into 18 ETs, which were then divided into six major subclusters (G3a to G3f). Fig. 1 was generated using 59 P strains categorized into four groups; the same features as Fig. 1 was displayed. Group 1 was comprised of one ET with 28 B. thuringiensis strains, while group 2 included B. thuringiensis strain 60 as well as three B. cereus strains (strains 91, 92 and 101), all closely related to the B. thuringiensis strains from group 1. Group 3 showed wide genetic variability and was composed of B. thuringiensis strain 52 as well as 15 B. cereus strains classified into three major subclusters (G3a, G3b and G3c). Group 4 was composed of 12 B. cereus strains classified into two ETs. Both dendrograms show formation of B. thuringiensis clusters with low genetic variability, identifying only four ETs among the 60 strains and the presence of a clone representing 50 B. thuringiensis strains (Figs 1 and 2). In contrast, strains of B. cereus showed high genetic variability, visualized as different banding patterns, leading to the formation of several group 3 subclusters (Figs 1 and 2). These results are in agreement with the high genetic variability seen in B. cereus species described by others (Vilas-Bôas et al. 2002, Cherif et al. 2003, Barker et al. 2005). However, the analysis of group 2 demonstrates some B. cereus strains more closely related to B. thuringiensis than to other B. cereus strains. These results clearly indicate that some B. cereus and B. thuringiensis strains are intermixed. The lower genetic variability observed in sympatric populations of B. thuringiensis compared to that of B. cereus has already been described (Vilas-Bôas et al. 2002), and may indicate a behavioral difference in how these species respond to environmental factors. This pattern should be considered as evidence for the maintenance of their current classification as two separate species or that B. thuringiensis strains represents a subclone emerging from a B. cereus background. REFERENCES
Copyright 2008 - Instituto Oswaldo Cruz - Fiocruz The following images related to this document are available:Photo images[oc08088f2.jpg] [oc08088t1.jpg] [oc08088f1.jpg] |
| |||||||||
