 |
| About Bioline | All Journals | Testimonials | Membership | News |
|
||||||
|
||||||
Memórias do Instituto Oswaldo Cruz, Vol. 104, No. 4, July, 2009, pp. 614-620 ARTICLES Seasonal dynamics of Aedes aegypti (Diptera: Culicidae) in the northernmost state of Brazil: a likely port-of-entry for dengue virus 4 Cláudia Torres CodeçoI, +; Nildimar Alves HonórioII; Cláudia M Ríos-VelásquezIII; Maria da Conceição Alves dos SantosV; Ingrid Vieira de MattosV; Sérgio Bessa LuzIII; Izabel Cristina ReisIV; Guilherme Bernardino da CunhaV; Maria Goreti Rosa-FreitasII, VI; Pantelis TsourisVI; Márcia Gonçalves de CastroII; Ramão Luciano Nogueira HaydV; José Francisco Luitgards-MouraV IPrograma
de Computação Científica-Fiocruz Financial support: CNPq (400983/2005-2), PDTSP/Fiocruz, UFRR, CPqLMD/Fiocruz Received 7 January
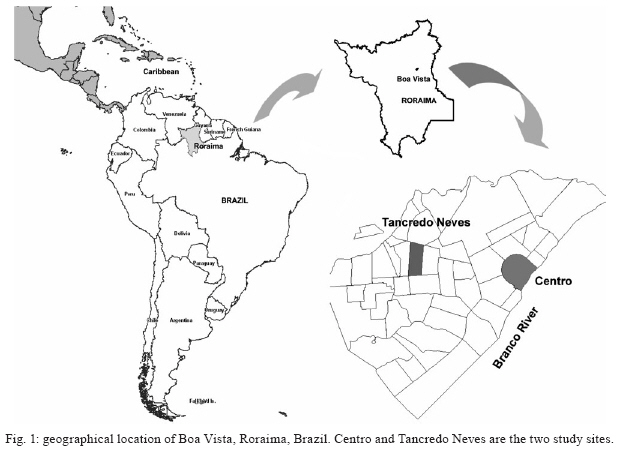
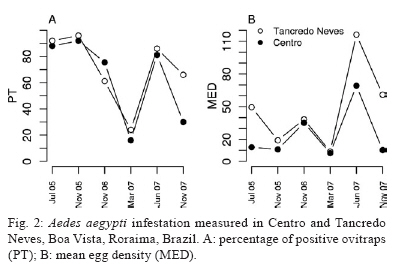
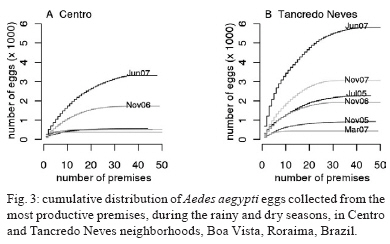
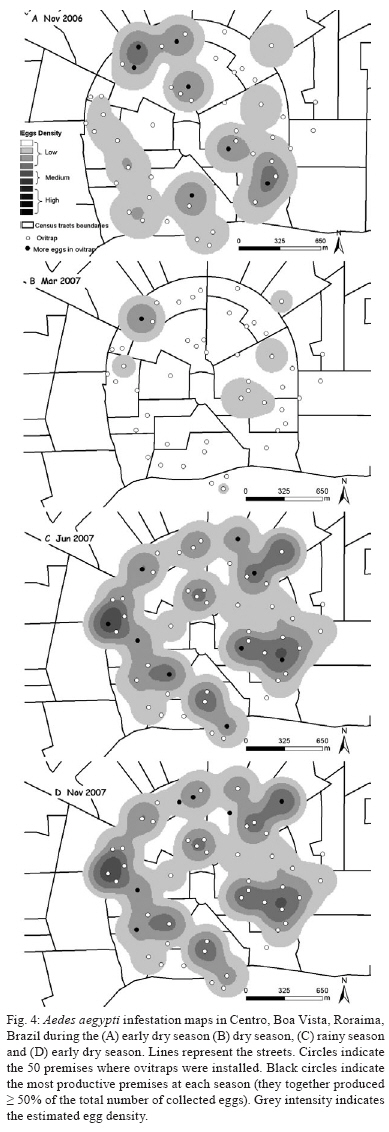
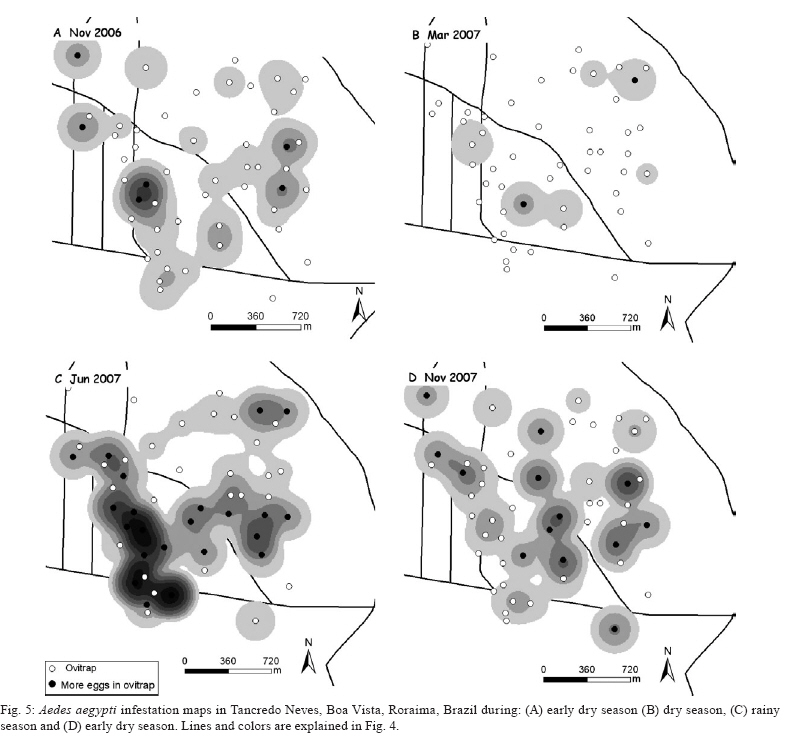
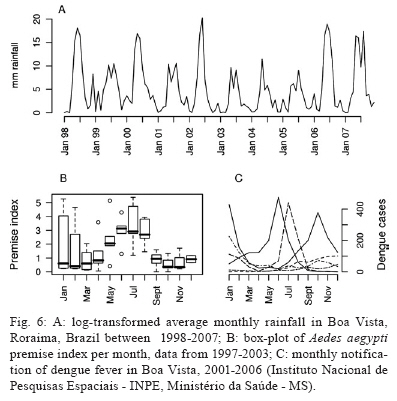
2009 Code Number: oc09139 ABSTRACT Roraima is the northernmost state of Brazil, bordering both Venezuela and Guyana. Appropriate climate and vector conditions for dengue transmission together with its proximity to countries where all four dengue serotypes circulate make this state, particularly the capital Boa Vista, strategically important for dengue surveillance in Brazil. Nonetheless, few studies have addressed the population dynamics of Aedes aegypti in Boa Vista. In this study, we report temporal and spatial variations in Ae. aegypti population density using ovitraps in two highly populated neighbourhoods; Centro and Tancredo Neves. In three out of six surveys, Ae. aegypti was present in more than 80% of the sites visited. High presence levels of this mosquito suggest ubiquitous human exposure to the vector, at least during part of the year. The highest infestation rates occurred during the peak of the rainy seasons, but a large presence was also observed during the early dry season (although with more variation among years). Spatial distribution of positive houses changed from a sparse and local pattern to a very dense pattern during the dry-wet season transition. These results suggest that the risk of dengue transmission and the potential for the new serotype invasions are high for most of the year. Key words: Aedes aegypti - dengue fever - ovitraps - seasonality - Amazon Separated from the rest of country by the Amazonian Forest, Roraima (RR) is the most isolated state in Brazil. Boa Vista, its capital, is a medium-sized city (249,853 inhabitants) (IBGE 2008a) located in the middle of a sparsely populated savannah. A highway is the only paved interstate route, connecting Boa Vista to the city of Manaus 805 km to the south and the Venezuelan border 220 km to the north. Despite its isolation, Boa Vista (and RR as a whole) has received - and continues to receive - a large inflow of visitors and migrants from Venezuela, Guyana and the Caribbean countries, as well as migrants from other regions of Brazil. As a consequence, RR's population increased from 79,400 inhabitants in 1980 to 395,725 inhabitants in 2008, a 5-fold increase in fewer than 30 years. Today, 53.7% of RR's population are immigrants, the highest proportion observed in Brazil (IBGEb 2008). The first dengue fever epidemic in Brazil after the re-invasion by Aedes aegypti occurred in Boa Vista in 1981-1982 with 11,000 reported cases (Osanai et al. 1983, Travassos-da-Rosa et al. 1998). DENV-1 and DENV-4 were isolated. For four years prior to this, DENV-1 was spreading throughout the Caribbean Islands, Central America and Northern South America (Moros et al. 2003, Uzcategui et al. 2003). The year 1981 also marked the arrival of DENV-4 in the Americas (Lanciotti et al. 1997). In Boa Vista, this first invasion was interrupted through vector control programs and the country was spared any new dengue invasions until 1986, when DENV-1 arrived in Rio de Janeiro, triggering nationwide epidemics (Nogueira et al. 2007). Dengue fever has become an endemic disease in Brazil, with the co-circulation of DENV-1, DENV-2 and DENV-3 in most of the 27 Brazilian states. DENV-4 did not persist in Brazil after RR's 1981-1982 outbreak (Nogueira et al. 2007). In 2008, Figueiredo et al. reported that three patients had been infected with DENV-4 in Manaus, Amazonas. This result has been contested by the Ministry of Health and so far no consensus exists on the presence of DENV-4 in the Brazilian Amazon (de Melo et al. 2009). For several years now, RR has consistently had one of the highest dengue incidence rates among Brazilian states. In 2007, RR registered an incidence rate of 594.8 cases per 10,000 inhabitants. This was the highest rate after Amapá (877.7), Tocantins (TO) (1415.3) and Mato Grosso do Sul (MS) (3213). In 2006, the incidence rate in RR was 657.8, highest after MS (688.3) and TO (665.7) (MS 2007). Its proximity to Venezuela, where all four dengue serotypes are found, and appropriate vector and climate conditions for dengue transmission, make Boa Vista a strategic point for dengue surveillance in Brazil. Despite this fact, studies on Ae. aegypti population dynamics in this area are still scarce (Zeidler et al. 2008). In this paper, we report spatial and temporal variations in the number of Ae. aegypti eggs collected in Boa Vista. The characteristics of the locations with high egg numbers are also noted. MATERIALS AND METHODS The city and the studied neighbourhoods - RR is located in Northern Brazil (Fig. 1). Its capital, Boa Vista (02°49'11"N 60°40'24"W 85 m), has an area of 5,687 km2 and 249,853 inhabitants (IBGE 2008a). Boa Vista is located in a savannah ecoregion (Rosa-Freitas et al. 2007). The climate is tropical wet and dry, with an average temperature of 27.8°C (10-year average) (NASA 2001) and very low intra-annual variability. Average yearly rainfall amounts to approximately 429 mm (4-year average) (NASA 2001). Schmidt (1942) described the regional climate as having two distinct seasons: a rainy season between April-November, with high rainfall indices during the months of June and July and a dry season, from December-March. A three-year study of Boa Vista showed a dry season between October-March and a wet season between April-September, with especially high rainfall indices in June and July (Rosa-Freitas et al. 2006). Centro and Tancredo Neves were the two neighbourhoods chosen for this study. Centro is the downtown area, situated along the Branco River. It is the oldest part of the town. The resident population is ca. 6,000 individuals (Rosa-Freitas et al. 2003), with an average residence time of 27.5 years (estimated from this study sample). Commercial activity is intense and most of the Boa Vista population commutes through this area. Residents in Centro earned, on average, US$ 799/month (equivalent to 3 current Brazilian minimum salaries) (Rosa-Freitas et al. 2003). Tancredo Neves is located in a more recently settled area in the west part of Boa Vista, 6 km from Centro. Tancredo Neves is characterised by a more precarious infrastructure, a lower average income (US$ 265/month, equivalent to 1 Brazilian minimum wage), 17% illiteracy and an average residence time of 10 years. Ovitrap setting and sampling - Fifty coordinate pairs were randomly sampled from street maps of each area (with a restriction that distance between coordinate pairs should be > 50 m). A field team visited the area with a GPS to locate the premise closest to each coordinate pair. The resident was invited to participate in the study and was interviewed upon signed consent. Six mosquito surveys were carried out. To sample during the rainy season, collections were performed in July 2005 and June 2007. To sample during the dry season, collections were performed in November 2005, November 2006 and November 2007 (early dry season) and in March 2007 (peak of the dry season). In each survey, one ovitrap was placed in the peridomicile of 50 premises per neighbourhood, usually in the garden or in a shady area. An ovitrap is a black plastic container filled with a mixture of water (270 mL) and an infusion of diluted hay (30 mL), with a wooden stick (15 cm x 2 cm) glued to the container wall to collect eggs (Reiter et al. 1991, Honório et al. 2003). One week after being set, the ovitrap was removed and taken to the laboratory, where wooden sticks positive for eggs were submerged in water. Ecloded larvae were bred to their 4th larval instar, identified [using taxonomic keys from Consoli and Lourenço-de-Oliveira (1994)] and counted. Temporal and spatial indices - Trap positivity index (TP) and egg density index (MED) were calculated. TP is the proportion of positive traps; MED is the ratio between the total number of eggs collected and the total number of traps (Regis et al. 2008). Differences in TP and MED between seasons per neighbourhood were analysed (χ2 and Wilcoxon tests respectively calculated using the software R 2.6.0, (R Development Core Team 2006). Infestation maps were made using ArcGis 9.1 (ESRI, Redlands, CA, US). For each area and season we calculated a smooth kernel with a 250 m radius. Building characteristics - Premises were classified as residential, commercial or both. Yards, when present, were classified according to the amount of shade (no shade, partially shaded, completely shaded). After inspection, all containers that could potentially become breeding sites (either currently filled with water or not) were identified and recorded. By inquiring with the householder, we obtained information regarding access to public services (water, sewage) and socio-demographic characteristics of the residents (income, schooling, time of residence in Boa Vista and in the neighbourhood). Associations between infestation and premise characteristics were tested (Kruskall-Wallis and χ2 tests). RESULTS Study area, city and the neighbourhoods - In Centro, 65% of the premises included in the survey were residential and 35% were commercial. All but one premise had a yard and 68% of the yards had shady areas. Containers that could potentially be colonised by Aedes were found on 14 premises (28%). Most of the containers were small flower vases and discarded bottles. All premises (but one) were linked to the city water system. Five premises also stored water for consumption in large cisterns (1 school and 4 residences). Most premises (95%) were made of brick. In Tancredo Neves, all premises in the survey were residential (4% with double function, residential and commercial). All but one premise had yards and 98% of the yards had shady areas. Containers that could potentially be colonised by Aedes were found on 21 premises (42%). Most of the containers were flower vases and discarded bottles. A total of 82% premises were linked to the city water system and 40% were also storing water for consumption in large cisterns. Most premises were made of brick (90%). Species captured - More than 99% of the larvae that hatched from collected eggs were identified as Ae. aegypti. Less than 1% of larvae were Culex nigripalpus and Cx nigripalpus was only found in Tancredo Neves. All further analyses considered total eggs counted as a measure of the degree of Ae. aegypti infestation. Comparison between neighbourhoods. Ovitraps results - A total of 21,399 eggs were collected during the whole study, with two thirds of eggs collected in Tancredo Neves (χ2 = 2565, df = 1, p < 0.001). Considering each survey separately, Tancredo Neves always yielded the highest number of eggs (Fig. 2B). TP positivity, on the other hand, was similar in both Centro and Tancredo Neves in all surveys but the last one, performed in November 2007 (χ2 = 11.5, df = 1, p < 0.001). Temporal pattern - TP peaked during the rainy season (July 2005 and June 2007), with TP > 80% in both neighbourhoods. This was also the period with the highest egg density in Tancredo Neves (with MED = 49.5 and 116 eggs/trap during the rainy seasons of 2005 and 2007, respectively). Centro showed lower egg densities and its only survey with high density values (MED = 69.2 eggs/trap) also occurred during a rainy season (Fig. 2). TP in the early dry season presented high variability between years. High infestation ( > 80%) was observed in 2005, intermediary infestation (60-75%) in 2006 and relatively low infestation (35-70%) in 2007. November of 2007 was an unusually dry month, registering only 4.8 mm of rainfall (in November 2005 and 2006, rainfall averaged 85 mm). Only during the peak of the dry season (March 2007) were infestation indices low, with TP < 25% and MED < 10 eggs/trap. Egg distribution among premises - The number of eggs per premise was highly skewed (Centro: average of 30 eggs/premise, median of 1 egg/premise; Tancredo Neves: average of 56 eggs/premise, median of 13 eggs/premise). A small number of premises contributed most of the eggs captured (Fig. 3). During the infestation peaks (July 2005, November 2006 and June 2007), 10-20% of the premises yielded half of the total Ae. aegypti eggs in Centro and 12-18% yielded the same proportion in Tancredo Neves. In Centro, during the lowest infestation period (March 2007, in the dry season), two premises alone were responsible for > 50% of eggs collected. These premises were a large commercial site and a residence. In Tancredo Neves, three premises produced > 50% of all eggs collected in the same period of time. These three premises were a car-wash and two residences. Infestation maps for each season and neighbourhood are shown in Figs 4 and 5 with the most productive premises marked as black circles (dark grey colour indicates highly infested areas). No association was found between the following measured premise traits and Ae. aegypti egg density: (i) be a residence (not commercial) (Centro: Wilcoxson's W = 4052, p = 0.24; Tancredo Neves: W = 2135, p = 0.8926), (ii) degree of shade in courtyard (Centro: Kruskal-Wallis = 1.0642, df = 2, p = 0.58; Tancredo Neves: Kruskal-Wallis = 0.3008, df = 2, p = 0.86) and (iii) have potential breeding sites in the yard (Downtown: W = 4446.5, p = 0.14; Tancredo Neves: W = 4824.5, p = 0.98). The other characteristics measured (water supply, sewage service etc.) showed low variation among premises and could not be tested. DISCUSSION Routine surveillance of Ae. aegypti in Boa Vista based on household surveys and the premise index calculation suggests that mosquito abundance in Boa Vista has a strong seasonal profile, with a high peak during the wet season (May-August) (Fig. 6B). In contrast, dengue incidence in Boa Vista has shown a variable year-to-year profile, with peaks occurring in the rainy season in some years and in the dry season in other years (Fig. 6C) (Rosa-Freitas et al. 2003). Our data show that the period of high mosquito abundance is larger than suggested by the premise index data. In particular, we found high infestation indices during the early dry season (November), when the premise index consistently showed low values. A comparable result was found in another neighbourhood of Boa Vista, where 77.8% TP in November 2006 was measured (Zeidler et al. 2008). The greater sensitivity of ovitrap indices when compared to premise indices may explain the observed discrepancies between premise and ovitrap indices and underscore the value of using ovitraps (or other similar traps) for surveillance in Boa Vista. The main meteorological determinant of mosquito population dynamics in Boa Vista seems to be the amount of rainfall (Zeidler et al. 2008). This result contrasts with the southern part of the country, where temperature seems to play the major role (NA Honório et al., unpublished observations). Rainfall is a "noisier" external force than temperature and is also characterised by higher variation between years. In Fig. 6A, a 10 year time series of rainfall in Boa Vista is depicted. This plot shows the occurrence of wetter and drier rainy seasons, depending on the year. Moreover, a shorter rainfall season at the end of the year (November-December) is noticeable, varying in magnitude from year to year. This short wet season may be responsible for the highly variable egg counts observed in November in our study. Human behaviour may also change throughout the year in response to rainfall. It is interesting to note that mosquito infestation was always higher in Tancredo Neves, the neighbourhood, with twice as many households reporting that they store drinking water on their property. This difference between Tancredo Neves and Centro is consistent with previous observations based on premise indices (Fig. 8 in Rosa-Freitas et al. 2003), which placed Tancredo Neves high on the list of infested neighbourhoods and Centro somewhere in the middle. This year-to-year consistency at the neighbourhood scale contrasts with the apparently random risk of infestation at the household level. None of the investigated variables at household level (house type, presence and type of yard, number of households, access to piped water, presence of potential breeding sites, drinking water storage) was found to be significantly associated with the presence of eggs or the number of eggs collected. For some variables, a lack of association at the household level can be attributable to a lack of variation among houses (access to piped water, type of yard, for example). For other variables - such as the presence of potential breeding sites - a lack of association may be attributable to the type of trap used, which can attract mosquito females from the vicinity of the house itself. The infestation maps show that during the high infestation periods, Ae. aegypti is present through the entire neighbourhoods. In Boa Vista, the lack of strong external forces (such as temperature) may increase the role of stochasticity in infection demographics. Without a strong seasonal force, small oscillations in environmental variables (such as rainfall) may trigger large oscillations in disease incidence, as has been shown by mathematical models (Alonso et al. 2007). Poor predictability points to the need for continuous surveillance of vector density and dengue cases, especially during the rainy and transition seasons. Persistent differences between neighbourhoods in terms of Ae. aegypti density should be investigated further by integrated research approaches, combining anthropological and epidemiological methods to reveal the interplay between irregular water supply, urban environment and Ae. aegypti infestation (Caprara et al. 2009). As within-country travel to and from Boa Vista increases, the risk of a DENV 4 introduction in Brazil increases. The particular features of dengue dynamics in Boa Vista show the need for customized vector and dengue surveillance and control measures for this city. ACKNOWLEDGEMENTS To Almir Antônio Fontão Cunha, for logistical support in the field, and Antônio Miguel Monteiro (INPE), for the rainfall data. REFERENCES
Copyright 2009 - Instituto Oswaldo Cruz - Fiocruz The following images related to this document are available:Photo images[oc09139f2.jpg] [oc09139f1.jpg] [oc09139f5.jpg] [oc09139f4.jpg] [oc09139f3.jpg] [oc09139f6.jpg] |
| |||||||||