 |
| About Bioline | All Journals | Testimonials | Membership | News |
|
||||||
|
||||||
Memórias do Instituto Oswaldo Cruz, Vol. 105, No. 4, 2010, pp. 524-531 A geoprocessing approach for studying and controlling schistosomiasis in the state of Minas Gerais, Brazil Ricardo José de Paula Souza GuimarãesI, II; Corina Costa FreitasIII; Luciano Vieira DutraIII; Ronaldo Guilherme Carvalho ScholteI, II; Flávia Toledo Martins-BedéIII; Fernanda Rodrigues FonsecaIII; Ronaldo Santos AmaralIV; Sandra Costa DrummondV; Carlos Alberto FelgueirasIII; Guilherme Corrêa OliveiraI, II; Omar Santos CarvalhoI, + IInstituto
de Pesquisas René Rachou-Fiocruz, Av. Augusto de Lima 1715, Belo Horizonte,
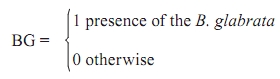
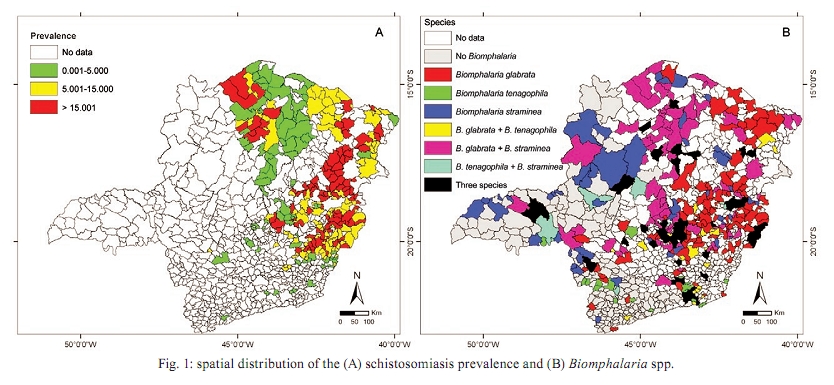
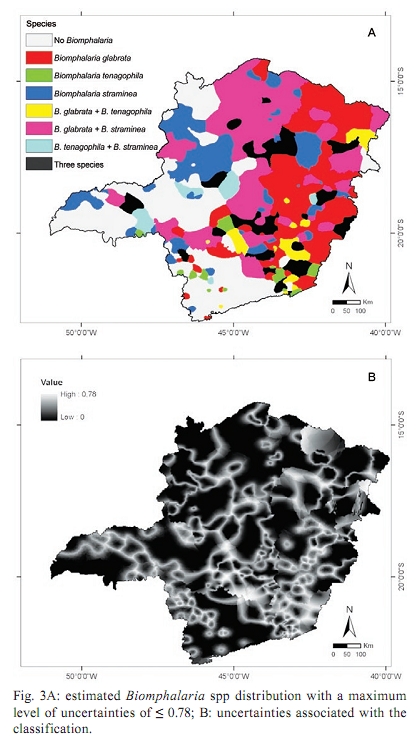
MG, Brasil Received 5 February 2009 Financial support: CNPq (302966/2009-9, 490336/2007-8, 380203/2004-9, 308253/2008-6), FAPEMIG (EDP 1775/03, EDT 61775/03), NIH-Fogarty (5D43TW007012) Code Number: oc10091ABSTRACT Geographical information systems (GIS) are tools that have been recently tested for improving our understanding of the spatial distribution of disease. The objective of this paper was to further develop the GIS technology to model and control schistosomiasis using environmental, social, biological and remote-sensing variables. A final regression model (R2 = 0.39) was established, after a variable selection phase, with a set of spatial variables including the presence or absence of Biomphalaria glabrata, winter enhanced vegetation index, summer minimum temperature and percentage of houses with water coming from a spring or well. A regional model was also developed by splitting the state of Minas Gerais (MG) into four regions and establishing a linear regression model for each of the four regions: 1 (R2 = 0.97), 2 (R2 = 0.60), 3 (R2 = 0.63) and 4 (R2 = 0.76). Based on these models, a schistosomiasis risk map was built for MG. In this paper, geostatistics was also used to make inferences about the presence of Biomphalaria spp. The result was a map of species and risk areas. The obtained risk map permits the association of uncertainties, which can be used to qualify the inferences and it can be thought of as an auxiliary tool for public health strategies. Key words: schistosomiasis - geographical information system - geostatistical procedures - Biomphalaria - multiple linear regression - epidemiology Schistosomiasis mansoni is an endemic disease in approximately 54 countries in the Americas and Africa (WHO 1985, Chitsulo et al. 2000). Schistosomiasis is facilitated by the presence of susceptible intermediate host mollusks of the Biomphalaria genus. The snail fauna of the genus Biomphalaria in the state of Minas Gerais (MG) are represented by seven species: Biomphalaria glabrata, Biomphalaria straminea, Biomphalaria tenagophila, Biomphalaria peregrina, Biomphalaria schrammi, Biomphalaria intermedia and Biomphalaria occidentalis (Katz & Carvalho 1983, Carvalho et al. 1987, 1988, 1989, 1994, 1997, 1998). In Brazil, there are three species of Biomphalaria (B. glabrata, B. tenagophila and B. straminea) that are naturally infected by Schistosoma mansoni. Among those found in MG, B. glabrata is considered the most important intermediate host due to its wide geographical distribution, high infection indices and efficient transmission of the disease. B. tenagophila is naturally infected by S. mansoni in MG and it is responsible for the maintenance of disease foci in the city of Itajubá (Katz & Carvalho 1983). B. straminea, although never found to be infected in MG, was considered responsible for the schistosomiasis focus in Paracatu (MG) (Carvalho et al. 1988). The mollusks of the Biomphalaria genus live in a wide range of habitats, particularly in shallow and slow-running waters, such as lakes, lagoons, wells, cisterns, swamps, brooks, irrigation ditches and drainage ditches, where the substratum can be a muddy or rocky bed and with floating or rooted vegetation. As these mollusks are distributed over large geographic areas and their populations are adapted to different environmental conditions, they can tolerate large variations in the physical, chemical and biological environment in which they live (Guimarães et al. 2008). The presence of mollusks of different species can be viewed as categorical data, which can be obtained by fieldwork. The geostatistical procedures for classifying spatial categorical attributes in a Geographical Information Systems (GIS) can be used to infer events in areas with no information, based on sample points of the categorical attribute under interest (Felgueiras 1999). Schistosomiasis distribution in MG is not regular, as areas of high prevalence are close to non-endemic regions. Therefore, despite advances in knowledge in the study of schistosomiasis, the disease remains a major public health problem in the country, requiring larger investments in preventive measures such as sanitation and health education, as well as in studies that enable disease control through geoprocessing methodologies (Guimarães et al. 2009). Because schistosomiasis is a disease determined in space and time by risk factors, the GIS is a powerful tool that might be used to better understand the disease prevalence and risk factor distributions. The joint use of GIS and statistical techniques permits the determination of risk factors and geolocalisation of risk areas, leading to the optimisation of resources and to the choice of better strategies for controlling the disease (Beck et al. 1997, 2000, Bavia et al. 2001). The influence of climate and environmental variables on the distribution of schistosomiasis has been documented by Appleton (1978) and Brown (1994). GIS has also been used to study schistosomiasis in several countries: in Asia (Cross et al. 1996), Brazil (Bavia et al. 2001, Freitas et al. 2006, Guimarães et al. 2006, 2008, 2009, Martins-Bedé et al. 2009), Chad (Beasley et al. 2002, Brooker et al. 2002), China (Zhou et al. 2001, Seto et al. 2002, Yang et al. 2005), Egypt (Malone et al. 1994, 1997, Abdel-Rahman et al. 2001), Ethiopia (Kristensen et al. 2001, Malone et al. 2001), Philippines (Cross et al. 1996), Tanzania (Brooker et al. 2001) and Uganda (Kabatereine et al. 2004). The main objectives of this paper were to develop geoprocessing methods and tools to characterise the spatial distribution of schistosomiasis to construct representative scenarios of potential schistosomiasis areas and to make inferences about the presence of the species of Biomphalaria (B. glabrata, B. tenagophila and/or B. straminea), the intermediate hosts of S. mansoni, in MG, Brazil. MATERIALS AND METHODS Schistosomiasis prevalence values were obtained from the Brazilian Schistosomiasis Control Program (SCP) through the Annual Reports of the Secretary of Public Health Surveillance and the Secretary of Health in MG. The SCP in MG began in 1986 and since 2000 has been under the coordination of the Secretary of Health in MG in collaboration with municipal health systems. The aim of the SCP is to prevent the occurrence of the hepatosplenic form and to prevent its transmission in focus areas (SESMG 2006). The Kato-Katz technique is the method used to determine prevalence, examining one slide per person. Data on the distribution of Biomphalaria mollusks were provided by the Laboratory of Helminthiasis and Medical Malacology of the René Rachou Research Institute. Mollusks were collected in breeding places from different municipalities in MG at different times, using scoops and tweezers and then packed to be transported to the laboratory (Souza & Lima 1990). Specific identification was performed according to the morphology of the shells, reproductive system and renal ridge of the mollusks (Deslandes 1951, Paraense & Deslandes 1955a, b, 1959, Paraense 1975, 1981) and more recently by low stringency polymerase chain reaction and restriction fragment length polymorphism (Vidigal et al. 2000). Moderate-resolution imaging spectroradiometer (MODIS) images were obtained for MG in two seasons, summer (from 17 January-1 February 2002) and winter (from 28 July-12 August 2002). MODIS images with 250 m of spatial resolution, which was used in this study, encompassed the blue, red, near-infrared and middle infrared bands, the normalised difference vegetation index (NDVI) and the enhanced vegetation index (EVI). The linear spectral mixture model is an image-processing algorithm that generates sub-pixel images with the appropriate proportion of each component (vegetation, soil and shade) inside the pixel, which is estimated by minimising the sum of the squares of the errors. In this work the so-called vegetation, soil and shade fraction images were generated using the MODIS data and the estimated values for the spectral reflectance components were also used as an input to the model. The digital elevation model (DEM) was obtained by the Shuttle Radar Topography Mission (SRTM). SRTM consisted of a specially modified radar system that flew onboard the Space Shuttle Endeavour during an 11-day mission in February 2000. The ground altitude used in this experiment is given by the value of SRTM DEM for each ground pair of coordinates in 90 m of spatial resolution. The local declivity was derived from SRTM DEM by an appropriate filtering approximation of a first-order derivative. The meteorological variables consisted of total precipitation and the minimum and maximum temperature for summer and winter seasons, which were obtained from the Centro de Previsão de Tempo e Estudos Climáticos of the Instituto Nacional de Pesquisas Espaciais, on the same date as MODIS images. The social variables used were from the Human Development Index (HDI): HDI-income, HDI-longevity and HDI-education for the years 1991 and 2000 (HDIE00). The environmental data (calcareous areas, sanitation and water quality, hydric and health indices) were obtained from the Companhia de Pesquisa de Recursos Minerais, the Brazilian Sistema Nacional de Indicadores Urbanos and the Fundação João Pinheiro. The spatial distribution of schistosomiasis prevalence and the Biomphalaria spp data are presented in Fig. 1A, B, respectively. Geostatistics methods and multiple linear regression were employed to estimate the presence of the intermediate host and the schistosomiasis disease, respectively. Geostatistics methods, such as kriging, are techniques to interpolate the value of a random field at an unobserved location from observations of its value at nearby locations (Guimarães et al. 2009). Regression analysis is a statistical technique that uses the relationship between two or more variables so that one can be predicted by the others (Freitas et al. 2006, Guimarães et al. 2006, 2008). Indicator kriging - The research area was situated in MG, with an approximate area of 588,384.30 km² in 853 municipalities. It includes 15 river basins: Buranhém, Doce, Grande, Itabapoana, Itanhém, Itapemirim, Jequitinhonha, Jucuruçu, Mucuri, Paraíba do Sul, Paranaíba, Pardo, Piracicaba/Jaguari, São Francisco and São Mateus. The Biomphalaria mollusk data included no information about their geolocation, which is a prerequisite for applying geostatistical procedures. To overcome this problem and the limitation of the maximum number of data entries of the Spatial Planning for Regions in Growing Economies software (Câmara et al. 1996), the mollusk attributes (class of species and localisation) were distributed along the drainage network of 15 river basins, according to the methodology used by Guimarães et al. (2009). The classes used for this paper were defined as B. glabrata, B. tenagophila, B. straminea, B. glabrata + B. tenagophila, B. glabrata + B. straminea, B. tenagophila + B. straminea, B. glabrata + B. tenagophila + B. straminea and without Biomphalaria. The class without Biomphalaria included information about the non-occurrence of Biomphalaria spp or information about non-transmitter species in Brazil, such as B. peregrina, B. schrammi, B. intermedia and B. occidentalis. Indicator kriging may be defined as a technique of statistical inference, which allows the estimation of values and the uncertainties associated with the attribute during the spatialisation of a sample property (Felgueiras 1999). It is a nonlinear estimator, which is applied on a sample set of the attribute whose values are modified according to a nonlinear transformation. According to Felgueiras (1999), indicator kriging is considered non-parametric because it does not use any kind of distribution of a priori probability for a random variable. Instead, it enables the construction of a discretised approximation of the cumulative distribution function of the random variable. Variogram models were fitted for each class, in each basin, through exploratory analysis, using the geostatistical procedures. These procedures involved the creation of experimental semivariograms and fitting them to mathematical theoretical models.The fittings were not automatic but interactive, because the users, after a first fit, check its suitability to the theoretical model (Camargo 1997). After model fitting, indicator kriging procedures were applied to obtain an approximation of the conditional distribution function of the random variables. Based on the estimated function, maps of mollusk spatial distributions along with the corresponding uncertainties for the entire basin were built. Linear regression models for prevalence risk estimation - In this paper, a relationship between schistosomiasis prevalence and the aforementioned variables was established by using multiple regression models. Because the prevalence data were provided at the municipality level, all input variables were integrated inside the municipalities' boundaries using GIS systems (ArcGis, Environment for Visualizing Images) and exported to a standard spreadsheet for statistical analysis and modelling. The multiple linear regressions were employed based on two approaches: the global model, where a linear regression model was established to estimate the disease throughout the state and the regional model, which consisted of two steps. In the first step, homogeneous and contiguous regions were determined for the state, using biological variables (related to the mollusk's habitat) and the Skater algorithm (Assunção et al. 2006, Martins 2008). The second step consisted of fitting different linear regression models for each region. The global and regional models were built using the data from the 123 municipalities, presented in Fig. 2, where prevalence information and presence or absence of B. glabrata are available. The fitted models were then used to build the risk map for the entire MG, by applying the models to the remaining municipalities. A logarithmic transformation for the dependent variable (prevalence, denoted by Pv) was made, as it improved the correlation with independent variables. Because multicollinearity effects among the independent variables were detected, a variable selection technique was used to choose a set of variables (or transformations of them) that better explained the dependent variable. The variable selection was done by the R2 criterion, using all possible regression procedures (Neter et al. 1996). This selection technique consists of the identification of a subset with few variables and a coefficient of determination, R2, sufficiently close to that when all variables are used in the model. Interaction effects were also included in the model. RESULTS All aforementioned variables were generated and put in a database using the software TerraView/TerraLib (http://www.dpi.inpe.br/geoschisto/). Kriging - The indicator kriging procedure, based on the fitted semivariograms, was applied using the sample data presented in Fig. 1B, to generate a regular grid of 250 m of resolution (x, y) over MG. The result was a map of the species distribution and a map of the uncertainties associated with the classification. Fig. 3A illustrates the classes associated with the Biomphalaria spp, with a maximum level of uncertainty of 0.78. The map of uncertainties (Fig. 3B) showed that the higher uncertainties were concentrated along class transition areas. Consequently, in regions where several classes may occur, more transitions were found and, therefore, higher uncertainties were obtained. Multiple linear regressions Global model - Fifty-one quantitative independent variables were used in the statistical analysis: meteorological, social and biological variables and remote sensing data derived from MODIS and SRTM. Besides quantitative variables, one qualitative variable (binary) was also used to represent the presence or absence of B. glabrata:
The analysis of the correlation matrix showed that some variables had non-significant correlations with Pv at a 95% confidence level and some variables were highly correlated among themselves, indicating that the model could be further simplified. After variable selection using the R2 criterion, the final chosen model was that with four variables: presence or absence of B. glabrata (BG), summer minimum temperature (TNs), winter EVI (EVIw) and water from springs or wells (WP). The final regression model, with R2 = 0.39, based on the 123 municipalities, was:
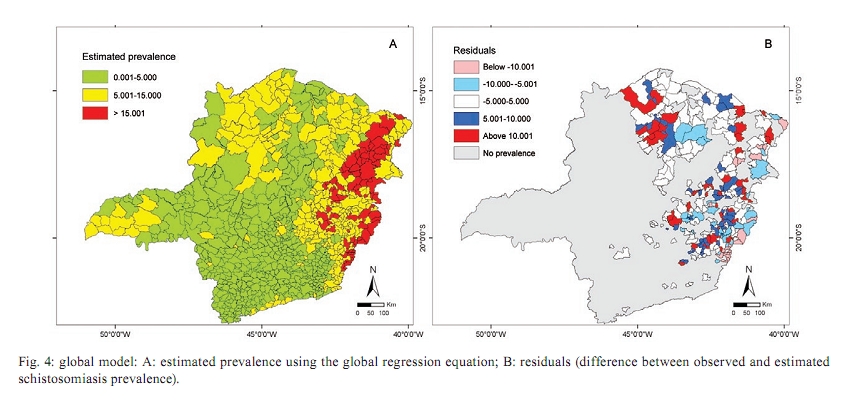
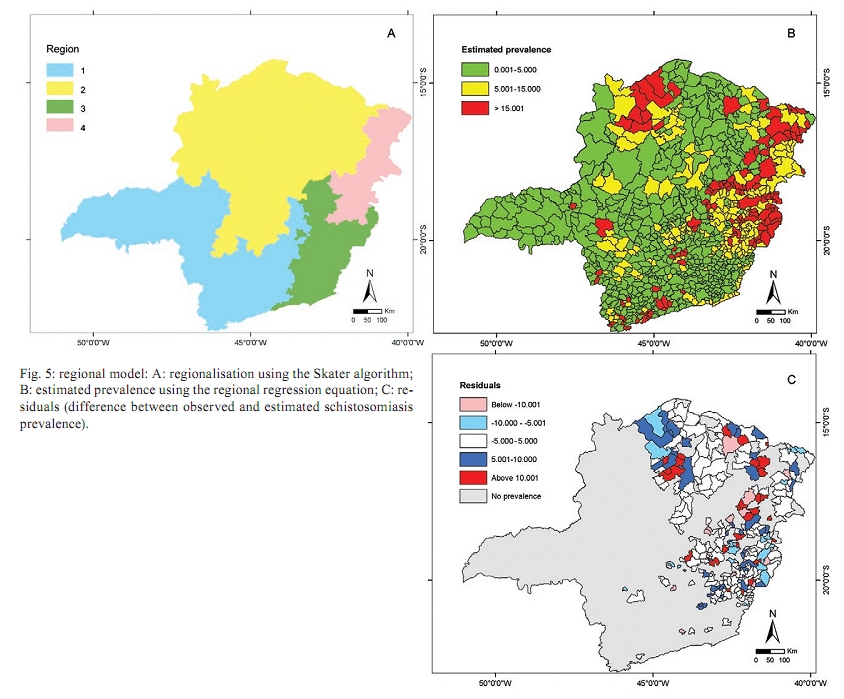
Fig. 4A shows the estimated prevalence for all MG municipalities using the above estimated regression equation. Fig. 4B shows the plot of the residuals, resulting from the difference between observed (Fig. 1A) and estimated (Fig. 4A) schistosomiasis prevalence. In Fig. 4B, dark colours (red and blue) represent overestimated values, light colours (red and blue) represent underestimated ones and in white are the municipalities where the estimated prevalence differed very little from the true values. Fig. 5A shows the result of the regionalisation. Fig. 5B shows the estimated prevalence for all MG municipalities using the above estimated regression equation. Fig. 5C shows the plot of the residuals. In this Fig., dark colours (red and blue) represent overestimated values and light colours (red and blue) underestimated ones, and in white are the municipalities where the estimated prevalences differed very little from the true values. The results indicate that during the summer season the risk of contracting schistosomiasis increases, probably due to high concentrations of the snails in the drainage, caused mainly by lack of sanitation and high temperature, among other factors and by people searching for hydric collections, for either drinking or bathing. The TN and the EVI were positively correlated with schistosomiasis prevalence. This is consistent with the adequate environmental conditions for the development of the intermediate hosts, as the snails settle in places with temperatures above 15°C and areas covered by vegetation. Additionally, our analysis showed that the presence of B. glabrata was directly related to the prevalence of the disease. Furthermore, the positive correlation of the variable WP may be related to the use of WP that is contaminated. The presence of B. glabrata increased the value of the prevalence compared to the municipal districts where B. glabrata was not found, as can be observed by the following calculations: Estimated increase
by averaging the data - From the prevalence data, it is possible to compute
the average of the prevalence for the municipalities with B. glabrata
( μ PG)
and without B. glabrata (μ
where PG indicates
the B. glabrata presence and Estimated increase by the regression - From equation (1) for the municipalities where B. glabrata was not found (BG = 0) then
and for the municipalities where B. glabrata was found (BG = 1)
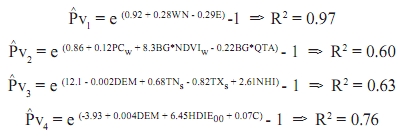
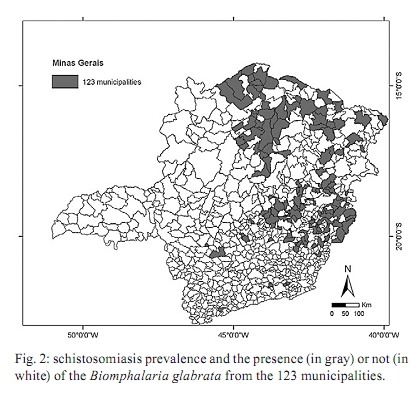
Because e0.49 = 1.63, it is possible to say that (disregarding the + 1 in the equations), on average, the municipalities with a prevalence of PG were approximately 63% larger than the municipalities lacking PG, which is not too far from the ratio of the average prevalence found before (1.46). Regional model - The regionalisation (division of MG into four homogeneous regions) was performed using the following variables: geology, hydrological index, Biomphalaria spp, EVIW, health necessity index, DEM, accumulated precipitation and average temperature. The result of the regionalisation is shown in Fig. 5A. The linear regression model for each of the four regions was developed with the same 51 variables used in the global model. For each of the four regions, a different number of variables were selected to generate the best regression models. The final models generated for each of the four regions were:
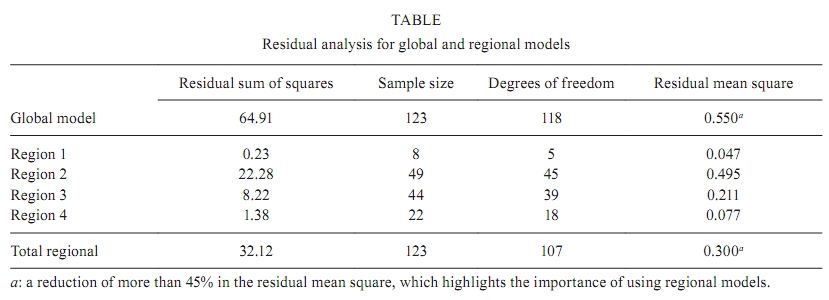
where WN: percentage of households with another form of access to water; E: percentage of households with bathroom or toilet and septic tank; PCW: winter precipitation; QTA: water percentage in the municipality; TXS: summer maximum temperature; NHI: need-of-health index; C: percentage of housing with bathroom or toiled connected to a ditch. The equation for Region 1 (R1) reflects the effect of the sanitation and the WN. This region was not an endemic area; there were only some foci of the disease. In this region, the R2 obtained was 0.97. Model 1 presents a variable access to water as the general model. The model described in Region 2 (R2) shows that the PG associated with the effect of vegetation (NDVIW) and QTA were the determining factors for schistosomiasis. The R2 obtained for this model was 0.60. For Region 3 (R3), the environmental characteristics related to the disease prevalence were DEM, NHI and the effect of the variability of the summer temperature. The R2 for this model was 0.63. The relation between the disease and temperature was expected, as during the summer seasons the risk of contracting schistosomiasis increases, due to the aforementioned factors in the global model. The model described in Region 4 (R4) shows that prevalence was associated with the DEM, HDIE00 and higher C. The R2 obtained was 0.76. These variables represent aspects of the topography that may or may not favour the formation of small water collections, where the snails can find propitious breeding conditions. The Table presents the residual sum of squares, sample size, degrees of freedom (sample size minus number of parameters in equation) and the residual mean square for the global model, for each region and for the total regional model. From this Table it can be seen that the residual mean square dropped from 0.55-0.3 (a reduction of more than 45%) when individual models were fitted for each region. This highlights the importance of using regional models. Overall, the global and regional models had at least one of the following characteristics: (i) the PG, (ii) environmental conditions favourable to disease transmission/habitat of the snails and (iii) sanitation. These characteristics are the same as those of epidemiological importance for the occurrence of disease: environmental conditions fostering the presence and development of snails (infection of the intermediate host) and presence or lack of sanitation (water contamination implies the presence of S. mansoni cercariae).
DISCUSSION The importance of the joint use of GIS and remote sensing for disease risk was demonstrated. In addition, we may conclude that the joint use of GIS and statistical techniques permitted the estimation of schistosomiasis prevalence. The generated results show that kriging is a consistent tool and that the obtained risk map can be used as an auxiliary tool to formulate proper public health strategies and guide fieldwork, considering the places with a higher probability of occurrence of the most important species. Variables from different sources (social, meteorological, remote sensing and biological) were used in this paper. Schistosomiasis prevalence was estimated by two models, a global and a regional, which showed that the PG, sanitation, vegetation index and temperature are important variables, as it appears in both global and regional models. Results of the regression models show that regionalisation improves disease estimation in MG. Moreover, the global and regional models also confirmed the importance of the use of biological variables to characterise the snail habitat in the endemic area of MG. Most of the selected explanatory variables were related to sanitation and water and health quality or were directly related to the presence of the snail. The use of regionalisation also improved generalisation, especially in the non-endemic areas, where the schistosomiasis prevalence data are scarce. Martins-Bedé et al. (2009), using socioeconomic variables for regionalisation and applying the same methods cited in this paper, also obtained superior results with the regional model compared to the global model. It is interesting to note that the variables selected for each region are consistent with the socio-environmental conditions in each of them. R1, the most developed region, is influenced mainly by sanitation. Sanitation is also an important factor for R4, which is the poorest and least developed region. Additionally, these regions have municipalities with the highest schistosomiasis prevalence in MG. The topographical factors and the temperature effect become important in R3 and R4, where the largest differences in altimetry occur. Factors such as rain, amount of water and vegetation are important in R2, which is the driest region of MG. This paper can contribute significantly to the choice of strategies by public health officials, allowing them, on the one hand, to narrow the set of municipalities in MG for which treatment and sanitation should be priorities and, on the other hand, to focus on preventive measures in the municipalities where transmission can occur. The next phase of this study will estimate schistosomiasis prevalence using locality data (localities that have coordinate and prevalence information). ACKNOWLEDGEMENTS To Dr José Carlos N Epiphanio, Dr Márcio M Valeriano, Dr Eduardo CG Camargo, Dr Fausto L Stefani and Renata PP Amaral. REFERENCES
Copyright © 2010 - Instituto Oswaldo Cruz - Fiocruz The following images related to this document are available:Photo images[oc10091f2.jpg] [oc10091t1.jpg] [oc10091f4.jpg] [oc10091f3.jpg] [oc10091f1.jpg] [oc10091f5.jpg] |
| |||||||||
