 |
| About Bioline | All Journals | Testimonials | Membership | News |
|
||||||
|
||||||
Memorias do Instituto Oswaldo Cruz, Vol. 106, No. 7, November 2011 New tools for epidemiology: a space odyssey Robert Bergquist* Ingerod, Brastad,
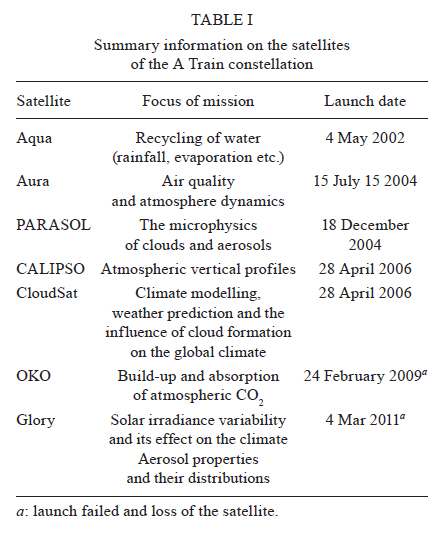
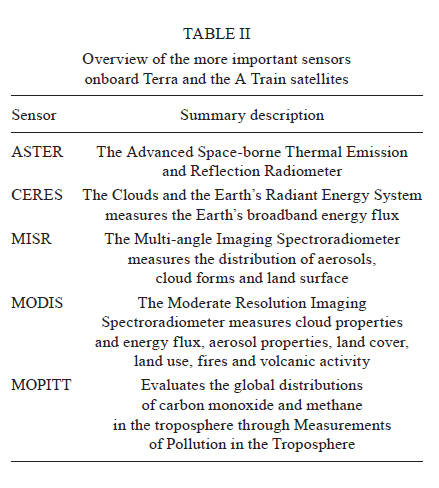
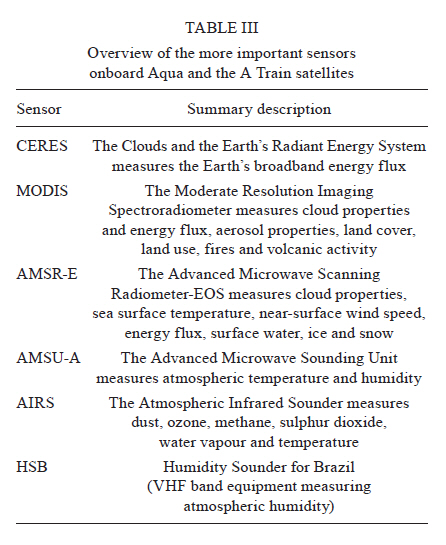
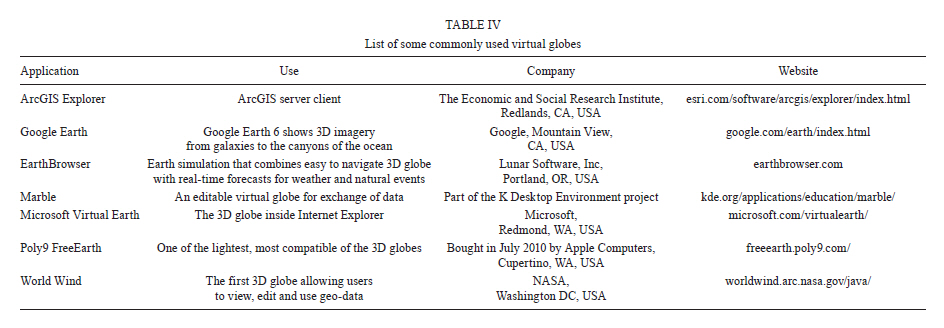
Sweden Code Number: oc11178 ABSTRACT Geographical Information Systems (GIS) facilitate access to epidemiological data through visualization and may be consulted for the development of mathematical models and analysis by spatial statistics. Variables such as land-cover, land-use, elevations, surface temperatures, rainfall etc. emanating from earth-observing satellites, complement GIS as this information allows the analysis of disease distribution based on environmental characteristics. The strength of this approach issues from the specific environmental requirements of those causative infectious agents, which depend on intermediate hosts for their transmission. The distribution of these diseases is restricted, both by the environmental requirements of their intermediate hosts/vectors and by the ambient temperature inside these hosts, which effectively govern the speed of maturation of the parasite. This paper discusses the current capabilities with regard to satellite data collection in terms of resolution (spatial, temporal and spectral) of the sensor instruments on board drawing attention to the utility of computer-based models of the Earth for epidemiological research. Virtual globes, available from Google and other commercial firms, are superior to conventional maps as they do not only show geographical and man-made features, but also allow instant import of data-sets of specific interest, e.g. environmental parameters, demographic information etc., from the Internet. Key words: GIS - remote-sensing - satellite - spatio-temporal epidemiology - parasite - climate change The idea to of linking diseases and geographical locations was first mentioned by Hippocrates (460-377 BC) in his "Airs, Waters and Places". However, it was not until modern technology made it possible to collect extensive data-sets and visualize them in the form of maps that this approach became widely used (Rinaldi et al. 2006). While sporadic progress had been made in the XVIII century, the most famous example was the tracing of a cholera outbreak in London to a particular well in the Soho district (Snow 1855). Surprisingly, in spite of the germ theory making headlines about the same time, the causal relationship between the cholera bacterium and the disease it causes was never fully verified in this case. The invention of the microscope almost 200 years earlier notwithstanding, another three-four decades passed until the role of bacteria as infectious agents became fully appreciated. However, it was not until Geographical Information Systems (GIS) data from satellites and computer-assisted applications joined forces that the true versatility of GIS and remote sensing came into its own. The progress is just as impressive with respect to mathematical modelling and spatial statistics. Indeed, modern stochastic modelling provides a powerful approach to study historic disease outbreaks that was previously unattainable due to lost information and multi-sourced databases. For example, in their study of the epidemic of bubonic plague in India, 1896-1906, Yu and Christakos (2006) could generate informative spatio-temporal maps of mortality rates and use them to provide a novel perspective on the distribution and propagation of this epidemic. This methodology can also be applied to evaluate the risk for plague today as shown in the central highlands of Madagascar by Rahelinirina et al. (2010). They could correlate the spatio-temporal variability in the distribution of this disease with augmented activity in the endemic foci coupled with increased populations of Rattus rattus, the main rodent host of Yersinia pestis. Air-borne photography revolutionized cartography but the breakthrough that made the technique useful also for other applications did not come until standardized views of the terrain could be shown and the instruments could cover the full electromagnetic spectrum from ultraviolet to radio wavelengths. Indeed, the convergence of spectral physics, earth sciences, computer technology and advanced statistics has resulted in an array of advanced tools suitable for epidemiological investigation (Brooker & Michael 2000). These techniques are particularly useful for the study of parasitic infections, which rely on intermediate hosts to complete their lifecycles and vectors for expanding the distribution. Since not only their hosts/vectors, but also the parasites themselves, are sensitive to changes in many variables, the temperature in particular, the limits for the distribution can be estimated with a good level of accuracy. Therefore, remotely-sensed terrestrial variables, such as temperature, rainfall, humidity, vegetation etc., effectively decide the distribution of leishmaniasis, malaria and schistosomiasis and other organisms, whose lifecycles involve many steps that cannot be rapidly adjusted. The number of publications in which these methods are described is increasing exponentially (Hendrickx et al. 2004, Cringoli et al. 2005, Rinaldi et al. 2006, Bergquist & Rinaldi 2010). Due to changes in climate and environment, several vector-borne diseases have (re)-emerged and spread into new (or previously controlled) areas (Hendrickx et al. 2004, Rogers & Randolph 2006). Areas into which certain diseases can be expected to expand have been noted for schistosomiasis in Northern China (Yang et al. 2006) and for malaria, leishmaniasis and dirofilariasis in Northern Europe (Genchi et al. 2005, 2009). Other important factors driving the (re)-emergence and spread of vector-borne parasites include vector habitat changes (Bhunia et al. 2011), pollution, resistance to pesticides and drugs and the general fall-out from globalization (Harrus & Baneth 2005). The changing distribution of previously strictly localized endemic veterinary and human infections include Babesiosis, bluetongue viral infection, chikungunya, dengue fever, Lyme disease, tick-borne encephalitis, trypanosomiasis, West Nile virus disease and many more (Takken & Knols 2007). Geographical Information Science/Geographical Information Systems - The "S" in GIS could just as well stand for "Science" as for "Systems" and even if the former would be preferable (Goodchild 2000, Kistemann et al. 2002), most people use the latter. However, rather than dwell on semantics, the GIS acronym has become the nomen proprium for the tool that few medical and veterinary epidemiologists can manage without. Depending on its application, slightly different definitions of GIS appear (Brooker & Utzinger 2007, Simoonga et al. 2008), but the most common understanding of the term can be summed up as "a powerful set of tools for collecting, retrieving at will, transforming and displaying spatial data from the real world" as proposed by Burrough (1986) early on. In my opinion, one of the exceptional capabilities of GIS is the simultaneous visualization of various pieces of information, e.g. data related to health and data related to the environment. Classical geographic maps provide a finite set of data, e.g. the roads and cities, whereas GIS delivers flexible, digital cartography with data processing and analysis included. For example, it can show qualitative, general distribution maps and point-maps as well as quantitative maps with proportioned peaks. In addition, representations such as proportional circle maps, choroplethic maps and isoplethic maps, display the number of cases of a disease, the population at risk, the prevalence, the incidence, the intensity of infection etc. (Thrusfield 1995, Cringoli et al. 2005). GIS can also be used for "transect sampling" of fixed, immobile objects. This involves choosing a line, or a series of lines, along which the counts take place as used by Biggeri et al. (2006). Another useful GIS function is Kriging, which is a linear interpolation method based on a random-function covariance model utilized for predicting the values of a variable at unsampled points based on observations at known locations (Berke 2004). Kriging is widely used for the interpolation of climate data from meteorological stations and for modelling the distribution of various parasites and vectors, e.g. Ixodes scapularis (Nicholson & Mather 1996), malaria (Kleinschmidt et al. 2000), alveolar echinococcosis (Pleydell et al. 2004), tsetse (Sciarretta et al. 2005), Calicophoron daubneyi (Biggeri et al. 2004) and Oncomelania hupensins (Zhang et al. 2005). GIS data can be visualized by using either vectors or rasters. The former is based on storing tables containing the coordinates of points together with instructions how to find points that are independent and which ones belong to a common set. All lines are represented by vector chains and all areas by polygons, while the attributes can be entered into separate tables using alphanumeric characters to label the specific classes or categories of properties. The raster data model, on the other hand, uses a net of adjacent polygons (or cells) to provide a virtual cover of a given part of a territory. These pixels will eventually contain the attributed values of the objects they are assigned to represent. This type of visualization is typically utilized to represent continuous phenomena, e.g. land cover maps, digital elevation models and climate distributions. Remote sensing - Even if Earth-orbiting satellites and their instruments were originally put in place for military purposes, remotely-sensed information provides also useful insights on geo-climatic, ecological and anthropogenic factors related to transmission levels and patterns of many communicable diseases. Although Cline (1970, 2006) first realized the possibilities on offer for epidemiological research more than 40 years ago, it took more than a decade before medical and veterinary research papers in this area started to appear more than sporadically. The situation is totally different today: the satellite technology assists both control activities and epidemiological research at all levels, in particular as health-related research is increasingly dependent on near-real time information. Still, there are many traps that need to be avoided when applying remote-sensing (Herbreteau et al. 2005). The number of active satellites in use for the support of communication, broadcasting and surveillance varies between 900-1,000. A detailed list of past and present orbiting satellites can be found at the website of the Geospatial Data Service Centre (gdsc.nlr.nl/gdsc/information/earth_observation/satellite_database). Geostationary satellites, such as the Geosynchronous Orbiting Environmental Satellites launched by the National Oceanic and Atmospheric Administration (NOAA), are used for communication and meteorology. These satellites are of limited use for epidemiological purposes as they "sit still" at high altitudes (around 36,000 km), while those passing over the Polar Regions relay longitudinal sweeps, eventually covering the whole surface of the globe. These satellites follow 50 times lower elliptical orbits of about 100 min with "revisit" periods between one-41 days. For the epidemiological point of view, the sensors must be capable of producing high-resolution images, yet show large areas at different wavelengths. In fact, the resolution capabilities, be it spatial, temporal or spectral, effectively restrict data collection since a high spatial resolution is always associated with a low spectral resolution and vice versa. The first satellites were sent up in the late 1950s by the Russians. Their successful Sputnik programme forced the United States of America (USA) to embark on an ambitious space programme, a large part of which was focused on collecting spectral information from the Earth's surface. The remote-sensing science, consisting of a series of satellite missions jointly managed by the National Aeronautics and Space Administration (NASA) and the Geological Survey, originated and matured with the Landsat Program, was initiated in 1972. Its sensors have a moderate spatial resolution, coarse enough for global coverage yet detailed enough to characterize human-scale constructions. The multispectral scanner and thematic mapper are the most useful sensors for epidemiological approaches. Landsat-7, the latest satellite in this series has eight spectral bands with a spatial resolution ranging from 15-60 m and was launched on April 15, 1999. The next satellite planned, the Landsat Data Continuity Mission (LDCM), is scheduled to be launched in December 2012. It will monitor land and water use, support disaster response and provide evaluations of the collected data. The LDCM measurements will also serve National Aeronautics and Space Administration (NASA) research in the areas of climate, carbon cycle, ecosystems, water cycle, biogeochemistry and Earth observation. The timeline of the Landsat programme is provided at (landsat.gsfc.nasa.gov/about/timeline.html). The satellite-borne sensors permit calculation of vegetation indices, land surface temperatures, atmos-pheric and soil moisture, rainfall etc. The Normalized Difference Vegetation Index (NDVI) is among the most common vegetation indices used. It is defined as the difference between the visible (RED) and near-infrared (NIR) bands over their sum, i.e. (NIR - RED)/(NIR + RED), which is a specific measure of chlorophyll abundance and light absorption. However, The NDVI can be extended to quantify herbaceous vegetation biomass, vegetation primary productivity, vegetation coverage and growth periodicity, including the impact of all these factors on parasite lifecycles. Apart from topography, water-bodies, soil, predominant vegetation, rainfall, humidity etc., information of interest for the epidemiologist also includes indicators of human activities such as land use, cities, roads, bridges and other infrastructures. The Corine Land Cover provides all this on a map of the European landscape at the spatial resolution of 100 m based on visual interpretation of widely used satellite images. The land cover categories are hierarchically organized into three levels: (i) artificial areas, agricultural areas, forests/semi-natural areas, wetlands and water bodies, (ii) physical and physiognomic entities at a higher level of detail, e.g. urban zones, forest types, lake types etc. and (iii) a number of subcategories based on further, less pronounced details (eea.europa.eu/data-and-maps/data/corine-land-cover-2000-clc2000-seamless-vector-database). NOAA satellites and their instruments - The primary sensor on board the Landsat satellites is the Advanced Very High Resolution Radiometer (AVHRR) instrument. Since 1981, this imager has been able to determine the temperature of cloud covers and surfaces such as land, water or the upper surfaces of clouds at the resolution of about 1 km (noaasis.noaa.gov/NOAASIS/ml/avhrr.html). NOAA has at least two polar-orbiting satellites in orbit at all times with one satellite crossing the equator in the early morning and early evening, the other in the afternoon and late evening. Together they provide twice-daily global coverage and ensure that data for any region of the earth are never more than six hours old, a very high temporal resolution. Morning-satellite data are used for land studies, while data from both satellites facilitate atmosphere and ocean studies. The first AVHRR was a four-channel radiometer launched in October, 1978 with a swath width of approximately 2,500 km (ncdc.noaa.gov/oa/pod-guide/ncdc/docs/klm/html/c1/sec1-2.htm). The current version is the six-channel AVHRR/3 on board NOAA-19 launched in February, 2009 (en.wikipedia.org/wiki/NOAA-19), which permits multi-spectral analysis for more precisely defining hydrologic, oceanographic and meteorological parameters. Comparison of data from two channels can be used to observe features or measure various environmental parameters. Satellite Pour l'Observation de la Terre (SPOT) - The French SPOT satellite programme is a series of high-resolution, optical imaging system, which primarily explores Earth resources, but also supports studies of the climate, the oceans, human activities and natural phenomena (en.wikipedia.org/wiki/SPOT_satellites). The SPOT programme was initiated by the French space agency Centre National d'Etudes Spatiales in the 1980s and developed in association with the Belgian Scientific, Technical and Cultural Services (SSTC) and the Swedish National Space Board (SNSB). The system includes ground control resources for satellite control and programming, image production and distribution run by SPOT Image, Toulouse, France. SPOT 5, with multi-spectral picture resolution capabilities of 10, 5 and 2.5 m, is the latest satellite in the series. However, a new constellation, consisting of SPOT 6 and SPOT 7, is planned for launch by 2012 and 2013, respectively. These satellites will have a footprint of 60 m2 and feature 1.5 m resolution (en.wikipedia.org/wiki/SPOT_(satellite)#SPOT_6_and_SPOT_7). The international Earth Observing System (EOS) asks you to take the A Train - Terra is the first satellite in the EOS Program, which is a major component of the Earth Science Division of NASA's Science Mission Directorate. EOS represents a coordinated series of polar-orbiting satellites observing the oceans, land cover, biosphere and atmosphere. Terra was sent up in 2000 and began collecting what will ultimately become a 15-year global set of data representing Earth as an integrated whole. Terra carries a payload of five sensors designed to monitor the state of the environment and ongoing changes in its climate systems (terra.nasa.gov/About/). In 2002, this satellite was joined by Aqua, the first of a fleet of seven satellites flying in a formation called the "A Train" (csc.gallaudet.edu/soarhigh/A-TrainExplain.html) designed to collect information on climate parameters with special reference to how extreme events develop. The A-Train formation provides coordinated measurements, i.e. data from several different satellites are used together to obtain comprehensive information about atmospheric components and processes [Table I]. The Moderate Resolution Imaging Spectroradiometer (MODIS) and the sensor investigating the Clouds and Earth Radiant Energy System are the only instruments onboard both Terra and Aqua. MODIS is one of the most useful multi-purpose sensors as it acquires data in 36 spectral bands, or groups of wavelengths, from the entire surface of the Earth every one-two days. It is probably the instrument with the greatest utility for biological research. The orbits of these two twin satellites are chosen so that Terra passes from north to south across the equator in the morning with Aqua moving in the opposite direction in the afternoon. In this way, a high temporal resolution is obtained without loss of image quality. Tables II and III provide a summary of the sensors onboard Terra and Aqua and their foci of data collection. IKONOS and GeoEye - When the USA Company Space Imaging, launched IKONOS in 1999, it was the first commercial satellite designed to collect and sell high-resolution optical imagery. The launch was then heralded as one of the most significant developments in the history of the space age. For the first time, panchromatic (black and white) and multispectral imagery of high resolution became available for researchers, as well as to the general public (en.wikipedia.org/wiki/IKONOS). The IKONOS satellite, deriving its name from the Greek word eikŌn (image), marks the beginning of a new industry, which has amazingly transformed the world in just a decade. In September, 2005, Space Imaging was acquired by another USA company, Orbital Imaging Corporation, and renamed GeoEye (www.geoeye.com/). The integrated imaging payload onboard IKONOS enables the satellite to collect panchromatic (black and white) images at the 1 m resolution and multi-spectral data at the 4 m resolution. At this level, buildings and other man-made structures are clearly visible. The sensors capture imagery across an 11 km swathe of the Earth's surface. Once an image is obtained, a digital processing unit compresses and formats the digital imagery for transmission to ground stations located throughout the world. In 2008, GeoEye-1 was launched. It can identify objects half a meter wide but is capable of reaching a ground resolution of 0.41 m in the panchromatic mode, which means that individual people can be spotted. However, due to licensing restrictions, customers other than the USA government are only allowed to purchase images that have been blurred to the half-meter resolution (launch.geoeye.com/LaunchSite/assets/documents/GeoEye_Popular_Science.pdf). QuickBird and WorldView - QuickBird constitutes the next step in visible, high-resolution surface scanning. This satellite was launched in 2001 as the first of a planned constellation of three. It orbits at a 450 km high, sun-synchronous orbit and displays panchromatic imagery at the 0.6-0.7 m resolution and multi-spectral imagery at 2.4 and 2.8 m. The imagery can be imported for analysis into most GIS software packages. A USA commercial company, DigitalGlobe (en.wikipedia.org/wiki/DigitalGlobe) launched and owns QuickBird and its customers range from urban planners to USA federal agencies. For example, much of the high-resolution imagery available from Google Earth and Google Maps is provided by DigitalGlobe. DigitalGlobe also owns WorldView-1, a satellite built by the Ball Aerospace company (.ballaerospace.com/) and launched in 2007. This satellite has a camera with a panchromatic 50-cm maximum-resolution capability, while the next satellite in this series that was launched in 2009, WorldView-2, provides 0.46 m panchromatic mono and stereo satellite image data (.spaceflightnow.com/news/n0701/07worldview2/). With its improved agility, WorldView-2 is able to sweep back and forth to collect very large areas of multispectral imagery in a single pass. In this way, the instruments onboard WorldView-2 can collect nearly 1 million km2 every day, doubling the collection capacity of WorldView-1. The combination of this capacity and its relatively high altitude enables the satellite to reach a revisit time of just over one day. Spatial-temporal modelling and statistics - Stochastic modelling is becoming increasingly applicable to the study of disease propagation, and spatio-temporal modelling is currently one of the most challenging research areas in epidemiology and environmental health. The number of theoretical papers, as well as methodological development and field application, is growing fast. For vector-borne diseases in particular, the spatial and temporal characteristics of natural transmission play an important role as even minute variations in temperature and rainfall result in almost immediate changes in their distribution. As a consequence, spatio-temporal modelling is increasingly applied for a wide variety of arthropod and snail-borne diseases affecting both humans and animals, e.g. dengue fever (Pongsumpun et al. 2008, Tipayamongkholgul & Lisakulruk 2011), leishmaniasis (Ready 2008, Brandão-Filho et al. 2011), malaria (Mabaso et al. 2006, Dongus et al. 2009, Dogan et al. 2010), Rift Valley fever (Vignolles et al. 2009), bluetongue (Racloz et al. 2008, Willgert et al. 2011), schistosomiasis (Wu et al. 2007, Hu et al. 2010, Martins-Bedê et al. 2010), food-borne trematode infections (Suwannatrai et al. 2011) and plague (Rahelinirina et al. 2010). As mentioned above, applications even include historic epidemics (Yu & Christakos 2006). Methods to quantify excess risk and identify space-time disparities with regard to health interventions for poor children have also emerged and provide useful and detailed information for guiding policy. For example, a spatio-temporal analysis was performed by Sartorius et al. (2011) to identify risk factors associated with child mortality in a rural area in South Africa. A distinct spatial risk pattern was observed with higher risk areas being concentrated in poorer settlements. This study demonstrates the use of Bayesian geostatistical models for accurately quantifying risk factors and producing maps of child mortality risk in a health and demographic surveillance system. A similar approach in the veterinary sciences (bovine Fasciola infection) was also successful (Durr et al. 2005). Maps based on raw data are generally difficult to interpret due to differences in disease occurrence between areas. This can partly be blamed on "noise" in the sampling process, but the main reason is often that the data derive from the sum of true, structural differences. This problem is well-known in human epidemiology and several statistical analyses have been proposed to filter out the noise from the signal (Elliott et al. 2000). Some of these techniques have been used also in veterinary medicine, e.g. regarding paramphistomosis (Biggeri et al. 2005), echinococcosis (Berke 2004, Budke et al. 2005), bovine spongiform encephalitis (Abrial et al. 2005), dicrocoeliosis and haemonchosis (Biggeri et al. 2007), mastitis (Green et al. 2004) and foot and mouth disease (Lawson & Zhou 2005). Climate-based forecast systems have been developed using the concept of Growing Degree Days (GDD), a heuristic tool first used by horticulturists to predict flowering. GDD are calculated by taking the average of the daily maximum and minimum temperatures compared to a base temperature, Tbase using the equation GDD = (Tmax + T min)/2 - Tbase. When applied to parasites, the GDD concept can be useful in predicting risk and in deciding on disease intervention. This approach has been used for predicting fasciolosis, schistosomiasis, malaria (Malone 2005) and dirofilariosis (Genchi et al. 2005). Predictive maps can be obtained by application of (i) heuristic statistical algorithms, (ii) standard statistical approaches (extensions of regression modelling, linear discriminate analysis in case of multivariate data, or a generalized linear mixed model in case of unmeasured source of variability) or (iii) Bayesian statistical approaches (e.g. the Markov Chain Monte Carlo technique). This field, including applicatory examples of these techniques, has been reviewed by Pfeiffer (2004). Ecological analysis - The computational power available today is capable of achieving high prediction accuracy as it allows modelling of detailed physiological and physical processes, including large numbers of species and individuals. As predicted by Levin et al. (1997), the quality and quantity of spatio-temporal data and the data assimilation capabilities are reaching the level where even the complexities of ecology can be approached. The main application field of GIS in veterinary and public health is epidemiological and it benefits from the capability of GIS to integrate different databases into one environment (Herbreteau et al. 2005). This type of analysis is based on a statistical procedure and targets the description of relationships existing between the geographic distribution of diseases and environmental risk factors (Kistemann et al. 2002). The NDVI, land cover, land use, elevation, slope, aspect, lithofacies, lakes, rivers and other water bodies, temperature, rainfall and humidity are the most commonly used environmental and climate features in the data-layers for ecological analysis in veterinary epidemiology. Once this information has been obtained, the ecological analysis is carried out by associating the disease data with the environmental characteristics extracted within the buffer zones constructed around the geographic unit(s) of interest (Cringoli et al. 2005, Rinaldi et al. 2006, Pozio et al. 2009). Early-Warning Systems (EWS) and surveillance - GIS applications lend themselves to the development of EWS needed to permit preemptive planning to limit risk and impact of emerging new diseases. Early identification is an important first step towards implementing effective interventions to control epidemics and reduce the impact on humans and/or animals (Estrada-Peña et al. 2007). Biology-driven models have a particular potential of assessing current and future risk patterns for vector-dependent parasitic infections. EWS are defined as all initiatives leading to improved awareness and knowledge of the distribution of disease or infection and that might permit forecasting of the further evolution of an outbreak (FAO 1996). The ability to produce frequently updated data on environmental variables pertinent to vector-borne disease transmission makes GIS and remote-sensing useful resources for the development of EWS (Ceccato et al. 2005). However, rather than passive monitoring, a surveillance system should have the capability of transferring new information with regard to the disease in question. To that end, an integrated set of epidemiological measures aiming at the identification and prevention of new cases in the population under control is desirable. Surveillance must feature characteristics independent from the techniques used for case collection, an aspect which is evident when the geographical dimension is considered and where discontinuities in the spatial rate of a disease must be discovered. Naturally, surveillance must include diagnostics with high sensitivity and specificity for the identification of possible new cases of disease, or any variation on the natural rate (Johansen et al. 2010). The difficulty in interpreting clusters of cases of disease lies in determining whether to attribute them to an epidemic or to a minor alteration in the occurrence of the disease in question (Elliott et al. 1992, 2000, Aylin et al. 1999). The development of a GIS infrastructure is a long-term process in which a wide variety of critical issues, such as technological requirements, people, institutional frameworks, inter/intra-institutional relationships and policies, must be considered. Ferre et al. (2011) have produced a most helpful "do-it-yourself" approach, including the aspects mentioned above, for the early warning of emerging and re-emerging diseases. Virtual globes - Although various virtual globes are now available over the Internet, Google Earth (google.earth.com) currently dominates the market. This portrayal of the world is a virtual, computer-based model of the Earth where the user can freely change area, viewing-angle and position. The views are interchangeable and can denote geographical features, man-made features (roads, buildings etc.) as well as quantitative data-sets on demography, economy or any other measure the user might wish to choose. An overview of the developments in this field during the last decade shows that possible uses for this new representation of the world are almost endless (Elvidge & Tuttle 2008). World Wind, created by NASA's Learning Technologies project as an open-source 3D interactive world viewer (worldwind.arc.nasa.gov/java/), was released in mid-2004, making it one of the first applications in this field to be made available for public use. Both Google Earth and World Wind permit saving downloaded imagery to the user's hard disk enabling previously accessed areas to be viewed offline. Google Earth, however, must be activated by first logging into its server and its cache size is limited to 2,000 MB, whereas World Wind has no limit on cache size and comes with the complete 500 m resolution Blue Marble imagery. It is also capable of displaying MODIS imagery from the Jet Propulsion Laboratory's Aqua and Terra satellites. Google Earth, on the other hand, is not only capable of displaying a multitude of urban areas in high-resolution thanks to their private image sources, but acquires also images captured by flights and terrestrial rovers that can show particular views, e.g. street scenes from major cities. Virtual globe technologies are essentially tools with some of the functionality of applied GIS, which provides a relatively inexpensive, more accessible method to communicate epidemiological data to non-specialists (Stensgaard et al. 2009). Although most applications are general-purpose applications with limited analytic functions, they cannot in any way replace professional GIS software. Still, access to a virtual globe is useful as a complement to traditional GIS and it is therefore not out of place to list some of the tools available besides Google Earth [Table IV]. Thanks to the Internet and the mobile computer technologies, information is now available everywhere, including in the field. Risk-mapping using digital geospatial data resources has become an established analytical tool both for human and veterinary public health. Since a high spatial resolution is associated with a low spectral resolution and vice versa, data collection must be adjusted to each individual application. Disease surveillance systems and EWS are prime examples of systems with immediate practical application, while the construction of virtual globes for epidemiological research are becoming increasingly important for displaying results in an easily understandable manner. REFERENCES
Received 14 May
2011 Copyright 2011 - Memorias do Instituto Oswaldo Cruz The following images related to this document are available:Photo images[oc11178t4.jpg] [oc11178t2.jpg] [oc11178t1.jpg] [oc11178t3.jpg] |
| |||||||||