 |
| About Bioline | All Journals | Testimonials | Membership | News |
|
||||||
|
||||||
Use of Isozyme Patterns in the Identification of Biomphalaria tenagophila (D'Orbigny, 1835) and B. occidentalis (Paraense, 1981 ) (Gastropoda: Planorbidae) Douglas Mascara, Joao Stenghel Morgante* Departamento de Biologia, CCB, Universidade Federal de Santa Catanna, 88049-000 Florianopolis, SC, Brasil *Instituto de Biociencias, Depto. de Genetica, Universidade de Sao Paulo Caixa, Postal 11461, 05422-970 Sao Paulo, SP, Brasil
Code Number: OC95072
Size of Files:
    Text: 28K
    Graphics: Line Drawings (gif) 16K
              Photos (jpg) 63K / Halftones (gif) 67K
Two sibling species of Biomphalaria, B. tenagophila and B. occidentalis were identified using isozyme patterns obtained by horizontal gel electrophoresis. Six diagnostic enzymatic loci were identified in digestive gland homogenates. The results enable us to distinguish the species, calculate the Nei's coefficient of genetic similarity, atwl provide a basis for making inferences about the pattern of these two plonorbid species colonization and distribution. Key words: Biomphalaria tenagophila - Biomphalaria occidentalis-jisoenzyme patterns- sibling species - biochemical taxonomy Biomphalaria occidentalis and B. tenagophila are species which are indistinguishable from the shell, but separable by characteristics of some of the genital organs (Bailey et al. 1986). Paraense (1981) demonstrated in laboratory studies complete reproductive isolation between these species. These two species are sympatric in part of their ranges (Teles 1989), and have been found together in breeding sites in localities in the State of Sao Paulo, Brazil (Teles 1988). Since B. occidentalis is not susceptible to infestation by the trematode Schistosoma mansoni (Paraense & Correa 1982), the identification of these species is important for the epidemiological study of schistosomiasis. The objective of the present study was to utilize starch and acrylamide gel electrophoresis to define isozyme patterns that might contribute to the identification of these planorbids. MATERIALS AND METIIODS Samples - Population samples were collected in the State of Sao Paulo. Collections were made at 14 localities between May 1987 and August 1988. Nine samples of B. tenagophila and six of B. occidentalis were obtained (Fig. 1). The collected specimens were maintained in 25-liter aquaria containing non-chlorinated water at room temperature and fed on fresh lettuce leaves. The specimens were observed for 40 days to determine whether they released any type of cercaria.
When this did not occur, the snails were used to prepare homogenates for electrophoresis.
Electrophoresis - Digestive gland homogenates were prepared in 0.5% saline, placed in 0.25ml tubes and stored at -70 C until electrophoretic analysis was performed. The homogenates were collected with Whatman paper No. 3 and applied to the electrophoretic gel. Analysis was carried out by horizontal electrophoresis. Starch or acrylamide gels were employed according to the enzyme system analyzed using the technique adapted by Malavasi and Morgante (1982). At least 30 specimens per enzymatic locus were analyzed according to the criterion of Hames and Rickwood (1987). A locus was considered to be polymorphic when the fre- quency of the rarest allele was 1% or higher. The following enzyme systems were analyzed: alcohol dehydrogenase (ADH, Enzyme Comission number - E.C.I.I.I.I), B- hydroxybutyrate dehydrogenase (HBDH, E.C. 1.1.1.30), malate dehydrogenase (MDH, E.C. 1.1.1.37), glutamate-oxaloacetate trausaminase (asparlate aminotransferase) (GOT, E.C.2.6. 1.1), phosphoglucomutase (PGM, E.C.2.7.5.1), alpha-esterase (EST, EC.3.1.1.1), alkaline phcsphatase (APE E.C.3.1.3.1), leucine aminopeptidase (LAP, E.C.3.4.11.1) and glucose phosphate isomerase (PGI, E.C.5.2.1.9). Data analysis - The methodology described by Nei (1972) was used to calculate the level of similarity (S). The gene frequency values were analyzed by the unweighted pair-group centred clustering (UPGMC) method of Sneath and Sokal (1973). RESULTS Nine enzyme systems were analyzed for isozyme electrophoretic pattem and 14 enzymatic loci were observed and scored. In order to detect the amplitude of variation existing in the geographic region where the two species, B. tenago- phila and B. occidentalis, occur, the allelic variation observed in the 15 populations sampled was summarized (Table I). TABLE I Eletrophoretic analysis for nine enzymatic systems. Comparative painting between Biomphalaria tenagophila and B. occidentalis
--------------------------------------------------------------
Classification          Enzymatic systems         Allele
of loci                                           number
--------------------------------------------------------------
Polymorphic l^a:
MDH2                 Malate dehydrogenase                5
APH                  Alkaline phosphatase                4
EST3                 Esterase                            5
Polymorphic IIb:
HBDH                 B-Hydroxybutyrate dehydrogenase     3
ESTI                 Esterase                            5
EST4                 Esterase                            5
Monomorphic I^c:
EST2                 Esterase                            1
PGI                  Glucose phosphate iaomerase         1
GOTI                 Glutamate oxaloacetate transaminase 1
GOT2                 Glutamate oxaloacetate transaminase 1
MDHI                 Malate dehydrogenase                1
Monomorphic II^d:
ADH                  Alcohol dehydrogenase               2
LAP                  Leucine anminopeptidase             2
PGM                  Phosphoglucomutase                  2
------------------------------------------------------------
a. variation in populations. Same alleles between the species variation in populations. Distints alleles between the species c: same patterns in two species d: distincts patterns between the species TABLE II Allelic frequency in polymorphic loci in at least one of the species. Biomphalaria tenagophila (BT) and B. occidentalis (BO)
------------------------------------------------------------
Loci    Samples    N    Alleles            Allele frequency
------------------------------------------------------------
                                  1.50  1.20  1.00  0.90
APH      BT       366     3       .353  .028  .619   -
         BO       228     2         -     -   .977  .023
                                     1.20  1.00  0.75
HBDH    BT        366     2         -     .694    .306
        BO        228     1          1.00   -      -
                                  1.20  1.10  1.05 1.00  0.90
MDH2    BT        366     3         -   .005  .033 .962   -
        BO        228     3       .175    -     -  .152  .673
                                 -1.80 -1.20 -1.00-0.70 -0.40
EsTI    BT        366     2         -     -   .781 .219    -
        BO        228     3       .175  .482   -     -   .342
                                  1.20  1.00  0.90 0.85  0.80
EST3    BT        366     3       .004  .991  .005   -     -
        BO        228     3         -   .828    -  .018  .154
                                  1.10  1.05  1.00 0.95  0.90
EST4    BT        366     3         -   .645    -  .037  .321
        BO        228     2       .154    -   .846    -     -
-------------------------------------------------------------
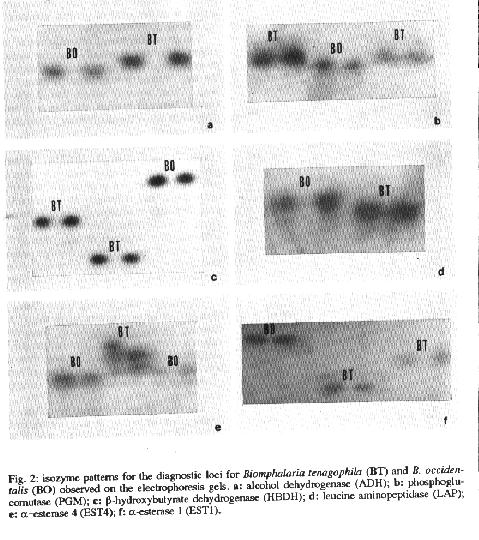
According to this analysis, 6 of the 14 loci studied were
polymorphic.For polymorphic loci the allelic frequency for each species is presented in Table II. The polymorphic loci APH, MDH2 and EST3 share common mobility patterns in the two species. However, the HBDH, ESTI and EST4 loci always showed distinct alleles between species. The results showed 6 diagnostic loci between species, 3 of them being polymorphic and 3 monomorphic (Table III; Fig. 2). At the locations investigated, B. occidentalis consisted of predominantly monomorphic populations, although the alleles might differ among populations (Table IV). The results obtained for B. tenagophila (intrapopulation variation) have been analyzed in a previous study (Mascara & Morgante 1991). An estimate of the level of genetic variability in the two species of Biomphalaria is presented in Table V. On the basis of these values, it was possible to calculate genetic similarity (S) between species, as well as among the populations of each species (Table VI). Among the B. tenagophila populations, S ranged from 0.714 (BAU-CAM and BAU-TAU) to 1.000 (CAM-TAU). The intrapopulation similarity of B. occidentalis ranged from 0.714 (SJP-PRU) to 0.999 (CAP-SAN and ASS-SCP). However, the highest S value between the two species was 0.514 (SOR-SAN and ARA-SAN).
Hennksen and Jelnes (1980), when justifying biochemical systematics, pointed out that the results of isozyme analysis are of great importance when employed to separate morphologically close or cryptic species. TABLE III Allelic frequencies of diagnostics loci for Biomphalaria tenagophila and B. occidentalis
-------------------------------------------------------------
Loci      Allelomorphs              B.           B.
                                    tenagophila
occidentalis
                                    N = 366      N = 228
-------------------------------------------------------------
ADH         1.20                    1.000          -
            1.00                      -          1.000
LAP         1.20                      -          1.000
            1.00                    1.000           -
PGM         1.10                    1.000           -
            1.00                      -          1.000

            1.20                      -          1.000
HBDH        1.00                      .694          -
            0.75                      .306          -

            1.80                      -           .175
            1.20                      -           .482
ESTI        1.00                      .781           -
            0.70                      .219           -
            0.40                      -           .342

            1.10                      -           .154
            1.05                      .642           -
EST4        1.00                      -           .846
            0.95                      .037           -
            0.90                      .321           -
-------------------------------------------------------------
In this study the isozyme technique permitted not only species characterization but also, and importantly, the identification of populations originating from different locations (Malek & File 1971, Narang et al. 1981, Jelnes 1982, Woodruff et al. 1985). The present study allowed the identification of species or genetic populations (Lewontin 1985) by the determining of the allelic divergence existing among populations. It is possible to estimate genetic divergence by the variation observed on the electrophoretic gel as long as a strategy of geographic sampling of natural populations is used (Bush & Kitto 1978, Buth 1984, Mascara & Morgante 1991). Furthermore, a com- parative analysis of the results obtained makes it possible to correlate the isozyme variation observed with the level of genetic similarity existing among populations (Nei 1972). However, the use of any taxonomic identification technique, especially isozyme variation, is of systematic value only when the variability of the trait studied is estimated in natural populations. Thus, we may affirm that in the area of contact between species, the loci reported to be diagnostic allow the distinction of populations of both species. Analysis of the level of species variability (Table V) based on results obtained for each sampie, presents a distortion resulting from the genetic structure of the populations. Biomphalaria tenagophila and especially B. occidentalis form predominantly monomorphic populations as the result of the founder effect in the colonization of breeding sites (Mascara & Morgante 1991). Table V shows the difference between mean heterozygosity (H) calculated from the variation at each locus and H obtained by the mean heterozy- gosity of each population. Populations with distinct fixed alleles have a high rate of heterozygosity when the H value is obtained by variation per locus, however, such value is unreal since the populations are monomorphic. Thus, the method for obtaining the real level of variability of planorbid species is the calculation of the mean variability for each population. The level of genetic similarity (Table III) obtained from the survey of isozyme variation was calculated among populations of both species. This method of analysis permitted us to individualize the two species populations (Fig. 3), which reinforces the relevance of the technique employed. Nonetheless, it did not allow a delimitation of geographic areas having a uniform gene (Geraerts & Joosse 1984) and planorbid snails may also present a reproductive behavior which allows cross-fertilization and even self'fertilization. TABLE IV Allele frequencies for the polymorphic loci among populations of Biomphalaria tenagophila and B. occidentalis
--------------------------------------------------------------
Biomphalaria tenagophila
--------------------------------------------------------------
Loci   Alleles   BAU    TAU    ITA    SOR    PTO    CAM   MAR
                 N=45   N=38   N=35   N=68   N=35   N=40  N=40
--------------------------------------------------------------
       1.50     1.00     -    1.00     -     0.22    -   1.00
APH    1.20      -       -     -      0.15    -      -     -
       1.00      -      1.00   -      0.85   0.78   1.00   -
       0.09      -       -     -       -      -      -     -

       1.20      -       -     -       -      -      -     -
HBDH   1.00      -      1.00  1.00    0.64   1.00   1.0  0.06

       0.75    1.00      -     -      0.36    -      -   0.94

       1.20      -       -     -       -      -      -     -
       1.10      -       -     -       -      -      -   0.05
MDH2   1.05      -       -    0.13    0.10    -      -     -
       1.00    1.00     1.00  0.87    0.90   1.00   1.00 0.95

       0.90      -       -     -       -      -      -     -

      -1.80      -       -     -       -      -      -     -
      -1.20      -       -     -       -      -      -     -
EST1  -1.00    1.00      -    1.00    0.97   1.00    -   1.00
      -0.70      -      1.00   -      0.03    -     1.00   -
      -0.40      -       -     -       -      -      -     -

       1.20      -       -     -      0.02    -      -     -
       1.00    0.96     1.00  1.00    0.98   1.00   1.00 1.00
EST3   0.90    0.04      -     -       -      -      -     -
       0.85      -       -     -       -      -      -     -
       0.80      -       -     -       -      -      -     -

       1.10      -       -     -       -      -      -     -
EST4   1.05      -      0.98  1.00    0.88   1.00   1.00   -
       1.00      -       -     -       -      -      -     -
       0.95      -      0.02   -      0.12    -      -     -
       0.90     1.00     -     -       -      -      -     -
------------------------------------------------------------
Biomphalaria tenagophila          Bionphalaria occidentalis
----------------------------------------------------------
--
Loci Alleles    BEB   ARA  CAP  SAN   SJP   ASS   PRU   SCP
               N=35  N=30  N=30 N=45  N=35  N=40  N=40  N=38
------------------------------------------------------------
      1.50     0.04   -     -    -     -     -     -     -
APH   1.20      -     -     -    -     -     -     -     -
      1.00     0.96  1.00  1.00 1.00  1.00  1.00  0.87  1.00
      0.90      -     -     -    -     -     -    0.13   -

      1.20      -     -    1.00 1.00  1.00  1.00  1.00  1.00
HBDH  1.00     1.00  0.84   -    -     -     -     -     -
      0.75      -    0.16   -    -     -     -     -     -

      1.20      -     -     -    -     -     -     1.00  -
      1.10      -     -     -    -     -     -     -     -
MDH2  1.05     0.02   -     -    -     -     -     -     -
      1.00     0.98  1.00   -   0.04  0.94   -     -     -
      0.90      -     -    1.00 0.96  0.06  1.00   -    1.00

     -1.80      -     -     -    -     -     -     1.00   -
     -1.20      -     -    1.00 1.00  1.00   -     -      -
EST1 -1.00     1.00  1.00   -    -     -     -     -      -
     -0.70      -     -     -    -     -     -     -      -
     -0.40      -     -     -    -     -     1.00  -     1.00

      1.20      -     -     -    -     -     -     -      -
      1.00     1.00  1.00  1.00 1.00   -     1.00  1.00  0.89
EST3  0.90      -     -     -    -     -     -     -      -
      0.85      -     -     -    -     -     -     -     0.11
      0.80      -     -     -    -     1.00  -     -      -

      1.10      -     -     -    -     -     -     -      -
      1.05     0.07  0.85   -    -     -     -     -      -
EST4  1.00      -     -    1.00 1.00   -     1.00  1.00  1.00
      0.95      -    0.15   -    -     -     -     -      -
      0.90     0.93   -     -    -     -     -     -      -
--------------------------------------------------------------
TABLE VSummary statistics of genetic variation among populations of Biomphalaria tenagophila (BT) and B. occidentaiis (BO)
------------------------------------------------------------
    Mean sample    Mean No.    Mean             Loci
    size per       of alleles  Heterozygosity   Polymorphic
    loci           per loci    expected         (%)
------------------------------------------------------------
BT  316.4+/-20.22  2.0+/-0.3   0.186+/-0.07a     42.8a
                               0.023+/-0.025b    13.5b

BO  234.6+/-3.4    1.6+/-0.3   0.120+/-0.07a     30.0a
                               0.007+/-0.005b    4.8b
-------------------------------------------------------------
a: this values have been estimated by genic frequencies for
loci in each species b: this values have been obtained by
heterozygosity mean for each populationThus, the recolonization of the breeding site may start from a single genome. The results obtained in the present study are related to the colonization process which is consistent with the dynamics of natural populations of the genus Biomphalaria. Maked fluctuations in density detected in natural populations (Paraense 1956, Selander & Kaufman 1973). The possibility of recolonizing the environment by self-fertilization of the remaining specimens explains the observation of different fixed alleles in close populations, as well as the existence of a random geographic distribution of gene sets. The variation in allele frequency among the populations analyzed (Table IV) may reflect the dispersal of strains by colonization of one or few individuals (Mascara & Morgante 1991). However, no selective effect was observed with respect to the enzymatic polymorphism detected. Thus, variation does not represent differences in the adaptative value of populations. This evidence indicates that, in the genus Biomphalaria, the geographic isolation of genetic strains and the consequent allopatric speciation of these populations may represent the most probable form of species differentiation. ACKNOWLEDGMENTS To Prof. Luiz Carlos Gomes Simones for kindly permitting access to the Mollusk Cytogenetics Laboratory, Institute of Biosciences, University of Sao Paulo. REFERENCES Bailey JB, Michelson EH, Paraense WL 1986. Differentiation of the sibling species Biomphalaria occidentalis and B. tenagophila by the electrophoretic patterns of their hemoglobin. Mere Inst OswaMo Cruz 81: 319-322. Bush GL, Kitto GB 1978. Application of genetics to insect systematics and analysis of species differences, p.89-118. In Biosystematics in Agriculture Vol.VI. J.A. Romherger, N. Jersey Buth DG 1984. The application of electrophoretic data in systematic studies. Ann Rev Ecol Syst 15: 501-522. Geraerts WPM, Joosse J 1984. Freshwater snails (Basommatophora) p.141-208. In The Mollusca - Reproduction Vol.VII. M Wilbur Academic Press, NY. Hames BD, Rickwood D 1987. Gel electrophoresis of proteins - a practical approach. IRL Press, Washington. Hennksen UB, Jelnes JE 1980. Experimental taxonomy of Biomphalaria (Gastropoda: Planorbidae). I. Methods for experimental taxonomic studies on Biomphalaria carried out by horizontal starch gel electrophoresis and staining of twelve enzymes. J Chromatog 188: 169-176. Jelnes JE 1982. Experimental taxonomy of Biomphalaria (Gastropoda: Pulmonata). II. Electrophoretic observations of eight enzyme systems of the South American species: Biomphalaria glabrata, B. stratainca and B. tenagophila. J Nat HisI 16: 209-217. Lewontin RC 1985. Populations genetics. Ann Rev Genet 19: 81-102. Malavasi A, Morgante JS 1982. Genetic variation in natural populations of Anastrepha (Diptera: Tepluitidae). Rev Brasil Genet 5: 263-278. Malek EA 1985. Snail hosts of schistosomiasis and other snail-transmitted diseases in Tropical America. A manual. PAHO/WHO Sci Publ. Malek EA, File SK 1971. Electrophoretic studies on the digestive gland esterases of some Biomphalarid and Lymnaeid snails. Bull WHO 45: 819-825. Mascara D, Morgante JS 1991. Enzyme polymorphism and Genetic structure of Biomphalaria tenagophila (Gastropoda, Planorbidae) populations: Founder effect. Rev Brasil Genet 14: 631-644. TABLE VI Genetic similarity (S) between Biomphalaria tenagophila and B. occidentalis from the State of Sao Paulo
------------------------------------------------------------
Populations                  Biomphalaria tenagophila
----------------------------------------------------------
--
                  BAU  TAU   ITA    SOR   PTO   CAM   MAR
------------------------------------------------------------
Bauru (BAU)        -
Taubate (TAU)    0.714  -
Itariri (ITA)    0.854 0.854 -
Sorocaba (SOR)   0.837 0.917 0.924 -
P.de Toledo (PTO)0.811 0.924 0.954 0.986 -
Campinas (CAM)   0.714 1.000 0.855 0.918 0.924 -
Marflia (MAR)    0.999 0.721 0.862 0.842 0.818 0.721 -
Bebedouro (BEB)  0.861 0.862 0.864 0.927 0.929 0.861 0.868
Aracratuba (ARA) 0.812 0.924 0.922 0.995 0.993 0.924 0.818
Campinas (CAP)   0.427 0.501 0.432 0.511 0.491 0.501 0.432
Sto. Anastacio
(SAN)            0.431 0.505 0.436 0.514 0.495 0.504 0.436
S.J.R.Preto (SJP)0.427 0.498 0.421 0.502 0.489 0.498 0.426
Assis (ASS)      0.427 0.501 0.432 0.511 0.491 0.501 0.432
P. Prudente (PRU)0.431 0.495 0.436 0.506 0.487 0.495 0.435
S.C.R. Pardo(SCP)0.422 0.496 0.427 0.506 0.486 0.496 0.427
------------------------------------------------------------
Populations       Biomphalaria          Biomphalaria

                  tenagophila           occidentalis
                 -------------   ----------------------------
                 BEB     ARA     CAP SAN  SJP  ASS   PRU SCP
-------------------------------------------------------------
BAU
TAU
ITA
SOR
PTO
CAM
MAR
BEB            -
ARA          0.939      -
CAP          0.502    0.511     -
SAN          0.506    0.514    0.999  -
SJP          0.498    0.507    0.793  0.798 -
ASS          0.502    0.511    0.929  0.928 0.722 -
PRU          0.497    0.504    0.855  0.857 0.714 0.855
SCP          0.497    0.505    0.927  0.927 0.727 0.999 0.853
-------------------------------------------------------------
Narang N, Narang S, Monteiro W, Almeida Jr JMG 1981. Genetic
differentiation between populations of Biomphalaria
glabrata (Mollusca: Pulmonata) located in the State of
Bahia and in the State of Minas Gemis (Brazil). Rev Brasil
Genet 3: 269-279.Nei M 1972. Genetic distance between populations. Am Nat 106: 283-292. Paraense WL 1956. A genetic approach to the systematics of Planoeoid molluscs. Evolution 10: 403-407. Paraense WL 1981. Biomphalaria occidentalis sp. N. from south America (Mollusca Basoramatophom Pulmonata). Mem Inst Oswaldo Cruz 76:199-211. Paraense WL, Corma LR 1982. Unsnsceptibility of Biomphalaria occidentalis to infection with a strain of Schistosoma mansoni. Mem Inst Oswaldo Cruz 77: 55- 58. Selander R-K, Kaufman DW 1973. Genie variability and strategies of adaptation in animals. Proc Nat Acad Sci 70: 1875-1877. Sneath PH, Sokal R 1973. Numerical taxonomy. Freeman Co., San Francisco. Teles HMS 1988. Aspectos ecologicos de Biomphalaria Preston 1910 (Basommatophora, Planorbidae) no Eatado de Sao Paulo, Brasil. I. Sintopia. Ci e Cult 40: 374-379. Teles HMS 1989. Distribuicao de Biomphalaria tenagophila e B. occidentalis no Estado de Sao Paulo (Brasil). Rev Saude Publica S Paulo 23: 244253. Woodroll DS, Mulvey M, Yipp MW 1985. Population genetics of Biomphalaria straminea in Hong Kong. J Heredity 76: 355-360.
Copyright 1995 Fundacao Oswaldo Cruz
The following images related to this document are available:Halftone images[oc95072b.gif]Photo images[oc95072b.jpg]Line drawing images[oc95072c.gif] [oc95072a.gif] |
| |||||||||