 |
| About Bioline | All Journals | Testimonials | Membership | News |
|
||||||
|
||||||
A Possible Correlation between the Host Genetic Background in the Epidemiology of Hepatitis B Virus in the Amazon Region of Brazil AKCR Santos, MOG Ishak, SEB Santos, JF Guerreiro, R Ishak* Laboratorios de Virologia e de Genetica Humana, Universidade Federal do Para, Caixa Postal 13005, 66040-970 Belem, PA, Brasil
The Amazon region of Brazil is an area of great interest because of the large distribution of hepatitis B virus in specific Western areas. Seven urban communities and 24 Indian groups were visited in a total of 4,244 persons. Each individual was interviewed in order to obtain demographic and familial information. Whole blood was collected for serology and genetic determinations. Eleven genetic markers and three HBV markers were tested. Among the most relevant results it was possible to show that (i) there was a large variation of previous exposure to HBV in both urban and non-urban groups ranging from 0 to 59.2%; (ii) there was a different pattern of epidemiological distribution of HBV that was present even among a same linguistic Indian group, with mixed patterns of correlation between HBsAg and anti-HBs and (iii) the prevalence of HBV markers (HBsAg and anti-HBs) were significantly higher (P=0.0001) among the Indian population (18.8%) than the urban groups (12.5%). It is possible that the host genetic background could influence and modulate the replication of the virus in order to generate HB carrier state. Key words: hepatitis B virus - seroepidemiology - Amazon region - genetic correlation
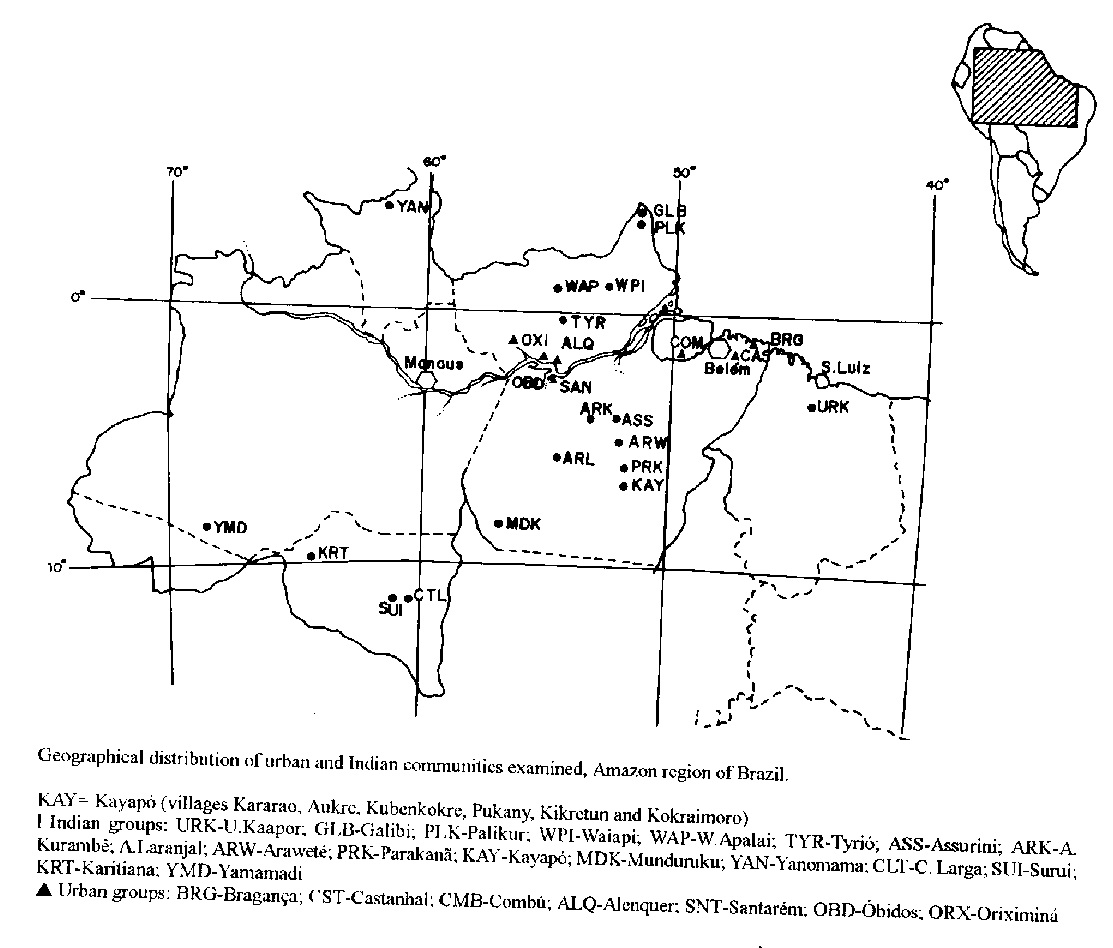
The epidemiology of hepatitis B virus (HBV) is well defined in several geographical areas of the world (Cokburn 1981, Deinhardt & Deinhardt 1983, Zuckerman 1984, 1987, Bensabath et al.. 1986, Black et al.. 1986). The modes of transmission are clear and similar in both developed and developing countries. Some of the tropical areas however, harbor a higher prevalence of HBV. As a consequence, there is also a higher rate of active carriers among the apparently healthy population of such endemic areas. The West of the Amazon region of Brazil has been long shown to be a highly endemic area for HBV (Bensabath et al.. 1986, Fonseca et al.. 1988), but information is still fragmentary and incomplete to define the descriptive epidemiology of the virus in the region as a whole. The present work aimed to describe the general prevalence of HBV dissemination and the rate of HB carrier among native Indians and urban populations of the Amazon. Furthermore, the existence of a genetic profile of those populations, was used to attempt to correlate the influence of genetic markers and persistence of HBV. MATERIALS AND METHODS Populations examined - Blood samples were collected during the period of 1983 to 1991 from 4,244 individuals residing in seven urban communities in the State of Para (Santarem, Castanhal, Oriximina, Obidos, Alenquer, Braganca, and Combu) and 24 Indian communities residing in the States of Maranhão (Urubu-Kaapor), Amapa (Galibi, Palikur, Waiapi), Para (Wayana-Apalai, Tyriyo, Assurini do Kuatinemo, Assurini do Trocara, Arara do Laranjal, Arara do Kurambe, Arawete, Parakana, Kararao, Aukre, Kubenkokre, Pukany, Kikretun, Kokraimoro, Munduruku), Roraima (Yanomami), Amazonas (Yamamadi), and Rondonia (Cinta Larga, Surui, Karitiana). Their geographical distribution can be seen in Fig. The samples tested represented more than 50% of the Indian population groups examined and approximately 2% to 3% of the urban communities. Serum or plasma were separated and frozen at -20 C. Hepatitis B markers - HBsAg, anti-HBs (Biomanguinhos, FIOCRUZ) and anti-HBc IgM (Institute Pasteur) were detected through enzyme immunoassays commercially available.
Statistical methods - The association between genetic and epidemiologic markers was attempted using the Woolf (1955) method through a computer program prepared by H Krieger and P Cabello. Genetic variability was measured through the program BIOSYS (DL Sowfford and P Selander) taking into consideration the measurement of average heterozygozity (H), the proportion of polimorphic loci (P) and the mean number of alleles per locus (N). Eleven genetic markers (ABO, RH, haptoglobin, ceruloplasmin, transferrin, albumin, butiryl cholinesterase-locus 1, cholinesterase-locus 2, hemoglobin, esterase D and acid phosphatase) were analyzed. The comparison of the values of average heterozygosity between the two population groups used the Mann-Whitney test through the SPSS program. RESULTS Fifty percent of the individuals investigated from urban areas (2,022) were males and their age range varied from 9 to 60 years old. The Indian community (2,222 individuals) was represented by 49% of males and ages varied from 1 to 80 years old. None of the subjects examined was submitted to previous vaccination against hepatitis B virus. Tables I and II show the prevalence rates of anti-HBs, and HBsAg in urban and Indian communities, respectively. HBV was absent in two Indian groups (Arara do Laranjal and Parakana) but varied its prevalence from 3.4% (Arawete) to 59.2% (Assurini do Kuatinemo). All of the HBsAg positive subjects were tested for the presence of anti-HBc IgM in order to diferentiate acute infected from hepatitis B carriers. Four were positive, indicating a recent infection close to the time of blood collection. The comparison of prevalence rates of anti-HBs and HBsAg between urban and Indian populations is shown in Table III. There was an statistically significant difference of these HBV markers prevalence (12.5% vs.18.8%, p=0, respectively) when considering the two population groups examined. The comparison of the prevalence rates of HBV markers (HBsAg and anti-HBs) within the urban communities, showed that the population groups located at the mouth of the Amazon river (Bragança, Castanhal and Combu) presented significantly lower rates (9.9% vs. 14.6%, p=0.0016) than those found in the West (Alenquer, Oriximina and Obidos) as seen in Table IV. The estimates related to the genetic variability of the two population groups are listed in Tables V and VI. Among the urban communities the average heterozygozity varied from 0.171 (Braganca) to 0.203 (Castanhal) in comparison to the range of 0.082 (Yamamadi) to 0.146 (Karitiana) among the Indians. The comparison of the two population groups were significantly different (Mann-Whitney: U=0, Z(U)=-3.3187, p<0.0009). The proportion of polimorphic loci ranged from 82% to 100% and 27% to 54% among urban and Indian groups respectively. DISCUSSION The prevalence of HBV markers in the Amazon region of Brazil are generally higher than in the rest of the country, but also variable according to factors that include the community examined, the social economic status and the geographical isolation of the group (Gayotto et al.. 1981, Alecrim et al.. 1984, Carrilho & Silva 1986, Bensabath et al.. 1986, 1987, Santos et al.. 1991). The rates observed in the urban communities examined were not different to what is generally seen, and increased significantly (p=0.0016) in those communities located to the west of the Amazon river. The southwest of the Amazon region is particularly interesting especially to what concerns the HB carrier state. The prevalence of HBsAg in Northern states is not higher than 7%, while in groups residing in the States of Amazonas, Acre and Rondonia, it reaches 19% (Gayotto et al.. 1981, 1984, Bensabath et al.. 1986, Santos et al.. 1991). The Indian groups examined showed prevalence rates that were also not different from the scaterred results described so far (Black et al.. 1974, Gayotto et al.. 1981, 1984, Ferraroni & Lacaz 1982, Alecrim et al.. 1984, Carrilho & Silva 1986, Bensabath et al.. 1986, 1987, Santos et al.. 1991). The absence of markers for the virus in the Parakana and the Arara do Laranjal may reflect the time of the blood collection (1983 and 1985, respectively). Recently, HBV has been described in the Parakana (HBsAg=10%) by Vieira-Filho et al.. (1990). The Parakana represents a recent evidence of introduction of pathogens into isolated communities including sexually transmitted ones (Ishak et al.. 1993). It seems that when HBV reaches an Indian community it tends to disseminate more among its members and to persist in higher levels than what is seen in general urban communities. The prevalence rates of anti-HBs and HBsAg were significantly different between the two groups. Endemicity of HBV based on the prevalence of markers is generally classified as low (HBsAg, <2%; total markers, <30%), intermediate (HBsAg, 2%-5%, total markers, 30%-50%) and high (HBsAg, 5%-20%, total markers, 50%-90%). Nine Indian communities did not show a sharp correlation between the rates of anti-HBs and HBsAg, as they are regularly categorized by the WHO (Zuckerman 1984). Three additional categories were seen in that (i) previous exposure to the virus (prevalence of anti-HBsAg) could be low, but carrier prevalence (HBsAg) was intermediate like in the Tiryo (6.4% / 3.2%), Assurini do Trocara (5.1% / 3.1%), and Kikretun (0 /5.6%); (ii) exposure was intermediate, but virus was maintained in low carriage levels like in the Munduruku (22% / 0.6%), and Yamamadi (17.9% / 0); and (iii) exposure was medium, but virus was kept in high levels of persistence like in the Wayana-Apalai (26.3% / 14.2%), Yanomami (12.3% / 7.5%), and Surui (24.2% / 11.3%). There was no link whatsoever among the eight groups involved. They were not geographically close (indeed, there were two or more pattern in the same areas), there were no association to the linguistic tree or to the time they have already been approached. Apart from the possibility of the occurrence of different subtypes of HBV, there is the fact that Indian groups in the Amazon region of Brazil result from an interaction of factors that include movements of fusion and separation between tribes or villages, contacts with other tribes, and wedding patterns that could confer them different levels of susceptibility towards an infection with HBV. The genetic similarity among the Kayapo Indians has been already described (Salzano 1971, Salzano et al.. 1972), however these Indians showed three different patterns of interaction with the virus: (i) low endemicity - Kararao and Aukre; (ii) intermediate endemicity - Kubenkokre, Pukany, Kokraimoro, and (iii) mixed (low/medium) - Kikretun. It is possible that one (or more) genetic factor is influencing and modulating the way the virus interacts with the host during its replication. This is seen with other viruses like Saint Louis encephalitis virus; when the cell substrate is changed, the biology of in vitro persistence is also changed (Randolph & Hardy 1988). TABLE I Prevalence (%) of HBV markers (HBsAg and anti-HBs) among urban communities of the Amazon region of Brazil
------------------------------------------------------------
Population  No. examined    anti-HBs     HBsAg       Total
                          ----------- -----------     (%)
                          No.     %   No.     %
------------------------------------------------------------
Braganna       256        17     6.7   0      0       6.7
Castanhal      481        54     11.2  2      0.4     11.8
Combu          132        13     9.8   0      0       9.8
Alenquer       223        29     13.0  3      1.3     14.3
Santarem       500        67     13.4  8      1.6     15.2
Obidos         232        31     12.8  1      0.4     13.2
Oriximina      188        26     13.8  4      2.1     15.9
------------------------------------------------------------
Total          2022       237    11.7  18     0.9     12.6
------------------------------------------------------------

TABLE II

Prevalence (%) of HBV markers (FIBsAg and anti-HBs) among
Indian communities of the Amazon region of Brazil

------------------------------------------------------------
Population  No. examined    anti-HBs     HBsAg       Total
                          ----------- -----------     (%)
                          No.     %   No.     %
------------------------------------------------------------
Urubu-Kaapor      204     13     6.4    3     1.5     7.9
Galibi            167     42     25.1   3     1.8     26.9
Palikur I         070     20     28.6   0     0       28.6
Palikur II^a      050     11     22.0   3     6.0     28.0
Waiapi            090     4      4.4    0     0       4.4
Wayana-Apalai     190     50     26.3   27    14.2    40.5
Tyriyo            031     2      6.4    1     3.2     9.7
Assurini do
Kuatinemo         049     26     53.1   3     6.1     59.2
Assurini do
Trocara           098     5      5.1    3     3.1     8.2
Arara do Laranjal 052     0      0      0     0       0
Arara do Kurambe  017     1      5.9    0     0       5.9
Arawete           116     3      2.6    1     0.9     3.4
Parakana          101     0      0      0     0       0
Kararao           032     3      9.4    0     0       9.4
Aukre             016     1      6.2    0     0       6.2
Kubenkokre I      078     13     16.7   0     0       16.7
Kubenkokre II^a   117     38     32.5   2     1.7     34.2
Pukany            053     12     22.6   1     1.9     24.5
Kikretun          018     0      0      1     5.6     5.6
Kokraimoro        102     25     24.5   2     2.0     26.5
Munduruku         168     37     22.0   1     0.6     22.6
Yanomama          106     13     12.3   8     7.5     19.8
Cinta Larga       098     6      6.1    1     1.0     7.1
Surui             062     15     24.2   7     11.3    35.5
Karitiana         098     5      5.1    0     0       5.1
Yamamadi          039     7      17.9   0     0       17.9
------------------------------------------------------------
Total             2222    352    15.8   67    3.0     18.8
------------------------------------------------------------
^a: sequential visit to the same group with a minimun of two
years between visitsTABLE III Comparison of the prevalence (%) of HBV markers (HBsAg and anti-HBs) between urban and Indian communities of the Amazon region of Brazil
-------------------------------------------------------------
Population      anti-HBs       HB sAg        anti-HBs+HBsAg
                No.    %      No.    %        No.     %
-------------------------------------------------------------
Urban           237   11.7    16    0.8      253    12.5
Indian          352   15.8    65    2.9      417    18.8
X^2               15.04         25.75           31.15
P=                0.00010         0
-------------------------------------------------------------
TABLE IVComparison of the prevalence (%) of HBV markers (HBsAg and anti-HBs) between urban populations of the Amazon region of Brazil, Eastern and Western of the Amazon river
-------------------------------------------------------------
Population      anti-HBs       HB sAg        anti-HBs+HBsAg
                No.    %      No.    %        No.     %
-------------------------------------------------------------
Eastern         84     9.7    1     0.1       86      9.9
Western         153    13.3   15    1.3       169     14.6
X^2                6.22         7.43^a           9.95
P=                 0.0126       0.0064           0.0016
--------------------------------------------------------------
^a:Yates correctedTABLE V Average heterozigosity among urban communities of the Amazon region of Brazil
-------------------------------------------------------------
Locus^a Braganca Castanhal Alenquer Santarem Obidos Oriximina
-------------------------------------------------------------
ABO     0.375    0.372     0.331    0.388    0.320   0.366
RH      0.354    0.366     0.368    0.357    0.374   0.443
HP      0.494    0.510     0.501    0.510    0.501   0.512
CP      0.040    0.096     0.058    0.078    0.021   0.041
TF      0.021    0.054     0.013    0.017    0.057   0.041
ALB     0.013    0.006     0.000    0.004    0.000   0.021
BCHE    0.060    0.040     0.021    0.020    0.021   0.040
CHE2    0.040    0.130     0.079    0.163    0.078   0.094
lIB     0.028    0.039     0.000    0.078    0.000   0.020
ESD     0.297    0.320     0.395    0.320    0.421   0.253
ACP     0.156    0.295     0.229    0.179    0.227   0.350
-------------------------------------------------------------
H^b     0.171    0.203     0.183    0.192    0.184    0.198
       (0.053)  (0.052)   (0.057)  (0.053)  (0.057)  (0.057)
N       2.360    2.450     2.090    2.450    1.910    2.360
P       90.91    90.91     81.82    81.82    81.82    100.00
--------------------------------------------------------------
^a ABO, RH, HP (Haptoglobin), CP (Ceruloplasmin),
cholinesterase-locus 1), CHE2 (Cholinesterase - locus TF
(Transferfin), ALB (Albumin), BCHE (Butifil phosphatase)
2), HB (Hemoglobin), ESD (lEsterase D), ACP (Acid 6: H
(Average Heterozigosity), N (Mean Number of Alleles per
Locus), p (Percentage of Polimorphic Loci)TABLE VI Average heterozygosity among Indian communities of the Amazon region of Brazil
------------------------------------------------------------
Locus^a    URK^b    WAP    ASK    AST    ARW    PRK    YMD
-------------------------------------------------------------
ABO        0.020   0.000  0.000  0.019  0.000  0.000   0.000
RH         0.000   0.000  0.000  0.000  0.000  0.212   0.000
HP         0.395   0.404  0.502  0.431  0.404  0.500   0.505
CP         0.039   0.094  0.225  0.492  0.000  0.000   0.000
TF         0.000   0.000  0.000  0.018  0.000  0.000   0.000
ALB        0.000   0.000  0.000  0.000  0.000  0.000   0.000
BCHE       0.000   0.000  0.000  0.000  0.000  0.000   0.000
CHE2       0.242   0.075  0.000  0.000  0.198  0.040   0.000
HB         0.000   0.000  0.000  0.000  0.000  0.000   0.000
ESD        0.112   0.404  0.503  0.474  0.375  0.444   0.344
ACP        0.211   0.307  0.345  0.144  0.039  0.226   0.053
-------------------------------------------------------------
H^c        0.093   0.117  0.143  0.144  0.091  0.129   0.082
          (0.040) (0.051)(0.064)(0.064)(0.047)(0.057) (0.052)
N          1.550   1.450  1.360  1.550  1.360  1.450   1.270
P          54.55   45.45  36.36  36.36  36.36  45.45   27.27
---------------------------------------------------
Locus^a        KAY       CTL      SUI       KRT
---------------------------------------------------
ABO           0.020     0.020     0.000    0.000
RH            0.000     0.000     0.000    0.000
HP            0.503     0.477     0.503    0.464
CP            0.062     0.183     0.191    0.035
TF            0.000     0.000     0.000    0.000
ALB           0.000     0.000     0.000    0.000
BCHE          0.000     0.000     0.000    0.000
CHE2          0.173     0.177     0.116    0.421
HB            0.000     0.000     0.000    0.000
ESD           0.000     0.492     0.369    0.503
ACP           0.246     0.233     0.141    0.183
---------------------------------------------------
H^c           0.089     0.144     0.120    0.146
             (0.049)   (0.057)   (0.05    (0.146)
N             1.360     1.550     1.550    1.450
P             36.36     54.55     45.45    45.45
---------------------------------------------------
^a: ABO, RH. HP (Haptoglobin), CP (Ceruloplasmin), TF
(Transferfin), ALB (Albumin), BCHE (Butifil
cholinesterase-locus 1), CHE2 (Cholinesterase-locus 2), FIB
(Hemoglobin), ESD (Esterase D), ACP (Acid Phosphatase)^b: URK (Urubu-Kaapor), WAP (Wayana-Apalai), ASK (Assurini do Kuatinemo), AST (Assmini do Trocarii), ARW (Arawete), PRK (Parakana), KAY (Kaiap6), CTL (Cinta Larga), SUI (Surui), KRT (Kantiana), YMW (Yamaraadi) ^c: H (Average Heterozygosity), N (Mean Number of Alleles per Locus), P (Percentage of Polimorphic Loci) The correlation of susceptibility to infection and maintenance of the virus in the host has been suggested and pointed to some genetic markers (Hillis et al.. 1977, Penner at al. 1977, Mazzilli et al.. 1977, Mota et al.. 1977, Sanchez et al.. 1983, Xu & Ng 1983, Padma & Velli 1988, Kishimoto et al.. 1990). The communities listed in the present work have been extensively studied with the aim to establish a genetic profile regarding 33 alleles (Black et al.. 1988, Salzano et al.. 1988, 1991, Guerreiro & Chataur - Freire - Maia 1988, Santos 1993). It was not possible to demonstrate any consistent association pointing a specific allele and the presence of HBsAg. Indian groups have been clearly shown to have a low level of genetic variability when considering their profile of conventional genetic markers (Salzano & Calegari-Jaques 1988) and, indeed, it has been suggested that it might be the reason for their susceptibility to infectious diseases in general (Black 1992). The comparison of the proportion of polimorphic loci (P) between the urban groups (82% to 100%) and Indians (27% to 54%) demonstrated a clear difference in their genetic variability. The host cell has an important influence in the regulation of virus replication and it is apparently different in the two population groups involved. It is possible that the higher levels of HB carriers among the native Indians of the Amazon, as well as the differences observed in the epidemiology, the dissemination and patterns of maintenance of the virus could be related to the limited genetic component of the host. REFERENCES Alecrim WD, Marreiros L, Alecrim MGC, Santos IFKM 1984. Inquerito sobre a presenca de HBsAg em habitantes de Labrea-Amazonas, p.118. Anais do XX Congresso da Sociedade Brasileira de Medicina Tropical, Salvador, Brasil. Bensabath G, Hadler SC, Soares MC, Fields H, Dias LB, Popper H, Maynard JE 1987. Hepatitis Delta virus infection and Labrea hepatitis: prevalence and role in fulminating hepatitis in the Amazon basin. JAMA 258: 479-483. Bensabath G, Soares MCP, Maia MMS 1986. Hepatites por virus, p. 483-529. In AC Linhares Instituto Evandro Chagas, 50 anos. Fundacao Nacional de Saude, Belem. Black FL 1992. Why did they die? Science 258: 1739-1740. Black FL, Hierholzer WJ, Pinheiro FP, Evans AS, Woodal JP, Opton EM, Emmons JE, West BS, Edsall G, Downs WG, Wallace GP 1974. Evidence for persistence of infectious agents in isolate human populations. Am J Epidemiol 100: 230-250. Black FL, Pandey JP, Capper RA 1986. Hepatitis B epidemiology and its relation to immunogenetic traits in South American Indians. Am J Epidemiol 123: 336-343. Black FL, Santos SEB, Salzano FM, Callegari-Jacques SM, Weimer TA, Franco MHL, Hutz MH, Rieger TT, Kubo RR, Mestriner MA, Pandey J 1988. Genetic variation within the Tupi linguistic group: new data on three Amazonian tribes. Ann Human Biol 15: 337-351. Carrilho FJ, Silva LC 1986. Epidemiologia, p.39-57. In LC Silva, Hepatites agudas e crônicas. Savier, São Paulo. Cockburn WC 1981. The epidemiology of hepatitis B in Europe, p. 5-16. In S Krugman, S Sherlock (eds) Proceedings of the European Symposium on Hepatitis B. Merck Sharp and Dohme International, New Jersey. Deinhardt F, Deinhardt J 1983. Viral Hepatitis: Laboratory and Clinical Science. Marcel Dekker, New York. Ferraroni JJ, Lacaz CS 1982. Prevalencia de anticorpos dos agentes causadores de hepatites, sifilis e toxoplasmose em cinco populacoes humanas distintas da Amazonia Brasileira. Rev Inst Med Trop Sao Paulo 24: 155-161. Fonseca JCF, Simoneti SRR, Schatzmayr HG, Castejon MJ, Cesario ALO, Simoneti JP 1988. Prevalence of infection with hepatitis Delta virus (HDV) among carriers of hepatitis B surface antigen in Amazon State, Brazil. Trans R Soc Trop Med Hyg 82: 469-471. Gayotto LCC, Quarentei AA, Cabral GL 1981. Soro epidemiologia das hepatites A e B nas areas dos rios Bia e Alto Jurua (Amazonas), p. 51. Anais do VII Congresso Brasileiro de Hepatologia. Porto Alegre, Brasil. Gayotto LCC, Quarentei AA, Cabral GL 1984. Soro epidemiologia das hepatites A e B nas regiões dos rios Bia e Alto Jurua, Amazonia Ocidental. GED 3: 106-112. Guerreiro JF, Chataurd-Freire-Maia EA 1988. ABO and Rh blood groups, migration and estimates of racial admixture for the population of Belem, State of Para, Brazil. Rev Bras Gen 11: 171-186. Hillis WD, Hillis A, Blas WB 1977. Association of hepatitis B surface antigenemia with HLA locus B specificities. New England J Med 296: 1310-1314. Ishak MOG, Ishak R, Cruz AC, Santos DEM, Salgado U 1993. Chlamydial infections in the Amazon region of Brazil. Trans R Soc Trop Med Hyg 86: 60-62. Kishimoto Y, Yamada S, Hirayama C 1990. An association between alfa 1-antitrypsin phenotype and chronic liver disease. Human Genetics 84: 132-136. Mazzilli MC, Trabace S, Raimond FD, Visco G, Gandini E 1977. HLA and chronic active hepatitis. Digestion 15: 278-285. Mota AH, Fainboin H, Terg R, Fainboin L 1977. Association of chronic active hepatitis and HLA B 35 in patients with hepatitis B virus. Tissue Antigens 30: 238-240. Padma T, Velli VV 1988. ABO blood groups, intestinal alkaline phosphatase and haptoglobin types in patients with serum hepatitis. Human Heredity 38: 367-371. Penner E, Grabner G, Dittrich H, Mayr WR 1977. HLA antigens in HBsAg antigen positive chronic active hepatitis. Tissue Antigens 10: 63-66. Randolph VB, Hardy JL 1988. Establishment and characterization of St. Louis encephalitis virus persistent infection in Aedes and Culex mosquito cell lines. J Gen Virol 69: 2189-2198. Salzano FM 1971. Demographic and genetic interrelationships among the Cayapo indians of Brazil. Social Biology 18: 148-157. Salzano FM, Black FL, Callegari-Jacques SM, Santos SEB, Weimer TA, Mestriner MA, Pandey J, Hutz MH, Rieger TT 1988. Genetic variation within a linguistic group: Apalai-Wayana and other Carib tribes. Am J Physical Antropol 75: 347-356. Salzano FM, Black FL, Callegari-Jacques SM, Santos SEB, Weimer TA, Mestriner MA, Kubo RR, Pandey J, Hutz MH 1991. Blood genetic systems in four Amazonian tribes. Am J Physical Antropol 85: 51-60. Salzano FM, Callegari-Jacques SM 1988. South American Indians. A Case Study in Evolution. Clarendon Press. Oxford, p. 138-162. Salzano FM, Neel J, Weitkamp LR, Woodall J 1972. Serum proteins, hemoglobins and erythrocyte enzymes of Brazilian Cayapo indians. Human Biology 44: 443-458. Sanchez EF, Ruiz VC, Berges CL, Fermoso J 1983. Niveles de alpha 1-antitrypsina en suero de pacientes neoplasicos. Medicina Clinica 81: 752-754. Santos AKCR 1993. A influencia de marcadores geneticos na epidemiologia do virus da hepatite B, Thesis. Universidade Federal do Para, 102 pp. Santos AKCR, Silva KC, Domingues RJ, Santos DEM, Ishak R 1991. Hepatitis B virus prevalence among native populations of the Amazon region of Brazil, p. 21. Virologica 91. Belem, Brasil. Vieira-Filho JB, Cruz CFN, Kemp L, Santos OM, Guimaraes RX 1990. Prevalencia dos marcadores sorologicos do HBV em indigenas do Sudeste do Para (PA). GED 9: 35-36. Xu YK, Ng WG 1983. Polymorphism of erythrocyte galactose-11-phosphate uridyltransferase among Chinese. Human Genetics 63: 280-282. Woolf B 1955. On estimating the relation between blood gro-ups and disease. Ann Human Genetics 19: 251-253. Zuckerman AJ 1984. Biology and epidemiology of hepatitis B virus, p. 43-65. In PWJ Rigby, NM Wilkie (eds). Symposium of the Society for General Microbiology: Viruses and Cancer. Cambridge University Press. Zuckerman AJ 1987. Hepatitis viruses, p. 135-157. In AJ Zuckerman, JE Banatvala, JR Pattison (eds). Principles and Practice of Clinical Virology. John Wiley and Sons, New York.
Copyright 1995 Fundacao Oswaldo Cruz
The following images related to this document are available:Line drawing images[oc95086a.gif] |
| |||||||||
