 |
| About Bioline | All Journals | Testimonials | Membership | News |
|
||||||
|
||||||
Received 5 July 1995. Accepted 11 March 1996
Involvement of Regional Lymph Nodes after Penetration of Schistosoma mansoni Cercariae in Naive and Infected Mice
Silene P Lozzi^+, Conceic o RS Machado^++, Silvia E Gerken*, Tomas A Mota-Santos**
Departamentos de Morfologia *Parasitologia **Bioquimica and
Imunologia, Instituto de Ciencias Biologicas, Universidade
Federal de Minas Gerais, 31270-901 Belo Horizonte, MG,
Brasil
Code Number: OC96094
Size of Files:
    Text: 31K
    Graphics: photographs (jpg) - 985.5K
[TABLES AND FIGURES AT END OF TEXT]
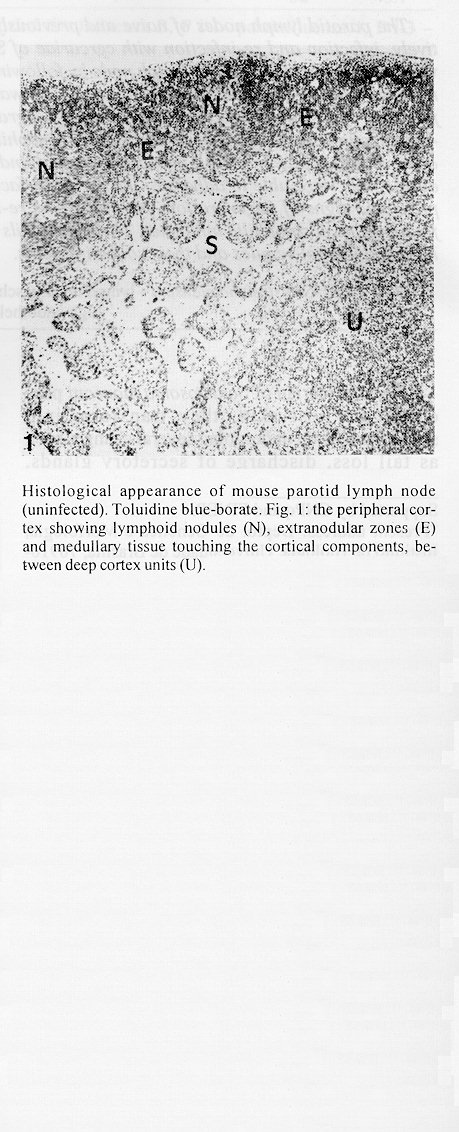
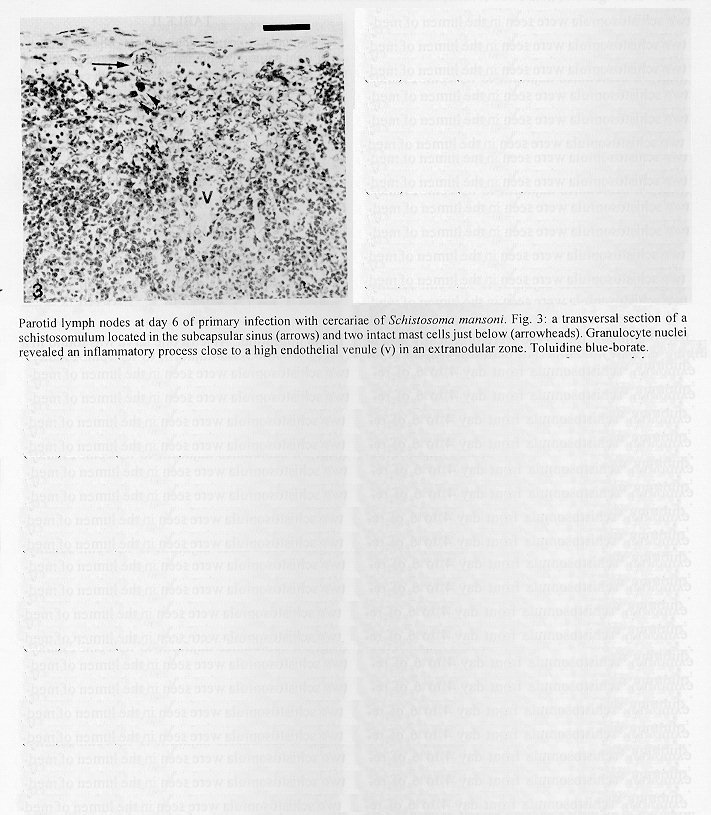
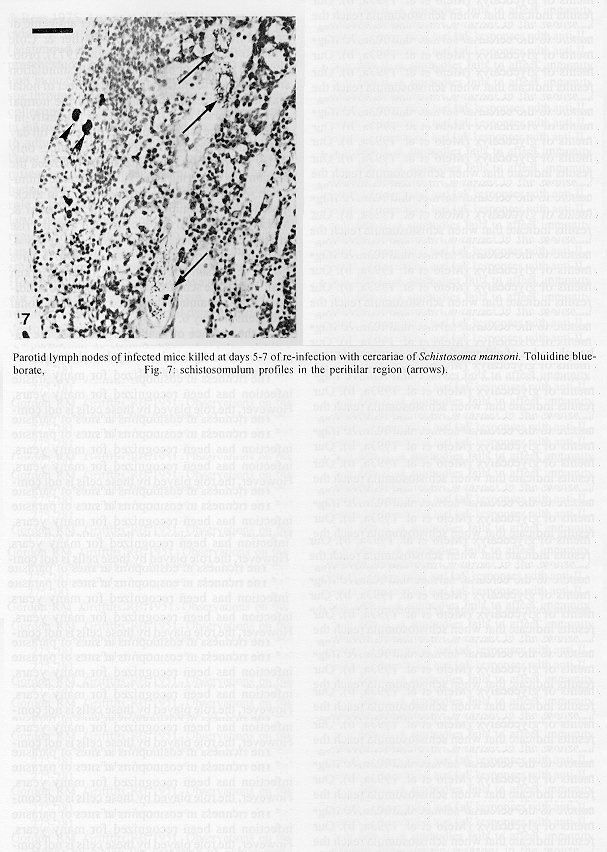
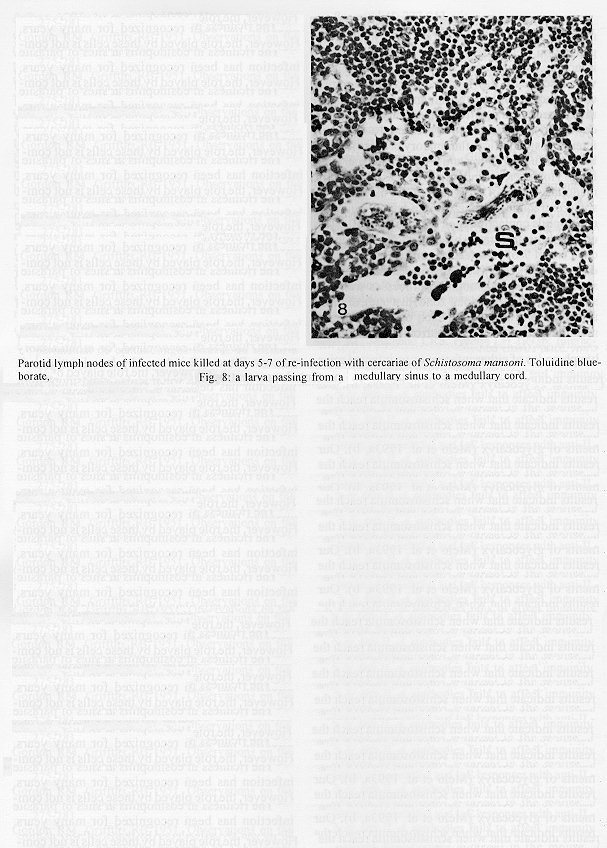
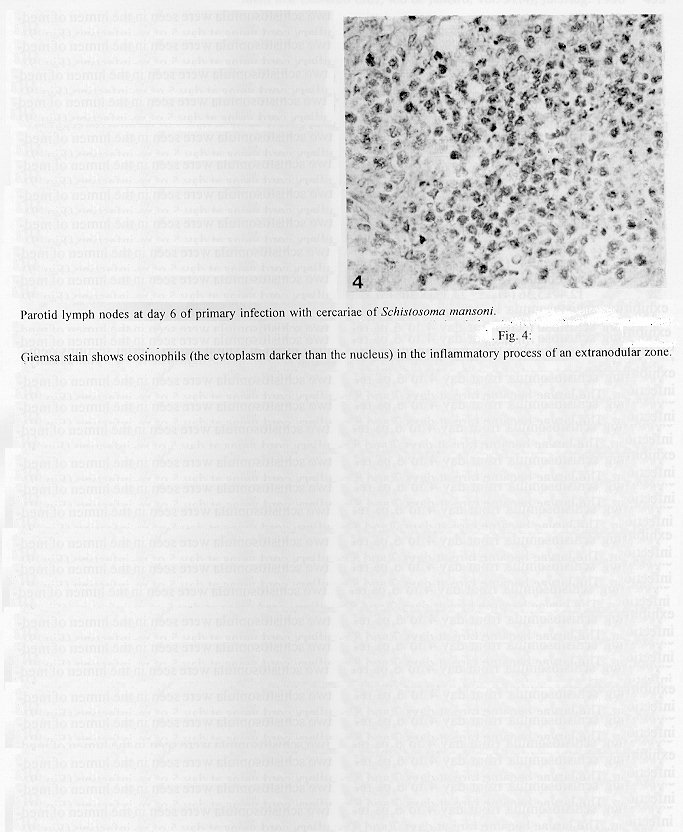
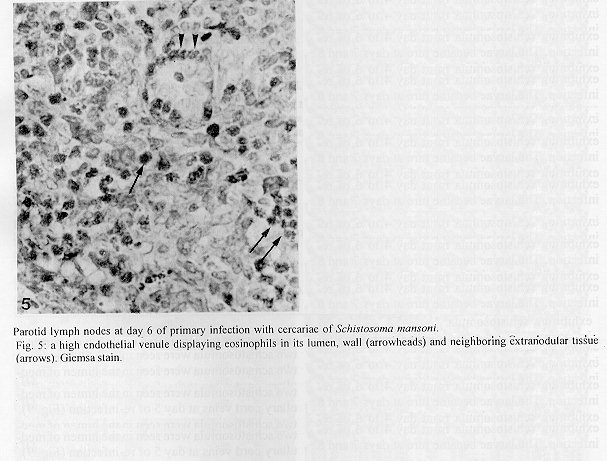
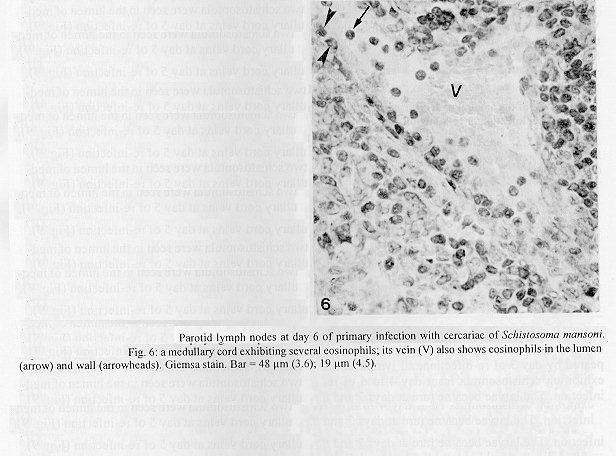
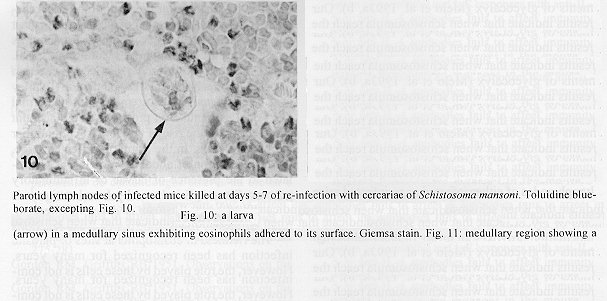
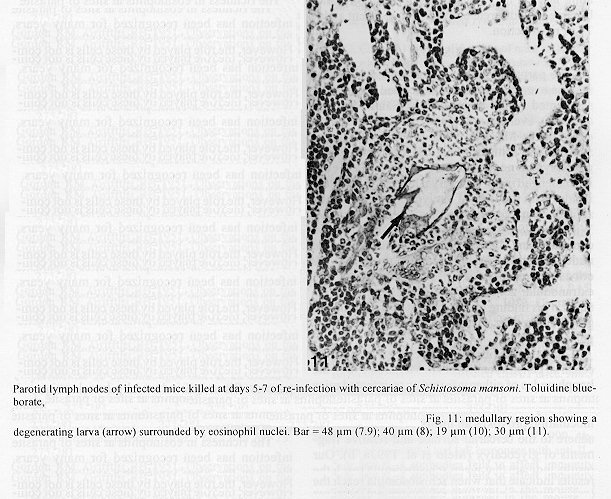
The parotid lymph nodes of naive and previously infected Balb/c mice were studied after, respectively, infection and re-infection with cercariae of Schistosoma mansoni via the ears. Schistosomula were able to pass through the lymph node by following the lymph flow or by penetrating the veins of the medullary cords. The number of nodal mast cells was higher from day 2 to 6 of primary infection; and from day 5 to 11 of re-infection. The amount of degranulating mast cells was significantly higher at day 4 of infection and at day 1 of re- infection. Eosinophils characterized the nodal inflammatory processes observed after day 5 in both primarily-infected and re-infected mice. However, only in the latter the eosinophils were able to adhere to the larval surface. In primarily- infected mice, no intranodal larva presented signs of degeneration. In contrast, in re-infected animals, some degenerating larvae were found inside eosinophilic infiltrates. The eosinophils reached the nodal tissue by migrating through the high endothelial venules and their collecting veins. Key words: Schistosoma mansoni - lymph nodes - schistosomulum migration - eosinophils - mast cells - high endothelial venules When cercariae of Schistosoma mansoni penetrate the host skin, they transform into schistosomula by undergoing several changes such as tail loss, discharge of secretory glands, glycocalyx shedding, and other surface alterations (Gordon & Griffiths 1951, Stirewalt 1974). On their way to the dermal and subdermal layers, the schistosomula may spend several days till their passage to blood and/or lymph vessels at the dermal-hypodermal junction. By incubating slices of lymph nodes, Miller and Wilson (1978) demonstrated that schistosomula can be recovered from mouse nodes up to day 8 of infection, with peak at day 4. Histological studies have shown that schistosomula leave the regional lymph nodes of primarily-infected mouse, passing through the lymphatic sinuses to reach the efferent lymphatic (Wheater & Wilson 1979). However, the fate of schistosomula that reach lymph nodes after re-infection remains to be investigated. Cercarial penetration induces an inflammatory process (Colley et al. 1972), the skin thickness attaining the maximal values 24-48 hr after infection (Lichtenberg et al. 1976, Incani & McLaren 1984). However, the host leukocytic response is regarded as absent in regional lymph nodes of primarily- infected mice (Wheater & Wilson 1979). In infected mice, the changes subsequent to a challenge infection happen earlier, the skin thickness attaining maximal values in a few hours (Colley et al. 1972, Lichtenberg et al. 1976, Savage & Colley 1980, Bentley et al. 1981) but there is no study on regional lymph nodes. The behaviour of the nodal mast cells at both infection and re-infection is unknown. The present work comprises a histological study of a regional lymph node after infection and re-infection of Balb/c mice with S. mansoni cercariae. It is centered on the nodal mast cells, inflammatory processes, and the fate of the schistosomula that reach the node. Previous studies have shown that the mouse ears are adequate for cercarial penetration and for studying the phenomena subsequent to the penetration (Gerken et al. 1986). Therefore, this was the site of stimulation and, consequently, the parotid lymph node that drains the ear was the object of study. Balb/c mice developed resistance to re-infection (reviewed by Dean 1983) even after immunization with irradiated cercariae (Sher et al. 1982). The resistance to challenge infection induced by the short-living attenuated larvae is both thymus and B lymphocyte dependent. Materials and methods Cercariae - Cercariae of S. mansoni (LE strain, Belo Horizonte, Brazil) obtained from laboratory-reared Biomphalaria glabrata were concentrated as described by Pellegrino and Macedo (1955). Mice and infection - Sixty-eight male Balb/c mice aged 60 days at the beginning of the experiments were used as: (a) 6 mice with 12-13 weeks of infection (infected mice); (b) 41 age-matched infected mice to be killed daily from day 1 to 8 and at day 11 of re-infection, (challenged mice); (c) 18 age-matched naive mice to be killed at days 2, 4, 6, and 8 after infection (primarily-infected mice); (d) 4 age-matched non-infected mice. Four to six animals were killed under ether anesthesia at each day of infection or re-infection, in two experiments each one with about half the animals. For obtaining the infected animals, each mouse received a subcutaneous injection of 15 to 20 cercariae in 0.5 ml. For studying the response of lymph nodes to the primary infection and re-infection, anesthetized (Nembutal, 35 mg/kg) mice were infected percutaneously by the right ears with cercariae of S. mansoni. The animals were held on a wooden board containing holes in such a way that the right ears remained immersed in a suspension with 250-300 cercariae, for 1 hr (Gerken et al. 1986). On the average, 80% of the cercariae penetrated each ear. Histological methods - The right parotid lymph nodes were fixed in 1% cetyl pyridinium chloride (w/v) in 10% (v/v) formaldehyde, for 48 hr at room temperature. After alcohol dehydration, the tissues were embedded in glycol methacrylate (JB-4, Polysciences), and serially sectioned at 5 um (Reichert Jung microtome, model 1140). The sections were alternately stained with Giemsa stain (Merck, S o Paulo) and 0.5% toluidine blue (Sigma) containing 1% sodium borate. Mast cells classed as intact and degranulating cells were counted at magnification X 400, in all Giemsa-stained sections at a 25 um interval. In each section, all mast cells exhibiting well-delineated nuclei were counted. An ocular disc containing a 5 mm square prevented recounting. The results were expressed as the mean number of degranulating or intact mast cells per lymph node section. For estimating the number of schistosomula in each lymph node, all toluidine blue stained sections at a 25 um interval were used. Results The parotid lymph node is a non-segmented node (Fig. 1), displaying a continuous peripheral cortex and two to three deep cortex units. An impressive finding was the abundance of macrophage like cells in the perihilar segments of the medullary sinuses (Fig. 2). Mast cells occurred in small number, being found mainly at the perihilar segments of the medullary sinuses (Figs 2, 7). A few of them lay in the subcapsular sinus or just below it, usually in cortical extranodular zones (Fig. 3). Mast cell number - The S. mansoni infection had no effect on the distribution of nodal mast cells either in naive or in infected animals. However, as summarized in Tables I and II, it induced marked changes in the amount of intact and degranulating mast cells. In primarily-infected animals, the number of intact mast cells (Table I) was higher from day 2 to 6 of infection, with peak at day 4. In challenged mice, a significant rise appeared only 5 days after cercarial stimulation, the values increasing till day 7, and remaining high at least until day 11. The number of mast cells presenting signs of degranulation (Table II) was higher at day 4 of infection and day 1 of re-infection. At day 6 of infection and from day 3 to 8 of re-infection, the number of degranulating mast cells was significantly lower as compared with the values found for uninfected and for infected but non- challenged animals. Degranulating mast cells had no relation to the presence of larvae, intact mast cells being frequently seen close to the larvae (Fig. 3). Larval migration and inflammatory processes - Table III presents an estimate of the number of schistosomula in lymph nodes at different periods of the infection and re-infection. In primarily-infected animals, the larvae were practically absent till day 4 of infection, but they were found in all lymph nodes at day 6, the number decreasing by day 8. In the challenged mice, a few larvae appeared by day 3 of re-infection, all lymph nodes exhibiting schistosomula from day 4 to 6 of re-infection. The larvae became rare at days 7 and 8 and had disappeared by day 11. The larval distribution inside the lymph nodes was the same at infection and re-infection. Most larvae lay in the subcapsular sinus (Fig. 3) or in the perihilar segments of medullary sinuses (Fig. 7). A few larvae were seen in extranodular zones and in the segments of the medullary sinuses just below these zones, but they were excluded from the deep cortical units and center of lymphoid nodules. The larger number of larval profiles in the re- infected mice allowed some additional information on the larval migration. At least one larva was found in a small efferent lymph vessel. Serial sections demonstrated that the same larva could have a part in a medullary sinus and another in a medullary cord (Fig. 8), sometimes adjacent to its vein. Finally, two schistosomula were seen in the lumen of medullary cord veins at day 5 of re-infection (Fig. 9). At day 6 of the primary infection, all nodes exhibited eosinophilic inflammatory processes in some cortical extranodular zones, lying between two deep cortex units or in contiguity with the perihilar region (Fig. 4). Some medullary cords, close to the extranodular zones or deep cortex units, also exhibited a higher concentration of eosinophils. At the periphery of deep cortex units, the high endothelial venules showed several eosinophils in their lumen, wall, and neighboring extranodular tissue (Fig. 5). The medullary cord veins close to the deep cortex units could also exhibit eosinophils in their lumen and wall (Fig. 6). No schistosomulum was seen inside the eosinophilic infiltrates and all larvae were free of adherent granulocytes, looking intact. At day 8, eosinophils were frequent in medullary cords, being rarely found in the lymphatic sinuses, however, none contacted the larvae that remained intact. In contrast to the findings in primarily-infected animals, a few larvae exhibiting clear signs of degeneration were observed at days 5, 6 and 7 of re-infection. Inflammatory processes were absent or very discrete till day 4 of re- infection. The presence of eosinophils in the lumen and wall of medullary cord veins was frequent, mainly at day 7. At day 5, only one lymph node presented a focal and intense eosinophilic inflammatory process located in the medullary region and around a degenerating larva. However, eosinophils were easily found in medullary cords of all lymph nodes as well as in some extranodular zones. Some larvae exhibited eosinophils contacting their surface (Fig. 10). The eosinophilic infiltrates became more frequent at days 6 and 7 of re-infection, most of them being discrete and keeping the distribution already described. Intense eosinophilic processes were restricted to the extranodular zone (just one), or medullary cords (two nodes). Each one of these two medullary cords infiltrates surrounded a degenerating larva (Fig. 11). The eosinophilic infiltrates became very discrete at day 8, being absent at day 11 of re- infection.
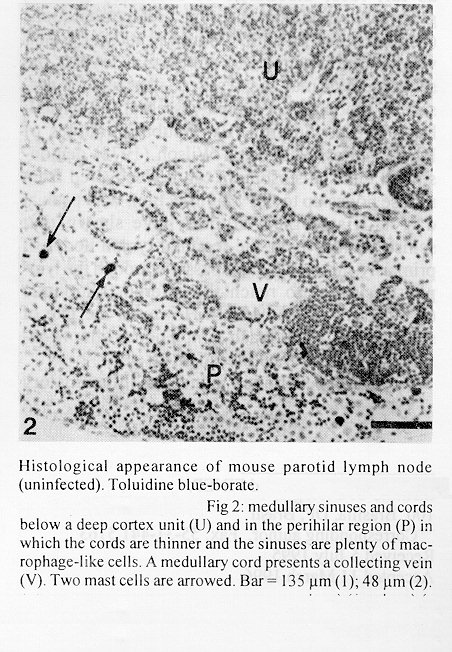
Discussion The parotid lymph node of the mouse exhibited the overall architecture described for the non-segmented lymph nodes of rats (Sainte-Marie et al. 1982), even regarding the distribution of mast cells (Sainte-Marie & Peng 1990). Our findings showed that schistosomula can pass through regional lymph nodes without being damaged, even in challenged mice. The larval migration route coincides with the flow of the lymph, as already described in naive mice (reviewed by Wheater & Wilson 1979). However, we have succeeded in demonstrating that the larvae can also leave the node by penetrating the veins of the medullary cords, probably after migration through extranodular zones in contact with medullary sinuses. This finding indicates that schistosomula can guide themselves to veins, even when in a lymphatic channel. Contrasting with the skin reaction induced by cercarial penetration (Incani & McLaren 1984), the lymph nodes of either infected or re-infected mice presented rare neutrophils. Studies on the peritoneal cavity of naive mice have shown that cercarial inoculation provokes an influx of neutrophils that adhere to the cercarial surface and remove fragments of glycocalyx (Melo et al. 1993a, b). Our results indicate that when schistosomula reach the nodes, they are probably devoid of molecules able to attract neutrophils or mediate their adhesion to the larval surface. In rodents, the number of mast cells increases rapidly in regional lymph nodes after antigenic or non-immunogenic stimulation (Miller & Cole 1968, Roberts 1970, Wlodarski et al. 1973), probably by a process of draining from the stimulation site. However, within 24-48 hr, the number of nodal mast cells decreases to values below the normal ones (Wlodarski et al. 1973). In our primarily-infected mice, the mast cell number increased till day 4 after stimulation dropping to control values only at day 8. Probably, these alterations followed the phenomena occurring at the site of cercarial stimulation. After cercarial penetration, the skin thickness attains maximal values in 48 hr (Incani & McLaren 1984), and this is consistent with the rise in mast cell number at day 2 with peak at day 4. Also, by remaining in the skin for 4 to 5 days (Miller & Wilson 1978), or up to 7 days (Gerken et al. 1986), the schistosomula could create conditions able to maintain the raised number of nodal mast cells till day 6. In the absence of challenge infection, the parotid lymph nodes of infected mice exhibited a larger number of mast cells in comparison with normal animals. Accordingly, this number is also enlarged in the dermis (Fernex & Fernex 1982), peritoneal cavity and liver granulomas (Lenzi et al. 1987), and the histamine levels are higher in the ears (Gerken et al. 1990). The re-infection induced a rise in nodal mast cell number, but there was a delay in comparison with the primary infection. This delay may involve differences in mast cell degranulation. In the primary infection, the number of degranulating mast cells was significantly higher at day 4, occurring after the peak of the skin reactions. In contrast, the number of degranulating mast cells increased at the first day of re- infection as expected for IgE bearing mice (Mota-Santos et al. 1985). In the skin of re-infected mice, the reaction also involves early mast cell degranulation (Bentley et al. 1981, Incani & McLaren 1984). Both dermal and nodal degranulation processes could account for the delay in the rise of nodal mast cell number after re-infection. In the primarily-infected mice, the degranulation of nodal mast cells was not related to the presence of larvae or inflammatory process. Since IgE induced by larval antigens is not supposed to be present at day 4 of infection, direct effects of larval antigens or cross-reactions could be involved. The richness in eosinophils at sites of parasite infection has been recognized for many years. However, the role played by these cells is not completely elucidated. In vitro studies have shown that eosinophils might be efficient anti- parasite effectors by their ability to kill schistosomula in the presence of immune sera (Butterworth et al. 1975, Sher & Rees 1975, Anwar et al. 1979). However, in vivo evidence for such a role is sparse and equivocal (Mahmoud et al. 1975, Sher et al. 1990). In the present study, both primary infection and re-infection induced an influx of eosinophils to nodal tissue through the high endothelial venules and their collecting veins in medullary cords. However, only in the re-infected animals were the eosinophils able to adhere to the larval surface, damaged larvae being found inside eosinophilic infiltrates. The significance of this adhesion is not clarified by our histological study, since it could either signify a role in larval death or a phenomenon secondary to larval degenerative changes. Notwithstanding, the regional lymph nodes seem to be of slight importance in limiting the re-infection, judging by the small number of intranodal degenerating larvae. However, larval lesions could have occurred without detectable histologic changes. Therefore, it remains the possibility of larval damage inside and death outside the nodal tissue. References Anwar ARE, Smithers SR, Kay AB 1979. Killing of schistosomula of Schistosoma mansoni coated with antibody and/or complement by human leukocytes in vitro: requirement for complement in preferential killing by eosinophils. J Immunol 122: 628-637. Bentley AG, Carlisle AS, Philips SM 1981. Ultrastructural analysis of the cellular response to Schistosoma mansoni. II. Inflammatory responses in rodent skin. Am J Trop Med Hyg 30: 815-824. Butterworth AE, Sturrock RF, Houba V, Mahmoud AAF, Sher A, Rees PH 1975. Eosinophils as mediators of antibody-dependent damage to schistosomula. Nature 256: 727-728. Colley DG, Magalh es-Filho A, Coelho RB 1972. Immunopathology of dermal reactions induced by Schistosoma mansoni cercariae and cercarial extract. Am J Trop Med Hyg 21: 558-568. Dean DA 1983. A review. Schistosoma and related genera: acquired resistance in mice. Exp Parasitol 55: 1- 104. Fernex M, Fernex P 1982. Increased number of mast cells and helminthic diseases. Experimental mastocytosis in mice. Acta Trop 19: 248-251. Gerken SE, Oliveira AFS, Correa-Oliveira R, Mota-Santos TA 1986. Schistosoma mansoni: infecc o experimental de camundongos atraves da orelha e quantificac o do parasitismo na pele. Rev Inst Med Trop Sao Paulo 28: 381- 388. Gerken SE, Vaz NM, Mota-Santos TA 1990. Local anaphylatic reactions to the penetration of cercariae of Schistosoma mansoni. Braz J Med Biol Res 23: 275-281. Gordon RM, Griffths RB 1951. Observations on the means by which the cercariae of Schistosoma mansoni penetrate mammalian skin, together with an account of certain morphological changes observed in the newly penetrated larvae. Ann Trop Med Parasitol 45: 227-243. Incani RN, McLaren DJ 1984. Histopathological and ultrastructural studies of cutaneous reactions elicited in naive and chronically infected mice by invading schistosomula of Schistosoma mansoni. Int J Parasitol 14: 259-276. Lenzi HL, Sobral ACL, Lenzi JA 1987. In vivo kinetics of eosinophils and mast cells in experimental schistosomiasis. Mem Inst Oswaldo Cruz 82 (Suppl. 4): 67-76. Litchtenberg F von, Sher A, Gibbons N, Doughty BS 1976. Eosinophil-enriched inflammatory response to schistosomula in the skin of mice immune to Schistosoma mansoni. Am J Pathol 84: 479-500. Mahmoud AAF, Warren KS, Peters P 1975. A role for the eosinophil in acquired resistance to Schistosoma mansoni infection as determined by anti-eosinophil serum. J Exp Med 142: 805-813. Melo AL, Machado CRS, Pereira LH 1993a. Host cell adhesion to Schistosoma mansoni larvae in the peritoneal cavity of naive mice. Histological and scanning electron microscopic studies. Rev Inst Med Trop Sao Paulo 35: 17-22. Melo AL, Machado CRS, Pereira LH 1993b. Interaction between neutrophils and Schistosoma mansoni larvae in vivo. Rev Inst Med Trop Sao Paulo 35: 29- 33. Miller JJ, Cole LJ 1968. Proliferation of mast cells after antigenic stimulation in adult rats. Nature 217: 263. Miller P, Wilson RA 1978. Migration of schistosomula of Schistosoma mansoni from the skin to lungs. Parasitol 77: 281-302. Mota-Santos TA, Oliveira AFS, Gerken SE, Vaz NM 1985. Anaphilaxis with Schistosoma mansoni extracts in normal and infected mice. Rev Inst Med Trop Sao Paulo 27: 179-185. Pellegrino J, Macedo DG 1955. A simplified method for the concentration of cercariae. J Parasitol 41: 329- 333. Roberts AN 1970. Early mast cell responses in mouse popliteal lymph nodes to localized primary antigenic stimuli. J Immunol 105: 187-192. Sainte-Marie G, Peng FS 1990. Mast cells and fibrosis in compartments of lymph nodes of normal, gnotobiotic, and athymic rats. Cell Tissue Res 261: 1-15. Sainte-Marie G, Peng FS, Belisle C 1982. Overall architecture and pattern of lymph flow in the rat lymph node. Am J Anat 164: 275-309. Savage AM, Colley DG 1980. The eosinophil in the inflammatory response to cercarial challenge of sensitized and chronically infected CBA/J mice. Am J Trop Med Hyg 29: 1268- 1278. Sher A, Rees PH 1975. Eosinophils as mediators of antibody- dependent damage to schistosomula. Nature 256: 727-729. Sher A, Coffman RL, Hieny S, Cheever AW 1990. Ablation of eosinophil and IgE responses with anti-IL-5 or anti-IL-4 antibodies fails to affect immunity against Schistosoma mansoni in the mouse. J Immunol 145: 3911- 3916. Sher A, Hieny S, James SL, Asofsky R 1982. Mechanisms of protective immunity against Schistosoma mansoni infection in mice vaccinated with irradiated cercariae. II. Analysis of immunity in hosts deficient in T lymphocytes, B lymphocytes, or complement. J Immunol 128: 1880- 1884. Stirewalt MA 1974. Schistosoma mansoni: Cercaria to schistosomula. Adv Parasitol 12: 115-182. Wheater PR, Wilson RA 1979. Schistosoma mansoni: a histological study of migration in the laboratory mouse. Parasitology 79: 49-62. Wlodarski K, Hancox NM, Zaleski M, Zaleska G 1973. The kinetics of mast cells in lymph nodes of immunized mice. Immunology 24: 47-53. Supported by CNPq and FINEP. -------------------------------------------------------------- Figure 1 and 2. Histological appearance of mouse parotid lymph node (uninfected). Toluidine blue-borate.
Fig 2: medullary sinuses and cords below a deep cortex unit (U) and in the perihilar region (P) in which the cords are thinner and the sinuses are plenty of macrophage-like cells. A medullary cord presents a collecting vein (V). Two mast cells are arrowed. Bar = 135 um (1); 48 um (2).
Fig. 4: Giemsa stain shows eosinophils (the cytoplasm darker than the nucleus) in the inflammatory process of an extranodular zone. Fig. 5: a high endothelial venule displaying eosinophils in its lumen, wall (arrowheads) and neighboring extranodular tissue (arrows). Giemsa stain. Fig. 6: a medullary cord exhibiting several eosinophils; its vein (V) also shows eosinophils in the lumen (arrow) and wall (arrowheads). Giemsa stain. Bar = 48 um (3.6); 19 um (4.5).
Fig. 8: a larva passing from a medullary sinus to a medullary cord. Fig. 9: a medullary cord vein presenting a larva in its lumen (arrows). Fig. 10: a larva (arrow) in a medullary sinus exhibiting eosinophils adhered to its surface. Giemsa stain. Fig. 11: medullary region showing a degenerating larva (arrow) surrounded by eosinophil nuclei. Bar = 48 um (7.9); 40 um (8); 19 um (10); 30 um (11).
--------------------------------------------------------------
Table I. Mean number of intact mast cells per right parotid
lymph node section in naive and infected Balb/c mice.
Infection or re-infection with Schistosoma mansoni
cercariae through the right ear. In parenthesis, the
number of animals

----------------------------------------------------------
Days after
(re)infection      Naive mice          Re-infected mice
--------------------------------------------------------------
    0           8.53+/-3.22 (4)        12.06+/-2.90 (6)
    1           not done                9.70+/-2.05 (6)
    2           15.99+/-0.55^c (4)     15.15+/-2.46 (4)
    3           not done               13.79+/-3.30 (5)
    4           29.22+/-11.76^b^ (5)   15.57+/-8.49 (4)
    5           not done               27.97+/-11.33^a (4)
    6           16.66+/-5.29^a^ (5)    32.61+/-10.96^c (5)
    7           not done               34.57+/-8.73^c^ (4)
    8           12.47+/-5.36 (4)       23.35+/-8.30^a (5)
    11          not done               19.24+/-12.24^a (4)

Values are significantly different from the first value of the
same column, when marked with a:(P<0.05), b:(P<0.005), or
c:(P<0.001).
--------------------------------------------------------------

Table II. Mean number of degranulating mast cells per
section of right parotid lymph nodes in naive and infected
Balb/c mice. Infection or re-infection with cercariae of
Schistosoma mansoni, through the right ear. Number of
animals as in Table I
--------------------------------------------------------------
Days after
(re)infection         Naive mice       Re-infected mice
--------------------------------------------------------------

    0                4.30+/-1.58        7.74+/-1.19
    1                                  12.67+/-4.09^a
    2                6.09+/-4.35        8.53+/-1.35
    3                                   5.90+/-1.37^a
    4               10.57+/-2.27        4.30+/-2.30^a
    5                                   4.99+/-1.00^a
    6                2.20+/-0.44        4.01+/-1.00^c
    7                                   4.15+/-0.78^b
    8                4.58+/-2.18        5.41+/-0.78^b
    11                                  7.27+/-2.67

Values significantly different from the first value of the
same column are marked with a: (P<0.05), b:^ (P<0.005) or c:
(P<0.001).
--------------------------------------------------------------

Table III. Estimative of the amount of schistosomules in
the right parotid lymph nodes in naive and infected (immune)
Balb/c mice. Infection or re-infection with Schistosoma
mansoni cercariae through the right ear. The number of
animals in parenthesis
--------------------------------------------------------------
Days after
(re)infection  Naive mice     Re-infected mice
--------------------------------------------------------------
    1                         no larva (6)
    2          no larva (4)   no larva (6)
    3                         0-3 larva/section of 2 nodes(5)
    4         one larva in    1-5 larvae/section, all nodes(4)
              one node (5)
    5                         1-7 larvae/section, all nodes(4)
    6     1-3 larvae/section, 0-4 larvae/section, all nodes(5)
              all nodes (5)

    7                         1 larva in 1 node (4)
    8    0-2 larvae/section   no larva (5)
             of 3 nodes (5)
    11                        no larva (4)
--------------------------------------------------------------
Copyright 1996 Fundacao Oswaldo Cruz The following images related to this document are available:Photo images[oc96094i.jpg] [oc96094j.jpg] [oc96094b.jpg] [oc96094g.jpg] [oc96094k.jpg] [oc96094d.jpg] [oc96094a.jpg] [oc96094e.jpg] [oc96094h.jpg] [oc96094f.jpg] [oc96094c.jpg] |
| |||||||||
