 |
| About Bioline | All Journals | Testimonials | Membership | News |
|
||||||
|
||||||
Quantitation of HIV-1 RNA Viral Load Using NASBA Methodology and Comparison with other Surrogate Markers for Disease Progression Roberta Sitnik , Joao Renato Rebello Pinho^+*
Bioquimico Jardim Paulista, Av. Brigadeiro Luiz Antonio 4701, 01401-002 Sao
Paulo, SP Received 11 March 1998; Accepted 16 April 1998
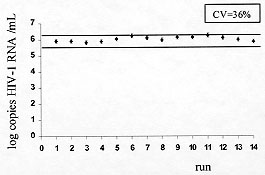
Code Number:OC98080 In this study, HIV-1 viral load quantitation determined by Nucleic Acid Sequence Based Amplification (NASBA) was compared with other surrogate disease progression markers (antigen p24, CD4/CD8 cell counts and b-2 microglobulin) in 540 patients followed up at Sao Paulo, SP, Brazil. HIV-1 RNA detection was statistically associated with the presence of antigen p24, but the viral RNA was also detected in 68% of the antigen p24 negative samples, confirming that NASBA is much more sensitive than the determination of antigen p24. Regarding other surrogate markers, no statistically significant association with the detection of viral RNA was found. The reproducibility of this viral load assay was assessed by 14 runs of the same sample, using different reagents batches. Viral load values in this sample ranged from 5.83 to 6.27 log (CV = 36 %), less than the range (0.5 log) established to the determination of significant viral load changes. Key words: Human Immunodeficiency Virus type 1 - viral load - Nucleic Acid Sequence Based Amplification (NASBA) - surrogate markers The natural history of human immunodeficiency virus type 1 (HIV-1) infection is highly variable. In adults, the average time between infection and development of AIDS is 10 to 11 years, but a significant proportion of individuals (~20%) rapidly progresses to AIDS within 5 years of infection (Mellors et al. 1996). This variable course causes uncertainty for the infected person and complicates decisions about when antiretroviral therapy should begin. Many clinical and laboratory markers have been used for prognosis in HIV-1 infection: circulating CD4 and CD8 T cell counts, p24 antigen and beta-2 microglobulin quantification (Jurriaans et al. 1994, Mellors et al. 1997). Among these markers, previous studies showed that the single best predictor of progression to AIDS was the percentage or absolute number of circulating CD4 lymphocytes (Jurriaans et al. 1994, Mellors et al. 1997). Direct HIV-1 RNA quantitation has recently become a useful method for assessing and monitoring HIV-1 disease progression. Viral RNA in plasma or serum directly reflects the titer of HIV-1 during infection and is a better marker to predict the subsequent risk of AIDS or death than the other markers cited above (Mellors et al. 1996). As a direct measurement of circulating virus, HIV-1 viral load is expected to give complementary information to other markers that monitor the immunological status, as lymphocytes subsets cell counts and seric beta-2 microglobulin levels. Besides, viral load has enabled physicians to monitor the efficacy of antiretroviral therapies before clinical monitoring becomes possible, since it has been shown that the efficacy of treatment seems to be correlated with a rapid and dramatic decrease in the HIV-1 RNA level (Coste et al. 1996). In the present study, we have investigated the value of Nucleic Acid Sequence Based Amplification (NASBA) HIV-1 quantitation system (Organon Teknika Boxtel, Netherlands) for evaluating the quantitation of HIV-1 RNA and compared the results with four surrogate markers: CD4 and CD8 cell counts, p24 antigen and beta-2 microglobulin. MATERIALS AND METHODS Patients - We analyzed 540 outpatients infected with HIV-1 attended by different physicians in Sao Paulo, Brazil. Blood samples (collected without anticoagulant) were centrifuged and processed within 4 hr from the collection to separate the serum. Sera were stored at -20 C for a maximal period of one month before the quantitation test. One sample with a high viral load was aliquoted and tested 14 times on different days and with different batches of reagents to test the reproducibility of the method. Each sera aliquot was stored at -20 C for a maximal period of four months and thawn only once immediately before use. The coefficient of variation (CV) was calculated to determine the inter-assay variance. HIV-1 RNA quantitation - NASBA assay was carried out according to manufacturers instructions, as summarized bellow. HIV-1 RNA was extracted from 1.0 mL of serum using a lysis buffer containing Guanidine Thiocyanate. Three synthetic RNA calibrators (Qa, Qb, Qc) of known high (10^6), medium (10^5), and low (10^4) concentrations (in copies/mL), respectively, were added. Each calibrator contained a short unique sequence differing from the HIV-1 wild type. RNA was extracted by using acidified silica, according to the procedure described by Boom et al. (1990). HIV-1 and calibrator RNA sequences were co-amplified by incubation of the extraction product with the primers and the enzyme mixture (Reverse Transcriptase, RNase H and T7 RNA Polymerase) at 41 C for 90 min. The RNA concentration of HIV-1, Qa, Qb and Qc amplicons were measured in four separated tubes. In each tube, the amplified RNA was captured with a biotin-labeled oligonucleotide bound to streptavidin-coated magnetic beads acting as the solid phase, and then hybridized with a specific ruthenium-labeled probe complementary to the HIV-1, Qa, Qb or Qc specific sequence. The magnetic beads carrying the hybridized amplicon-probe complex were captured on the surface of an electrode by means of a magnet. Voltage applied to the electrode triggered the eletroluminescence reaction, in the presence of a buffer containing Tripropylamine. The light emitted by the ruthenium-labeled complex, measured by a photo - multiplier valve, was proportional to the amount of amplicon. Calculation of the relative amount of the four amplicons revealed the amount of HIV-1 RNA in the sample. Surrogate disease progression markers - p24 antigen, beta2-microglobulin, and CD4 and CD8 T cell counts assays were carried out according to the manufacturers instructions. The utilized methods and number of patients analised for each marker were: (1) p24 antigen: Vidas, BioMerieux (Marcy-l'Etoile, France); 180 patients; (2) beta-2 microglobulin: Vidas, BioMerieux (Marcy-l'Etoile, France) or Immulite, DPC (Los Angeles, California, USA); 145 patients; (3) CD4 and CD8 counts: immunofluorescence with monoclonal antibodies, Dako (Glostrup, Denmark); 254 patients. The number of patients tested for surrogate disease progression markers varied depending on availability of sample for the study. Statistical analysis- The chi^2 and t-student test were used for comparing viral load and surrogate disease progression markers. chi^2 test was used for comparing the distribution of the results obtained with surrogate disease progression markers with viral load results, while t-student test was used for comparing the mean values obtained with these tests. RESULTS Analysis of the coefficient of variation (CV) of the NASBA method - The analysis of the same sample by NASBA in several different runs is shown in Fig. 1. The CV was 36%, with values ranging from 5.83 to 6.27 log, i.e., less than 0.5 log of difference between all of them. It is noteworthy that even after four months of storage at -20 C, the viral load value obtained with this samples did not decrease.
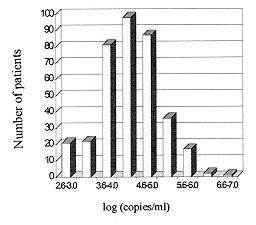
Distribution of viral load among patients of group 1 is illustrated in Fig. 2. Viral load values were normally distributed over a range of 2.6 to 7.0 log copies/mL with 73% of the samples presenting values between 3.6 and 5.0 log HIV-1 RNA copies/mL.
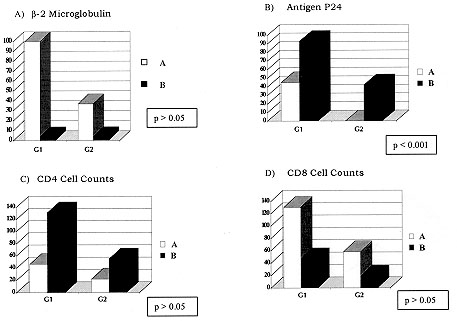
Y - Absolute number of patients; X - G1: patients with detectable HIV-1 RNA (>400 copies/mL) and G2: patients with viral load bellow detection limit (<400 copies/mL). A) b2 microglobulin - A: >1 x upper normal limit, B: < 1 x upper normal limit; B) p24 antigen - A: p24 positive, B: p24 negative; C) CD4 cell counts - A: <500 cells/ mm^3, B: >500 cells/ mm^3; D) CD4 cell counts - A: >400 cells/ mm^3, B: <400 cels/mm^3.
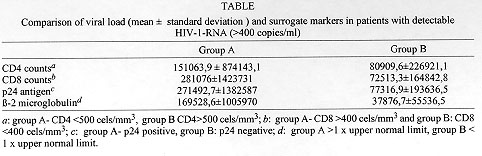
DISCUSSION We evaluated the performance of one commercially available procedure for HIV-1 quantitation, the NASBA system. Our results were reproducible with less than 0.5 log difference between different assays carried out on different days and using different batches of reagents. In previous studies, data on the reproducibility within-runs of the NASBA assay in a high level plasma ranged from 13-62% (Coste et al. 1996), or 15-57% (Vandamme et al. 1996) with a report of inter-batch CV was 37% (Coste et al. 1996), results very similar to those obtained in the present study. In another study the CV ranged from using the NASBA method. Since differences of less than 0.5 log are not considered clinically significant (Saag et al. 1996), these results were satisfactory, confirming that the NASBA system is a reliable method for assessing viral load. However, it is noteworthy that the determination of this 0.5 log range has been based mostly on studies using bDNA and PCR assays (Coombs et al., 1996, O'Brien et al. 1996). When the results of HIV-1 RNA levels and surrogate markers were compared, it was observed that viral RNA was detected in all the p24 antigen positive samples, as well as in the majority of p24 antigen negative samples. The lower sensitivity of p24 antigenemia have already been reported by many other authors (Winters et al. 1993, Lin et al. 1994, van Karkhoven et al. 1994, Coste et al 1996). These results clearly showed the higher sensivity of viral load determination in comparison with p24 antigen detection. This point raise doubts about the usefulness of HIV-1 p24 antigenemia for monitoring HIV-1 infected patients, especially considering some reports of false-positive results obtained with p24 assays (Vincent et al. 1995). No association was found among viral load and CD4 and CD8 cell counts or beta-2 microglobulin, according to previously published data (Mellors et al. 1996). Conversely, other authors previously reported an inverse correlation between CD4 counts and HIV-1 RNA level (Winters et al. 1993, Lin et al. 1994, van Karkhoven et al. 1994, Coste et al. 1996). beta-2 microglobulin did not provide additional prognostic information and was found to be a non-specific marker of immune activation (Mellors et al. 1997). Our results corroborate other studies which showed the importance of viral load determination in HIV-1 infected patients and the usefulness of the NASBA methodology for this purpose. Although HIV-1 replication is related with immune impairment, predicting the rate of decrease in CD4 cell counts and progression to AIDS and death, no direct correlation between viral load and immunological markers are found in isolated samples. While viral load determinations evaluate the cause of the disease (i.e., the viral burden), CD4 cell counts monitor the consequences of the viral infection in the immunological system at a particular time (Ho 1996, Coombs et al. 1996, Mellors et al. 1997). In conclusion, combined measurement of HIV-1 RNA and CD4 cell counts, which constitute complementary markers, should be routinely performed for the follow up of HIV infected patients. REFERENCES
Copyright 1998 Fundacao Oswaldo Cruz - Fiocruz The following images related to this document are available:Photo images[oc98080d.jpg] [oc98080b.jpg] [oc98080a.jpg] [oc98080c.jpg] |
| |||||||||
