 |
| About Bioline | All Journals | Testimonials | Membership | News |
|
||||||
|
||||||
Vol. 93 (5), September/October 1998, pp. 647-650 Systematics and Population Level Analysis of Anopheles darlingi JE Conn Department of Biology, University of Vermont, Burlington, VT, USA Received 15 June 1998 ; Accepted 30 July 1998
Code Number:OC98123
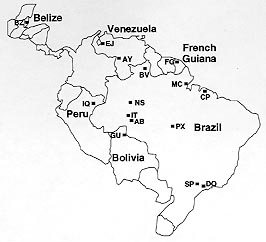
A new phylogenetic analysis of the Nyssorhynchus subgenus (Danoff-Burg and Conn, unpub. data) using six data sets {morphological (all life stages); scanning electron micrographs of eggs; nuclear ITS2 sequences; mitochondrial COII, ND2 and ND6 sequences} revealed different topologies when each data set was analyzed separately but no heterogeneity between the data sets using the arn test. Consequently, the most accurate estimate of the phylogeny was obtained when all the data were combined. This new phylogeny supports a monophyletic Nyssorhynchus subgenus but both previously recognized sections in the subgenus (Albimanus and Argyritarsis) were demonstrated to be paraphyletic relative to each other and four of the seven clades included species previously placed in both sections. One of these clades includes both Anopheles darlingi and An. albimanus, suggesting that the ability to vector malaria effectively may have originated once in this subgenus. Both a conserved (315 bp) and a variable (425 bp) region of the mitochondrial COI gene from 15 populations of An. darlingi from Belize, Bolivia, Brazil, French Guiana, Peru and Venezuela were used to examine the evolutionary history of this species and to test several analytical assumptions. Results demonstrated (1) parsimony analysis is equally informative compared to distance analysis using NJ; (2) clades or clusters are more strongly supported when these two regions are combined compared to either region separately; (3) evidence (in the form of remnants of older haplotype lineages) for two colonization events; and (4) significant genetic divergence within the population from Peixoto de Azevedo (State of Mato Grosso, Brazil). The oldest lineage includes populations from Peixoto, Boa Vista (State of Roraima) and Dourado (State of São Paulo). Key words: Anopheles - Nyssorhynchus - Anopheles darlingi - phylogeny - combined analysis - parsimony - distance analysis In the neotropics, species in the subgenus Nyssorhynchus are responsible for many of the estimated 20 million annual cases of malaria (Goriup & Pull 1988). The original phylogenetic hypothesis for this important subgenus (Faran 1980, Faran & Linthicum 1981, Linthicum 1988) was based on morphological characters. The subgeneric treatment of Peyton et al. (1992) placed Nyssorhynchus species in three purportedly monophyletic sections: Albimanus, Argyritarsis and Myzorhynchella. A recent parsimony analysis of eight species from the Albimanus section using partial sequences of the mtDNA genes ND2 and ND6 (Perera 1993) had no nodes in common with those of Faran (1980). Relationships among species in Nyssorhynchus remained unresolved until the recent analysis of Danoff-Burg and Conn (unpub. data) which forms the basis for the systematic portion of this presentation. A subset of their objectives was: (1) an analysis of members of the Albimanus (15 species) and Argyritarsis (8 species) sections using six data sets (morphology, egg ultrastructure, ITS2 region, and mitochondrial genes COII, ND2 and ND6); (2) an examination of character congruence between these data sets using the arn and Templeton tests (Larson 1994, Farris et al. 1995); and (3) a reevaluation of the earlier classifications of Nyssorhynchus with regard to a new total evidence phylogeny based on parsimony where all available data were equally weighted and included. Anopheles darlingi has historically been considered the most important malaria vector throughout much of South America (Deane et al. 1946). Prior to the analysis of Danoff-Burg and Conn (unpub. data), it was placed in the Argyritarsis section of the Nyssorhynchus subgenus (Linthicum 1988). It is broadly distributed and has been incriminated as an important regional vector of Plasmodium falciparum, the most dangerous of the malaria parasites (Deane et al. 1946), but it is also a competent vector of other malaria species (Klein et al. 1991). Although the taxonomic status of An. darlingi has recently been reevaluated throughout its range and is now considered a single species by allozyme, RAPD-PCR, ITS2 and morphological analysis (Manguin et al. unpub. data), questions remain concerning populations which differ in biting times (reviewed in Rosa-Freitas et al. 1992), life history characteristics (Lounibos et al. 1995) and genetic divergence (discussed in the present work). These heterogeneous traits (and others) may influence the vector competence of An. darlingi in different regions in the neotropics. We sequenced two regions (one conserved and one variable) of the mtDNA gene COI from 15 populations of An. darlingi from Belize to São Paulo to conduct a population level analysis comparing parsimony and distance methods (Conn & Hennig, unpub. data). Assumptions or hypotheses to be tested at the population level were: (H1) analysis based on distance measurements is more informative than cladistic analysis; (H2) different molecular models (for distance analysis) provide different estimates of genetic divergence; (H3) the more variable region of the mtDNA COI gene gives better resolution among haplotype lineages than the more conserved region; (H4) analysis of combined conserved and variable regions is more informative at various levels of divergence than analysis of either region alone. MATERIALS AND METHODS Systematics - Methods of extraction and amplification of DNA, as well as methodology for the phylogenetic analysis of the six data sets, the congruence tests, and outgroup treatment are found in Danoff-Burg and Conn (unpub. data). Population level - DNA was extracted from individual wild-caught mosquitoes following the protocol in Collins et al. (1987). These mosquitoes were collected from BZ (Belize), EJ (El Juval, Trujillo, Venezuela), AY (Puerto Ayacucho, Amazonas, Venezuela), FG (French Guiana), IQ (Iquitos, Peru), GU (Guayaramerín, Bolivia), BV (Boa Vista, Roraima, Brazil), MC (Macapá, Amapá, Brazil), CP (Capanema, Pará, Brazil), NS (Tefé, Amazonas, Brazil), IT (Itacoatiara, Amazonas, Brazil), AB (Porto Velho, Rondônia, Brazil), PX (Peixoto de Azevedo, Mato Grosso, Brazil), SP (Araraquara, São Paulo, Brazil) and DO (Dourado, São Paulo, Brazil) (Fig.). Primers for the two regions of the COI gene were from Lunt et al. (1996). For the parsimony analysis the following parameters were used with PAUP 3.1.1. (Swofford 1993): unrooted trees, heuristic search, and trees were assessed by bootstrap analysis (100-1000 replicates) (Felsenstein 1985). Three distance models were assessed by the Neighbor-Joining (NJ) distance method: uncorrected p, Tamura-Nei and HKY85 and all were tested by 1000 bootstrap replications. Details of this analysis are from Conn and Hennig (unpub. data). Figure: Collection localities for samples of Anopheles darlingi. RESULTS Systematics - The reanalysis of the 49 morphological characters from Faran (1980), Faran and Linthicum (1981) and Linthicum (1988) produced a largely unresolved strict consensus tree which was eight steps shorter than the original (Danoff-Burg & Conn, unpub. data). The analysis of the six different data sets (morphology, egg ultrastructure, ITS2 region, and mitochondrial genes COII, ND2 and ND6) each produced a distinctive topology even though the character-based heterogeneity was not significantly different between any two matrices. The tree based on the ITS2 analysis alone most accurately reflected the new phylogenetic hypothesis which was produced when all data were combined. This new phylogeny supported monophyly of the subgenus Nyssorhynchus but both the Albimanus and Argyritarsis sections were paraphyletic relative to each other and four clades contained species previously placed in both sections. Both An. albimanus (previously in the Albimanus section) and An. darlingi (previously in the Argyritarsis section) arose basally in the phylogeny. Population level - For the 27 individuals sequenced for the conserved region alone (315 bp), there were 20 characters that were parsimony informative. With 1,000 bootstrap replicates, four clades were supported: BV-NS at 53%; CP1-CP2-DO at 66%; FR-MC at 53%; PX1-PX2 at 100%. Individuals from the same locality were found in the same clade 50% of the time and little geographic partitioning was apparent. For the variable region alone (425 bp), 66 characters were parsimony informative among the 24 individuals sequenced. Two clades were supported (100 bootstrap replicates): EJ1-GU1-EJ2-DO1-NS4-AB3 at 52% and SP2-PX1-BV3-PX2-DO2-NS3-AB4 at 61%. Except for PX and EJ, individuals from the same populations were not found in the same clades. The combined region (740 bp) had 81 characters that were parsimony informative for the 22 individuals sequenced. Three clades were supported at 200 bootstrap replications: EJ1-GU1-EJ3 at 68%; PX1-PX2-BV3-DO2 at 100% and NS4-AB3 at 82%. The clade composition was similar to that found in the variable region even though one additional clade was supported by the analysis of the combined regions. The parsimony trees for each of the COI regions were tested to determine if there was phylogenetic signal by comparing each of the three tree lengths {conserved region (TL = 53), variable region (TL = 256), combined regions (TL =289)}to a distribution of tree lengths of 1000 randomly generated trees. All three trees contained significant phylogenetic signal using this test. A comparison of the parsimony analysis of the combined regions with each of the three distance models demonstrated that the trees from the parsimony and the HKY85 model were identical in clade composition (EJ1-GU1-EJ3, PX1-PX2-BV3-DO2, NS4-AB3) and differed very slightly in levels of bootstrap support. For the uncorrected p and Tamura-Nei models, three additional populations were supported (SP2, AB4, and NS3) either as a separate clade (uncorrected p) or as part of a larger clade (Tamura-Nei). Results of the four hypotheses were: (H1) trees were either more resolved using parsimony (conserved and variable regions analyzed separately) or nearly equally resolved (combined analysis) as compared with distance analyses; (H2) of the three distance models tested, HKY85, the most parameter-rich model, gave the least amount of resolution (i.e., lowest levels of bootstrap support); (H3) for conserved vs. variable regions of the COI gene, parsimony analysis resulted in more lineages being supported (four) for the conserved region compared with the variable region (two) but most of the same populations were grouped with both regions; while for the distance analyses between regions, each model contained the same number of lineages; (H4) the combined analysis for both the parsimony and distance was more informative than for either region alone. A graph of the frequencies of pairwise genetic distances of both regions combined using uncorrected p (x-axis) compared with the number of pairwise comparisons (y-axis) resulted in a bimodal distribution. The genetic distances for the first peak ranged from 0.004-0.05. All of the pairwise comparisons of high genetic distances (0.06-0.13; the second peak) included at least one individual from PX, BV or DO. RESULTS Systematics - The reanalysis of the 49 morphological characters from Faran (1980), Faran and Linthicum (1981) and Linthicum (1988) produced a largely unresolved strict consensus tree which was eight steps shorter than the original (Danoff-Burg & Conn, unpub. data). The analysis of the six different data sets (morphology, egg ultrastructure, ITS2 region, and mitochondrial genes COII, ND2 and ND6) each produced a distinctive Population level - For the 27 individuals sequenced for the conserved region alone (315 bp), there were 20 characters that were parsimony informative. With 1,000 bootstrap replicates, four clades were supported: BV-NS at 53%; CP1-CP2-DO at 66%; FR-MC at 53%; PX1-PX2 at 100%. Individuals from the same locality were found in the same clade 50% of the time and little geographic partitioning was apparent. For the variable region alone (425 bp), 66 characters were parsimony informative among the 24 individuals sequenced. Two clades were supported (100 bootstrap replicates): EJ1-GU1-EJ2-DO1-NS4-AB3 at 52% and SP2-PX1-BV3-PX2-DO2-NS3-AB4 at 61%. Except for PX and EJ, individuals from the same populations were not found in the same clades. The combined region (740 bp) had 81 characters that were parsimony informative for the 22 individuals sequenced. Three clades were supported at 200 bootstrap replications: EJ1-GU1-EJ3 at 68%; PX1-PX2-BV3-DO2 at 100% and NS4-AB3 at 82%. The clade composition was similar to that found in the variable region even though one additional clade was supported by the analysis of the combined regions. The parsimony trees for each of the COI regions were tested to determine if there was phylogenetic signal by comparing each of the three tree lengths {conserved region (TL = 53), variable region (TL = 256), combined regions (TL =289)}to a distribution of tree lengths of 1000 randomly generated trees. All three trees contained significant phylogenetic signal using this test. A comparison of the parsimony analysis of the combined regions with each of the three distance models demonstrated that the trees from the parsimony and the HKY85 model were identical in clade composition (EJ1-GU1-EJ3, PX1-PX2-BV3-DO2, NS4-AB3) and differed very slightly in levels of bootstrap support. For the uncorrected p and Tamura-Nei models, three additional populations were supported (SP2, AB4, and NS3) either as a separate clade (uncorrected p) or as part of a larger clade (Tamura-Nei). Results of the four hypotheses were: (H1) trees were either more resolved using parsimony (conserved and variable regions analyzed separately) or nearly equally resolved (combined analysis) as compared with distance analyses; (H2) of the three distance models tested, HKY85, the most parameter-rich model, gave the least amount of resolution (i.e., lowest levels of bootstrap support); (H3) for conserved vs. variable regions of the COI gene, parsimony analysis resulted in more lineages being supported (four) for the conserved region compared with the variable region (two) but most of the same populations were grouped with both regions; while for the distance analyses between regions, each model contained the same number of lineages; (H4) the combined analysis for both the parsimony and distance was more informative than for either region alone. A graph of the frequencies of pairwise genetic distances of both regions combined using uncorrected p (x-axis) compared with the number of pairwise comparisons (y-axis) resulted in a bimodal distribution. The genetic distances for the first peak ranged from 0.004-0.05. All of the pairwise comparisons of high genetic distances (0.06-0.13; the second peak) included at least one individual from PX, BV or DO. ACKNOWLEDGMENTS For logistic and technological support in the field I thank collaborators in Bolivia (Unidad Sanitaria, Riberalta), Brazil (Fundação Nacional da Saúde, Fundação Oswaldo Cruz, Institituo Evandro Chagas, Instituto de Pesquisas Científicas e Tecnológicas do Estado do Amapá), France (LIN-ORSTOM), Peru (NAMRID, Iquitos) and Venezuela (Univ. de los Andes, Trujillo; Univ Central, Caracas; Malariología, Maracay). To RC Wilkerson for additional specimens from Brazil. To WC Kilpatrick for constructive criticism. To JA Danoff-Burg and A Hennig for the excellent collaboration. These projects received financial support from the National Institutes of Health (NIH; USA) grant AI 31034 to LP Lounibos and NIH grant AI 40116 to JE Conn. REFERENCES Collins FH, Mendez MA, Rasmussen MO, Mehaffey PC, Besansky NJ, Finnerty V 1987. A ribosomal RNA gene probe differentiates member species of the Anopheles gambiae complex. Am J Trop Med Hyg 37: 37-41. Conn JE, Mitchell SE, Cockburn AF 1998. Mitochondrial DNA analysis of the neotropical malaria vector Anopheles nuneztovari. Genome, in press. Cruz Marques A 1986. Um estudo sobre a dispersão de casos de malária no Brasil. Rev Bras Malar D Trop 38: 51-75. Deane LM, Causey OR, Deane MP 1946. Studies on Brazilian anophelines from the Northeast and Amazon regions. I. An illustrated key by adult female characteristics for the identification of thirty-five species of Anophelini, with notes on the malaria vectors (Diptera, Culicidae). Am J Hyg Mono Series 18: 1-18. Faran ME 1980. Mosquito studies (Diptera, Culicidae) XXXIV. A revision of the Albimanus section of the subgenus Nyssorhynchus of Anopheles. Contr Amer Ent Inst 15: 1-215. Faran ME, Linthicum KJ 1981. A handbook of Amazonian species of Anopheles (Nyssorhynchus) (Diptera: Culicidae). Mosq Syst 8: 1-107. Farris JS, Kallersjo M, Kluge AG, Bult C 1995. Constructing a significance test for incongruence. Syst Biol 44: 570-572. Felsenstein J 1985. Confidence limits on phylogenies: an approach using the bootstrap. Evolution 39: 783-791. Goriup S, Pull JH 1988. Field research in the context of malaria control, p. 1741-1764. In WH Wernsdorfer, I McGregor (eds), Malaria: Principles and Practice of Malariology, Vol. 2, Churchill and Livings-tone, New York. Klein TA, Lima JBP, Tada MS, Miller R 1991. Comparative susceptibility of anophelines in Rondônia, Brazil to infection by Plasmodium vivax. Am J Trop Med Hyg 45: 463-470. Larson A 1994. The comparison of morphological and molecular data in phylogenetic systematics, p. 371-390. In G Schierwater, B Streit, GP Wagner, R DeSalle (eds), Molecular Ecology and Evolution: Approaches and Applications, Birkhauser, Verlag Basel/Switzerland. Linthicum KJ 1988. A revision of the Argyritarsis section of the subgenus Nyssorhynchus of Anopheles. Mosq Syst 20: 99-271. Lounibos LP, Nishimura N, Conn J, Lourenço-de-Oliveira R 1995. Life history correlates of adult size in the malaria vector Anopheles darlingi. Mem Inst Oswaldo Cruz 90: 769-774. Lunt DH, Zhang DX, Szymura JM, Hewitt GM 1996. The insect cytochrome oxidase I gene: evolutionary patterns and conserved primers for phylogenetic studies. Insect Mol Biol 5: 153-165. Perera OP 1993. Phylogenetic Analysis of Two Mitochondrial Genes from Several Species of the Subgenus Nyssorhynchus (Culicidae: Anopheles) and the Development of Species-specific DNA Probes for Their Identification, PhD Thesis, University of Florida, Gainesville, 110 pp. Peyton EL, Wilkerson RC, Harbach RE 1992. Comparative analysis of the subgenera Kerteszia and Nyssorhynchus of Anopheles (Diptera: Culicidae). Mosq Syst 24: 51-69. Rosa-Freitas MG, Broomfield G, Priestman A, Milligan JJM, Momen H, Molyneux DH 1992. Cuticular hydrocarbons, isoenzymes, and behavior of three populations of Anopheles darlingi from Brazil. J Amer Mosq Control Assoc 8: 357-366. Slatkin M 1985. Gene flow in natural populations. Ann Rev Ecol Syst 16: 393-430. Swofford DL 1993. PAUP: phylogenetic analysis using parsimony. Version 3.1.1. Illinois Natural History Survey, Champaign. WHO - World Health Organization 1992. World malaria situation in 1990. Bull WHO 70: 801-807. Copyright 1998 Fundacao Oswaldo Cruz - Fiocruz The following images related to this document are available:Photo images[oc98123a.jpg] |
| |||||||||