 |
| About Bioline | All Journals | Testimonials | Membership | News |
|
||||||
|
||||||
Mem Inst Oswaldo Cruz, Rio de Janeiro Can Remotely Sensed Meteorological Data Significantly Contribute to Reduce Costs of Tsetse Surveys? Guy Hendrickx/+, Ayitou Napala*, David Rogers**, Patrick Bastiaensen*, Jan Slingenbergh*** FAO Trypanosomosis project, GCP-RAF-347-BEL, Burkina Faso + Corresponding author: Fax: +226-973022. E-mail: trypfaso@fasonet.bfReceived 12 November 1998
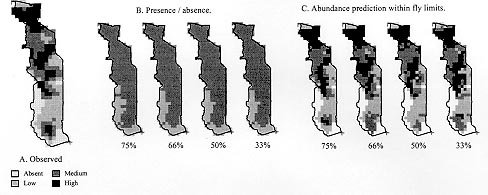
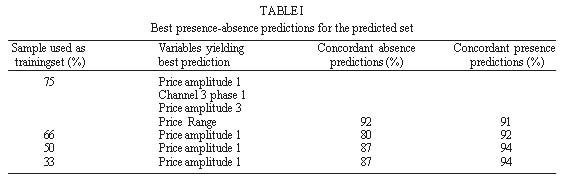
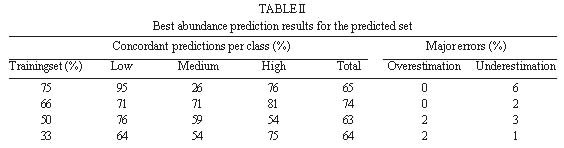
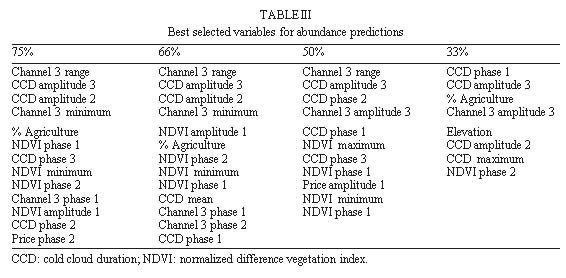
Code Number:OC99053 A 0.125 degree raster or grid-based Geographic Information System with data on tsetse, trypanosomosis, animal production, agriculture and land use has recently been developed in Togo. This paper addresses the problem of generating tsetse distribution and abundance maps from remotely sensed data, using a restricted amount of field data. A discriminant analysis model is tested using contemporary tsetse data and remotely sensed, low resolution data acquired from the National Oceanographic and Atmospheric Administration and Meteosat platforms. A split sample technique is adopted where a randomly selected part of the field measured data (training set) serves to predict the other part (predicted set). The obtained results are then compared with field measured data per corresponding grid-square. Depending on the size of the training set the percentage of concording predictions varies from 80 to 95 for distribution figures and from 63 to 74 for abundance. These results confirm the potential of satellite data application and multivariate analysis for the prediction, not only of the tsetse distribution, but more importantly of their abundance. This opens up new avenues because satellite predictions and field data may be combined to strengthen or substitute one another and thus reduce costs of field surveys. Keywords : abundance - discriminant analysis - Glossina tachinoides - prediction - remote sensing - Togo The negative impact of African animal trypanosomosis on African agriculture and economy does not need to be stressed here. A series of changing macro- and micro economical factors have induced, over the last decade, major changes in the development policy of donor and developing countries. Those include a tendency to favour mixed farming systems (i.e. integrating crops and livestock) and to transfer activities from the public to the private sector. Both existing constraints and changing development policies stress the need to identify priority areas where focused efforts towards integrated disease management will have a maximum impact on the development of those mixed farming systems. To identify those priority areas a good knowledge of the spatial epidemiology, sensu largo, of dominant pathologies is essential. This knowledge has to be obtained through field studies, which are often expensive in terms of cash, personnel and time. Such a detailed multivariate database has been established in Togo (Hendrickx & Napala 1998). A next step is to explore ways to reduce costs involved. One way might be to combine results of partial surveys with (cheaper) remotely sensed data using multivariate analysis techniques in order to produce reliable predictions of vector or disease occurrence. To achieve this goal two major types of remotely sensed data are currently at our disposal: A first type includes SPOT (Satellite pour l'observation de la terre) and Landsat imagery with a high spatial (10 to 30 m) but low temporal resolution (26 and 16 days). These data allow very detailed spatial studies such as described by de la Rocque (1997) during this conference or Kitron et al. (1996) in Kenya and are used, on a larger scale for a variety of purposes: thematic mapping, landuse maps, soil degradation studies etc. Unfortunately this type of imagery remains expensive. A second type includes NOAA (National Oceanic and Atmospheric Administration) and Meteosat imagery with a lower spatial (1 to 7 km) but high temporal resolution (respectively 12 and 0.5 hr). This type of data is more suitable for our purpose. Applied to tsetse they have mainly been used to predict vector distribution (e.g. Rogers & Randolph 1993, Robinson et al. 1997) and to describe vector abundance (Hendrickx et al. 1993, Rogers et al. 1994, 1996). The aim of this paper is to illustrate our contribution to the development of such an operational approach, combining field surveys and NOAA and Meteosat data, to predict the distribution and abundance of Glossina tachinoides in Togo. MATERIALS AND METHODS The sampling area - Togo is a narrow (max. 135 km) West African country at the Golfe de Guinée between Ghana and Benin. It stretches from 6°10'N to 11°10'N and has a total surface of about 56 000 km2. Its location makes it an ideal transect representative of a variety of eco-climatic conditions of coastal West Africa. To facilitate geo-referenced data gathering the country was divided in 311 sampling units (squares with 0.125-degree sides). The dependant variable - Tsetse surveys, using standard bi-conical traps (Challier et al. 1977), covered in a first phase, 1990-92, the major part of the country. In a following phase, 1993-95, they were mainly concentrated on the known limits per fly species and on gaps left after the first survey. Survey sites were selected using 1:200,000 maps. On the field, mobile teams selected the most suitable tsetse habitats per survey site and sampled them with a minimum of 5 (average of 12) traps over a period of 24 or 48 hr. No odours were used. A total of 653 different survey sites were sampled in 305 of the 311 sample units. Data processing is explained and discussed in detail in Hendrickx and Napala (1998). After log10 transformation, raw data were corrected for the seasonal variation occurring in the database. To address the problem of false negatives, data were pooled within defined fly-limits using a 3X3 rolling mean pattern; i.e. every sample unit is the average value of itself and its 8 surrounding squares. For the purpose of this study an abundance map of G. tachinoides was generated using four density classes: zero, low, medium and high. The limits between the three last classes were chosen to allow an approximately equal number of sample units per class. The independent variables - Satellite data include three NOAA and one Meteosat derived variable. The NOAA data are: (i) the Normalised Vegetation Index (NDVI), a measure of the active vegetation biomass (Tucker et al. 1983); (ii) the Price thermal brightness index (Price 1984), a surrogate of the variation of ground temperature and (iii) the AVHRR (Advanced Very High-Resolution Radiometer) Channel 3 value, recently shown to be one of the better predictor variables of landcover type in Nigeria (Rogers et al. 1997). In addition, the last variable used is the Cold Cloud Duration (CCD), from Meteosat. It is derived from the measured cloud-top temperatures. In West Africa cloud-top temperatures between -30 and -60°C have been related to ground measures of rainfall (Snijders 1991). Data used are the monthly images from 1988 to 1990, except for CCD where data available covered 1989 to 1991. To reduce the size of the data base and extract seasonal information, variables were subjected to a Fourier time series analysis. The resulting phases and amplitudes of the annual, bi- and tri-annual cycles were included in the analysis, as were the calculated average values, minima, maxima and range. Some ground-measured data were added to the data bank: percentage agriculture, annual rainfall, number of dry months (rain < 30mm), maximum ground temperature and elevation. The multivariate analysis approach - Multiple discriminant analysis is the most appropriate technique of multivariate analysis when the dependant variable is divided in more than two classes and the independent variables follow a metrical scale. First predictor variables are ranked per case to produce the best discriminating set of variables, then selected variables are used to compute discriminant functions and predictive maps of fly abundance are produced. To validate the obtained discriminant functions the total sample is divided in two sub samples. The first sub sample, called the analysis sample or trainingset, is used to rank the variables and compute the discriminant functions. The second sub sample, called the holdout sample or predicted set, is used to validate the computed functions, i.e. to produce "true predictions" based on the information contained in the analysis sample. This approach de facto offers the opportunity to simulate results obtained combining field surveys (analysis sample) and extrapolations (predictions made of the holdout sample), the purpose of this study. Sub samples were selected at random per identified seasonal cluster (Hendrickx & Napala 1998), assuming no prior knowledge of fly occurrence. The analysis was repeated with respectively 75%, 66%, 50% and 33% of the sample selected as analysis sample. Best results were obtained separately predicting fly presence-absence and fly abundance. Resulting maps are shown for best predictions. RESULTS Maps given show a satisfactory overall fit, including the results obtained with a 33% analysis sample. It is remarkable to note that a single variable, Price index amplitude 1 (ground temperature variation) is able to predict the distribution of G. tachinoides except for a rather uniform underestimation of 1 square, i.e. 13.6 km. Within fly limits temperature plays no role predicting abundance. The average values of the predictor variables per class (not given here) reflect a biological reality the fly being more abundant in a drier environment and in areas with lower agricultural pressure (Tables I, II,III). TABLE I: Best presence-absence predictions for the predicted set TABLE II: Best abundance prediction results for the predicted set TABLE III: Best selected variables for abundance predictions DISCUSSION In this type of approach the acceptability of the obtained precision levels depends on what one is prepared to pay to obtain the desired accuracy. From the point of view of selecting high, medium or low priority areas for control an overestimation of the tsetse problem might induce unnecessary costs and underestimating it might result in unidentified priority areas. In our case an average of 4% of this type of errors is considered acceptable. The relatively limited number of sample units for Togo (n = 311) did not allow us to test results below a 33% coverage of the country surveyed. It thus remains to be tested if a smaller proportion of a bigger area retains enough variability to allow satisfactory abundance predictions of the total area. Another aspect that will also have to be taken into consideration is that with a decreasing proportion of sample units surveyed it might be necessary to increase the sampling intensity within each sampled unit. ACKNOWLEDGEMENTS To K Adomefa, D Batawui, B Dao, R De Deken, M Denke, N Doumandji and P Marchot for their permanent help and support. Work presented was conducted within the framework of the Belgian funded, FAO executed, project GCP-TOG-013-BEL. This publication also arises in part from funding provided by the Department for International Development (DfID), UK (Livestock Production Programme ZC0012, to DJR). However, the FAO nor DfID can accept responsibility for information provided or views expressed. REFERENCES Copyright 1999 Fundacao Oswaldo Cruz - Fiocruz The following images related to this document are available:Photo images[oc99053d.jpg] [oc99053b.jpg] [oc99053a.jpg] [oc99053c.jpg] |
| |||||||||