 |
| About Bioline | All Journals | Testimonials | Membership | News |
|
||||||
|
||||||
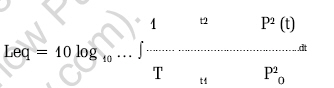
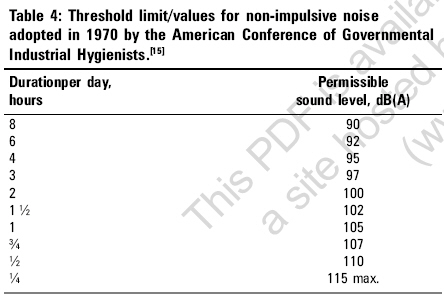
Indian Journal of Occupational and Environmental Medicine, Vol. 10, No. 3, September-December, 2006, pp. 133-139 Original Article Assessment of noise level of a medium scale thermal power plant Kisku GC, Bhargava SK Environmental Monitoring Division, Industrial Toxicology Research Centre, MG Marg, Post Box No. 80, Lucknow - 226 001, UP" Code Number: oe06032 Abstract Noise monitoring using "Cirrus sound level" was carried out for 30 min at a height of 1.5 m and 1 m away from the chest during October, 2002 covering 73 locations of ~781 MW power plant. Event Leq and LN cycle were studied to identify the noisy machines and to generate baseline data. Lowest avg. noise 70.37 dB(A) was found at control room while the highest avg, 95.91 dB(A) at F. D. Fan with average 88.04± 6.08 dB(A). Compressors generate second highest noise, 89.98 dB(A). Operators of F.D. Fans are having a fare chance of exposure with >90 dB(A) i.e., beyond the prescribed standard. Noise may not jeopardize employee's life immediately but might be the cause of neurobehavioral change, psychological stress and unhappiness in daily life without showing the symptoms of chronic /acute diseases. Measured data has been compared with TLV of American Conference of Governmental Industrial Hygienists. The quality of life of industrial worker is one of the prime factors for production; hence it should not be neglected. Revision of occupational Indian noise standard is recommended at par with International / European standards. Noise-reducing options are also described. This investigation may help the implementing authority to adopt better policy for better work environment.Keywords: Acoustic treatment, health hazard, noise measurements, thermal power plant Introduction Life is powered by the coal-fired thermal power plant that contributes 72% (72000 MW) of the total power generation (104917 MW) in India. The share of hydel power is around 25-30% (25000 MW) while the rest 3-5% is due to nuclear power and wind resources.[1] Thermal power plant is one of the noisiest factories. Ambient air monitoring, stack emission monitoring, water and effluent testing are mandatory to compliance the needs of pollution control board to run the industry. Many industrial authorities as well as pollution control boards do not give due weightage to the problem of noise pollution because it does not jeopardize employee′s life immediately after exposure. However, prolong exposure to industrial noise can′t be neglected which may be the cause of neurobehavioral change, psychological stress and unhappiness in daily life without showing the symptoms of chronic / acute diseases.[2] Since, the ears have no natural device to check or protect it from noise, it has no option but to receive all the sound that strikes the eardrum. In industry, excessive noise exposure can cause both auditory and extra-auditory effects. The most important of these is hearing damage resulting from prolonged exposure to excessive noise.[3] Another undesirable effect is speech interference or interruption of communication. Annoyance is a third undesirable effect of noise.[4] The damaging effect on hearing depends on (1) the level and spectrum of the noise, (2) duration of exposure, (3) how many times it occurs per day, (4) over how many years daily exposure is repeated, (5) the effects on hearing regarded as damage and (6) individual susceptibility to this type of injury. At first, excessive exposure to harmful noise causes auditory fatigue or a temporary threshold shift (TTS). However, repeated insults of excessive noise can transform this TTS into a permanent threshold shift. Auditory effects like noise-induced hearing loss can happen unnoticed over a period of years. The extra-auditory effects of noise result in physiologic changes other than hearing. Laboratory studies have shown that noise reduces efficiency on some tasks, can upset the sense of balance and can cause blood vessels to constrict, raising blood pressure and reducing the volume of blood flow. It causes the pupils of the eyes to dilate. Even when we are sleeping, noise can cause changes in electro-encephalograms and blood circulation without waking us. It can also cause fatigue, nervousness, irritability and hypertension and add to the overall stress of living.[5],[6],[7],[8],[9],[10],[11] The prime objectives of this present study is to identify the major sources/noise producing machines of the thermal power plant, to generate baseline data with regard to different machines and to assess the possible health effect on the workers working in the high noise zone based on the threshold limit of American Conference of Governmental Industrial Hygienists. Geographical position of the plant A 781 MW plant is in Sonebhadra (latitude 24o 10′- 24o 12′N and longitude 82o 46′-82o48′ E) in Uttar Pradesh, located besides the Varanasi - Shaktinagar Highway, ~15 km from Shaktinagar and 5 km from Anpara Railway Station in a remote semi-industrial developed and coal mine area. Rihand reservoir is the only surface water body flowing from North- East to South-West direction, guarded by rocky hilly terrains and fly ash bund. Hill slopes are generally covered with thin vegetation. The plant has the plant load factor> 88 which is exceptionally high in comparison to average national plant load factor. Characteristics and transportation of raw material Coal is the raw material of a thermal power plant transported through aerial rope ways and dumpers from the adjacent Jhingurda mine of Singrauli coal belt of Northern Coal Ltd. The last five year figures of coal consumption ranged between 35-45 MT. Coal, moisture content 15-18%, ash 32-41%, volatile carbon 19-23%, fixed carbon 21-27% and caloric value 2800- 3400 kcal/kg. Electricity generation process The coal chunk is brought from the mine to unloading station of coal handling plant and ultimately passes to crusher house for sizing. The coal then passes to open storage and coal bunkers in the plant, which feed coal to mills for pulverization process. Pulverized coal is fed directly into the boiler through forced draft fan. Demineralized water (DM water avoids scaling/ corrosion in the boiler which reduce the efficiency) is used as make-up water for the power cycle. Pressure of the steam generated in the boiler is increased by air compressors that rotate the turbine and converts mechanical power to electrical energy with the help of a device called Alternator. Methodology Of Noise Measurements And Monitoring Locations Survey techniques Cirrus sound level meter, model 236 A, UK make sensitive to sound pressures between 20 and 20000 Hz was used to measure the noise level. Calibrated instrument was transported in a brief case containing sponge groove that protect from vibration and shock. The range and sensitivity of the instrument is 32-140 dB(A) with accuracy ± 5%.[12] The noise level was recorded at a distance of 5-10 feet on the basis where cumulative noise was expected from different sources or at operator. Monitoring was done at a height of 1.5 m and 1 m away from the chest for 30 min at an interval of 15 s. Principles of Leq The short Leq (equivalent continuous sound level) concept was proposed by Komorn and Luquet.[13] Leq is the level which, if maintained constant for the same period as the measurement, would contain the same amount of energy as the fluctuating noise level. It is measured directly by an integrating averaging sound level meter. It is a linear integration over time. The formula used for leq calculation is given below in the form it appears in the international standard IEC 804.
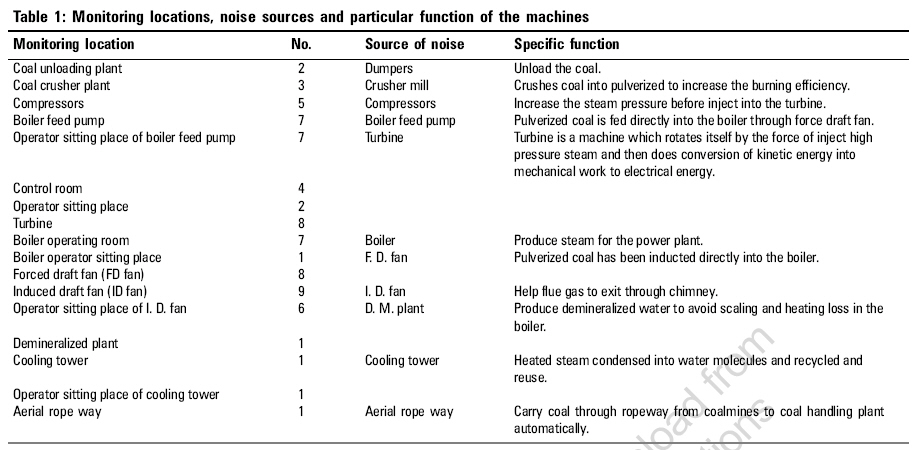
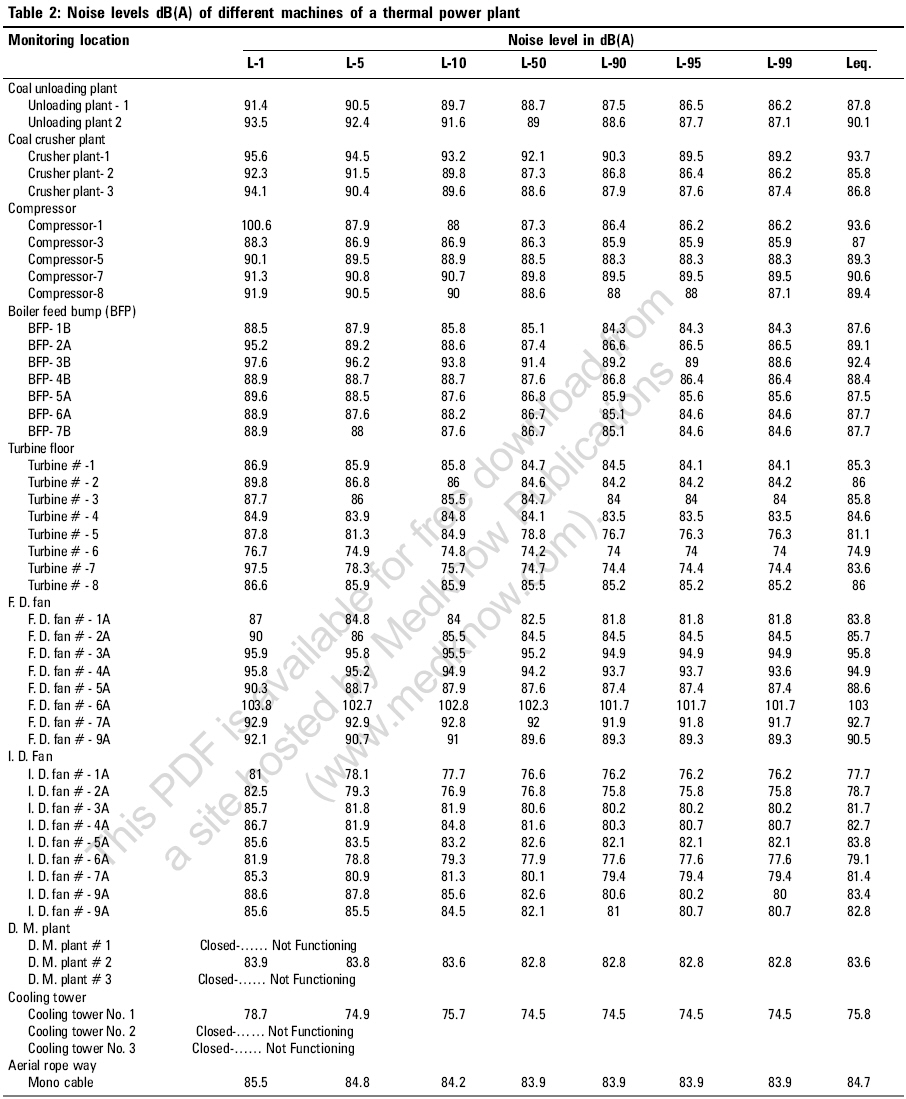
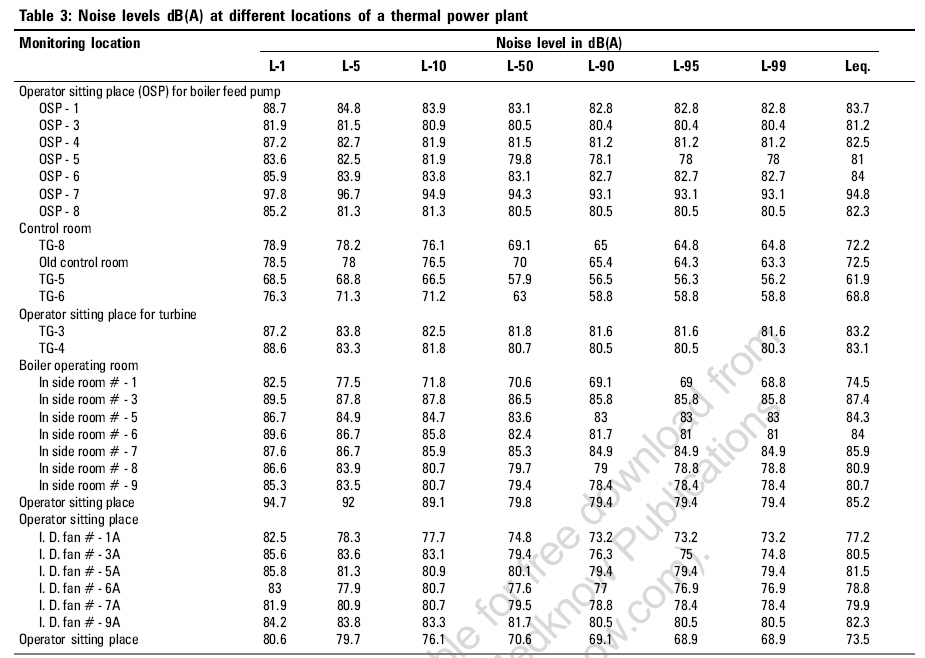
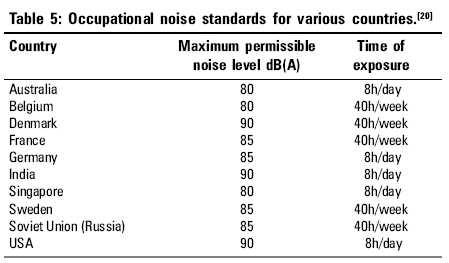
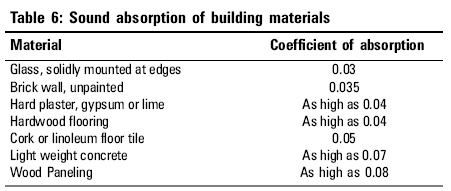
Where T.... is the total measurement time. PA (t) ... is the A-weighted instantaneous acoustic pressure. and Po ....is the reference acoustic pressure (20 µ PA). Leq is used as the basis for calculating L DP (day-night average sound level) and LNP (noise pollution level). Among A-weighting (ears response to sounds near the 40 dB level), B-weighting (near 70 dB), C-weighting (near 100 dB) and D-weighting (jet plane noise) measuring scales, the A-weighting is the commonly used scale to measure steady sound levels.[14] Monitoring locations After primary walk through the survey, 73 locations of plant area had been identified based on the maximum sound pressure for noise measurements. These locations are shown in [Table - 1] along with short description of the noise sources and the specific function of the noise source/machines. These are coal unloading plant-2, coal crusher plant- 3, compressor - 5, boiler feed pump-7, operator sitting place for boiler feed pump-7, control room-4, operator sitting place-2, turbine -8, boiler operating room-7, boiler operator sitting place-1, F. D. fan-8, I. D. fan-9, operator sitting place of I. D. fan-6, D. M. plant-1, cooling tower-1, operator sitting place for cooling tower-1, aerial rope way-1. Besides the above major sources which contribute ~80 % noise, the remaining noise might be attributed to the background noise generated from incoming /outgoing vehicles, servicing and repairing, minor construction, office work etc. Results And Discussion The observed noise levels recorded during survey work for different machines and locations are presented in [Table - 2][Table - 3] respectively. SLM recorded noise in the form of Event Leq and L N cycle. L N cycle represents that N% of the time, the noise level was below the given value of X viz. Compressor No. 1: L-1 represents that 1% of the measured time the noise level was above 100.6 dB(A) and L-99 represents that 99% of the measured time the noise level was below 86.2 dB(A) [Table - 2]. Coal unloading plant Among the two coal unloading plants, minimum Leq, 87.8 dB(A) was recorded near unloading plant-1 and while the maximum Leq, 90.1 dB(A) was recorded near unloading plant-2 with an log average Leq 89.10±1.63 dB(A) [Table - 2]. Coal crusher plant The minimum Leq, 85.8 dB(A) was found at crusher plant-2 while the maximum Leq, 93.7 dB(A) was found near crusher plant-1. The log average. Leq of crusher plants was 90.28±4.30 dB(A) which is higher than the prescribed standard of 90 dB(A) [Table - 2][Table -4]. Compressor noise The minimum event Leq, 87 dB(A) was recorded near Compressor-3 and while the maximum event Leq, 93.6 dB(A) was recorded near compressor-1 with log average Leq. 90.54±2.41 dB(A). All the compressors were producing noise level which touches the maximum permissible limit of 90 dB(A) for 8h. Especially compressor-1 showed levels beyond the maximum permissible limit of 90 dB(A) for 8h /day. [Table - 2]. Compressors generated second highest log. average Leq 89.98 dB(A) noise level after the F.D. Fan with log average Leq 95.91±6.15 dB(A) [Table - 2]. These data do not fall in the safe zone for occupational environment; out of 5 compressors; 2 were producing beyond the permissible limit of 90 dB(A) [Table -4]. Boiler feed pump (BFP) The minimum event Leq, 87.5 dB(A) was recorded near BFP-5A and while the maximum event Leq, 92.4 dB(A) was recorded at BFP-3B with log average Leq 89±1.76 dB(A) [Table - 2]. All the BFPs were producing noise level which touched the maximum permissible limit of 90 dB(A), especially; BFP-3B showed beyond the maximum permissible limit of 90 dB(A) for 8h/day. Turbine The noise level found between 74.9-86.0 dB(A) with log average Leq 83.41±3.82 dB(A). The lowest was measured for turbine No. 6 while highest for turbine No. 2 and 8. Turbine sound pressure is lesser than F.D. fan, boiler feed pump but higher than I. D. fan and cooling tower. It produced almost equivalent sound pressure of DM plant and aerial rope way [Table - 2]. F. D. fan The minimum event Leq, 83.8 dB(A) was recorded for F.D. fan No. 1A and while the maximum event Leq, 103 dB(A) was recorded for F. D. Fan No. 6A. with log average Leq 95.91±6.15 dB(A). F. D. Fans were the noisiest one among the power plants. F. D. Fan Nos. 2A, 3A, 4A, 5A, 7A and 9A produced noise level of about 85.7, 95.8, 94.9, 88.6, 92.7 and 90.5 dB(A) respectively [Table - 2]. I. D. fan The minimum event Leq 77.7 dB(A) was recorded for I.D. fan No. 1A while the maximum event Leq, 83.8 dB(A) was recorded for I. D. fan No. 5A with log average Leq 81. 71±2.22 dB(A). I.D. fan is comparatively better than F. D. fans in terms of noise level [Table - 2]. D. M. plant, cooling tower and aerial rope way (Mono cable) The level of noise of D.M. plant was 83.6 dB(A). The event Leq of cooling tower was 75.8 dB(A), which was quite calm w.r. t. others. At operator sitting place for cooling tower, the noise level was felt 73.5 dB(A). The noise level of aerial rope way (Mono cable) was 84.7 dB(A) [Table - 2]. Operator sitting place (OSP) for boiler feed pump The minimum event Leq, 81 dB(A) was recorded at OSP-5 and while the maximum event Leq, 94.8 dB(A) was recorded at OSP-7 with log average Leq 87.69±4.80 dB(A). All the noise levels measured in these places were ³81 dB(A). The operator seated at OSP-7 position was exposed to noise level beyond the permissible limit of 90 dB(A) [Table - 3]. Control room The noise level ranged between 61.9-72.5 dB(A) with log average Leq 90.37±4.93 dB(A). The least sound 61.9 dB(A) was felt at control room No. TG-5 while the maximum sound, 72.2 dB(A) at TG-8 [Table - 3]. OSP for turbine, TG-3 and TG-4 The noise level range in between 83.1-83.2 dB(A) with log average Leq 83.15±0.07 dB(A). The least sound 83.1 dB(A) was felt at TG-4 while the maximum sound, 83.2 dB(A) at TG-3 [Table - 3]. Boiler operating room (BOR) and OSP The minimum event Leq, 74.5 dB(A) was recorded at BOR No. 1 while the maximum event Leq, 87.4 dB(A) was recorded at BOR No. 3 with log average Leq 83.92±4.30 dB(A). However, the noise level at operator sitting place was as high as 85.2 dB(A) [Table - 3]. OSP for I. D. fan The noise level varied from 77.2-82.3 dB(A) with log average Leq 80.34 dB(A). The minimum 77.2 dB(A) was found at OSP-1A and maximum 82.3 dB(A) at OSP-9A [Table - 3]. Descending order of L N cycle is L-1> L-5 >L-10> L-50> L-90 >L-95> L-99, Leq does not show any particular position in the L N cycle. There is a much fluctuation among locations and different machines and also among same machine like ID fans, FD fans and compressors etc. The overall noise was 70.37-95.91 dB(A) with log average 88.04±6.08 dB(A). Though it is below the prescribed standard but this level may be sufficient exposure to create a chronic health hazard problem after long exposure, since the subject exposed to high noise level may come out from the noise source after his duty hours but the physiological change and psychological stress occurred in his system. For the operator who is looking after the F.D. fans, there is a fare chance of exposure to> 90 dB(A) noise. Forty one per cent of bus drivers suffered from noise-induced deafness,[16] while 50% of the workers in an ammunition factory had impaired hearing.[17] Similarly high prevalence of hearing impairment was detected in the workers of a nitric acid plant.[18] There is 80.6% prevalence of noise-induced hearing loss in the workers of petroleum industries.[19] However, there is no unsteady / impulse noise in the power plant which affect more adversely than steady noise. Indian noise standards are also high than the standards for other countries.For example, the working hours in Belgium, Denmark, France, Sweden and Soviet Union (Russia) are 40 h/week but in case of India there are six working days in a week, so the total exposure hours are 48h/week [Table - 5]. Hence, revision of the standard is required at par with the international/ European standard. Recommendations Green belt design (GBD) A wide green belt of thick vegetation can be produced around the factory premises. This will absorb to a large extent and dissipate sound energy and thus act as buffer zone.[21] A tree belt 50 m wide and of different height can reduce the noise level up to 20-30 dB(A).[22] GBD will reduce the noise intensity by creating obstruction in its transmission path. In addition, it can decrease substantial amount of the air pollution load. Vegetation plays a positive role for our eyesight potential and GBD also regulates the temperature through transpiration. GBD also purifies the atmosphere to a significant level by utilizing CO 2 produced in the power plant and releasing O 2 during photosynthesis and enhances the aesthetic beauty. Sound absorbing material Noise pollution should not be neglected since production in a factory depends on the individual health of the employees. Outer surfaces of control room should be covered with sound absorbent material e.g., glass wool covered with perforated aluminum sheet. Glass wool is of different types and has different density. Higher the density, more is the absorbing capacity. This has practically been done in a research laboratory to reduce the noise level. However, glass wool has been banned in USA/E.U. for non-essential uses. Multiple wall construction with enclosed air spaces, provides considerably more attenuation than the single-wall mass law would predict.[22] The absorptivity or coefficient of sound absorption is equal to that percentage of the incident sound, which is not absorbed. [Table - 6] lists typical coefficient of absorption for some building materials. These hard materials absorb only a few percent of the sound striking them. They can be good sound barriers, since they do not allow the passage of air and can be stiff and massive enough to be effective. Fabrication of new engines Noise can be controlled by designing and fabricating new engines and by setting a noise limits at least 5-10 dB(A) below the prescribed standard.[16] Transmission control may be achieved by covering room walls with acoustic tiles as sound absorbers. Supply of earplug, earmuff and cotton/ woolen to its employees help in protecting exposed person. Preferably, shifting of duty from equipment to another on alternate days as not to operate same equipment every day. Normal duty hours can be reduced at high noise generating sources. Isolated cabin is required for operator where it is not available. Employees must be made aware and educated about noise nuisance through adequate publicity. The irregular use /not use of safety measures are a common scenario in most of the industries where rules and regulations are liberal hence authority can make it mandatory to use one or other type of noise protective measures at noisy places. Conclusion This current investigation may help power plant authorities to adopt preventive measures and for deciding future strategies to combat the menace of noise pollution with scientific approach. This will ensure in providing better environment to the employees. Occupational health hazards have to be assessed by an expert agency, which also correlates noise pollution and health hazards. Science and technology have not reached up to the level by which soundless machine can be made but the preventive measures could be adopted for prevention, abatement and control of substantial amount of noise level.References
Copyright 2006 - Indian Journal of Occupational and Environmental Medicine The following images related to this document are available:Photo images[oe06032t2.jpg] [oe06032t1.jpg] [oe06032t3.jpg] [oe06032t6.jpg] [oe06032t4.jpg] [oe06032t5.jpg] |
| |||||||||
