 |
| About Bioline | All Journals | Testimonials | Membership | News |
|
||||||
|
||||||
Braz J Oral Sci, Vol. 9, No. 3, July-September, 2010, pp. 351-357 Cariogenic and erosive potential of industrialized fruit juices available in Brazil Leopoldina de Fátima Dantas de Almeida1, Gisely Maria Freire Abílio2, Mônica Tejo Cavalcante3, Ricardo Dias Castro4, Alessandro Leite Cavalcanti5 1Undergraduate student, School of Dentistry, Federal University of Paraiba, Joao Pessoa, PB, Brazil Correspondence to: Alessandro Leite Cavalcanti, Avenida Manoel Moraes, 471/802 - Manaíra, 58038-230 João Pessoa, PB, Brasil, Phone: +55 83 3315-3326 E-mail: dralessandro@ibest.com.br Received for publication: December 03, 2009 Code Number: os10034 Abstract Aim: This in vitro study evaluated the cariogenic and erosive potential of different
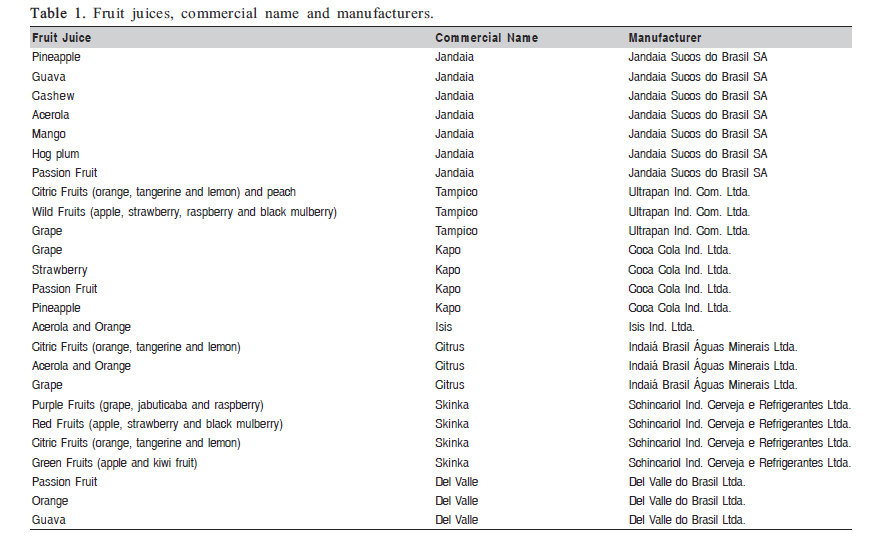
industrialized fruit juices available in the Brazilian market. Keywords: beverages, hydrogen-ion concentration, dietary sucrose, dental caries, tooth erosion. Introduction Important innovations in the fruit juice industry in the last 100 years have included the use of pasteurization and the introduction of juice concentrates1. Fruit juices are products defined as liquids obtained by expression or extraction of ripe fruit, by means of adequate technological processes and with characteristic color, aroma and flavor2. In general, juice drinks contain between 10 and 99% juice and added sweeteners, flavors and sometimes fortifiers, such as vitamin C or calcium. These ingredients must be listed on the label, according to the US FDA regulations3. The Brazilian legislation for foods is ruled by the Ministry of Health's National Health Surveillance Agency (ANVISA) and by the Ministry of Agriculture, Cattle Raising and Food Supply (MAPA). Ready-to-use fruit juices should fulfill the MAPA's requirements with respect to the definition, classification, registration, standardization, labeling and quality demands, as well as the ANVISA's requirements with respect to labeling of packed food, namely main nutritional information, portions, complementary nutritional information and information on the presence of gluten in the product4-6. The desirability of a healthful lifestyle has led to an increased consumption of juices. Fruit juice intake by children aged 1 to 6 years should be limited to 118-177 mL per day7. However, over 10 percent of American preschoolers consume at least 350 mL of fruit juices daily7. A combination of infant/child feeding practices and repeated sequential consumption of fermentable carbohydrates, such as sweetened beverages, highly processed starchy/sugary foods or acidic beverages, increases the mineral loss of dental tissues8-9. The titratable acidity and a low pH are related to erosive lesions; and all these factors plus sugar content are involved in the development of carious lesions. A pH of 5.5 is traditionally considered to be the `critical pH' for enamel dissolution, although mineral loss may begin at higher pHs10. The most common cause of dental erosion in young people is the consumption of acidic beverages such as carbonated sports drinks and fruit juices. These have been reported to be associated with severe loss of dental enamel, particularly when consumed during periods when there is low salivary flow, such as immediately after heavy sports activities11. Recently, there has been increased interest in determining some physical and chemical properties of fruit juices, such as endogenous pH12-14, titratable acidity (TA)15-16, total soluble solid content (TSSC) or degrees Brix (oBx)17 as well as their effects on dental biofilm18. The acidity of a composition may be expressed in terms of TA, which is a measure of the percent weight of acid present in a solution as calculated from the volume of sodium hydroxide (NaOH) or potassium hydroxide (KOH) required neutralizing the acidic species. In practice, TA is measured potentiometrically with a standardized NaOH or KOH solution of a known concentration at 20oC19. Soluble solids are compounds that are mixed or dissolved in the fruits, and are mainly formed by sugars, which give a sweet flavor, and acids, which give a sour taste. The Brix scale or oBx is numerically equal to the percentage of sugar and other solids dissolved in the solution. The food industry uses this scale for measuring the approximate amount of sugars in fruit juices and other beverages. Thus, a solution that is 25 degrees Brix has 25 g of sugar per 100 mL of solution20. Sugars may be classified as reducing or non-reducing based on their reactivity with Fehling's reagents. Sugars that contain aldehyde groups that are oxidized to carboxylic acids are classified as reducing sugars (e.g. glucose, fructose, maltose, lactose). Those that are unable to reduce the above oxidizing agents are called non-reducing sugars (e.g.: sucrose). Fruit juices are examples of foods that contain a mixture of these three soluble sugars (fructose, sucrose and glucose), with the concentration varying according to the type and maturation status of the fruit. Such sugariness, coupled with an acidic nature, has caused fruit juice to be cited as a risk factor dental decay. In view of the high consumption of fruit juices among Brazilian children13 and the lack of international studies addressing this subject, the purpose of this study was to evaluate in vitro the cariogenic and erosive potential of different industrialized fruit juices available in the Brazilian market by assessing some physical and chemical parameters of these products. Material and methods Determination of endogenous pH, TSSC, TA and sugar levels was undertaken in samples of 25 industrialized fruit juices commercialized in the city of Joao Pessoa, PB, Brazil. The products were selected according to their availability in the market (Table 1). Each analysis was made in triplicate. Data were collected by a single calibrated examiner, recorded on study-specific charts. pH Measurement The pH of each juice was determined using a pH meter (TEC-2 pH meter; Tecnal, São Paulo, SP, Brazil) placed directly into each solution. The pH meter accurate to 0.1 was first calibrated according to the manufacturer's instructions, employing buffer standards of pH 7 and pH 4. Twenty milliliters of each pure beverage was placed in a beaker, the pH meter electrode was immersed in the juice and the reading was recorded12. Between readings, the electrode was rinsed in distilled water to ensure that no cross-contamination occurred. Degrees Brix (oBx) The oBx readings were made by refractometry using an Abbe refractometer (PZO-RL1, Warsaw, Poland). As the refractive index of a sugar-containing solution is also temperature-dependent, refractometers are typically calibrated at 20oC12. The equipment was calibrated with deionized water (refraction index = 1.3330 and 0º Brix at 20ºC) and the readings of the samples were performed (oBrix or g/100mL)12. Titratable Acidity (TA) TA was measured according to the method adopted by the Association of Official Analytical Chemists21, that is, the amount of 0.1 N KOH solution needed for the product to reach a neutral pH or a pH value above it. A 10 mL aliquot of the diluted product was titrated (10% solution of the sample) with the 0.1 N KOH solution until the substance reached a pH value between 8.2-8.4, corresponding to the endpoint of the phenolphthalein. Readings were done with a pH meter (TEC-2R; Tecnal, São Paulo, SP, Brazil). When this value was reached, the spent KOH volume was recorded and the acidic percentage of the substance was calculated using the following equation, with the result being expressed as percentage of citric acid. Acidity (%citric acid) = V x Nap x F x meq-g(citric acid) x 100
Where: V = KOH volume; Nap = Normal concentration of the KOH base; F = Normality correction factor; meq-g = miliequivalent per gram of citric acid; Sample= volume of the medicine. Reducing sugars, non-reducing sugars and total sugars Reducing sugars (e.g.: glucose), non-reducing sugars (e.g.: sucrose) and total sugars were measured according to the method adopted by the Association of Official Analytical Chemists21 and the results were expressed in g/mL. Reducing sugars The measuring unit for reducing sugars is expressed as gram of glucose per 100 mL of the sample. For determination of this type of sugar, 5 mL of each sample were diluted in 50 mL of distilled water. The resulting solution was heated in water bath for 5 min and, after cooling and filtering, its volume was completed to 100 mL with distilled water. Next, 10 mL of the Fehling solution were mixed with 3 drops of 1% blue methylene (Vetec®, Rio de Janeiro, RJ, Brazil). This mixture was titrated under warming blanket with the previously prepared sample solutions until the reducing sugars present in the sample reduced completely the Fehling solution, as demonstrated by color change from blue to colorless, and by the formation of a brick red precipitated. The percentage of reducing sugars was calculated using the following equation: % of reducing sugars in glucose = 100 x V x Cf
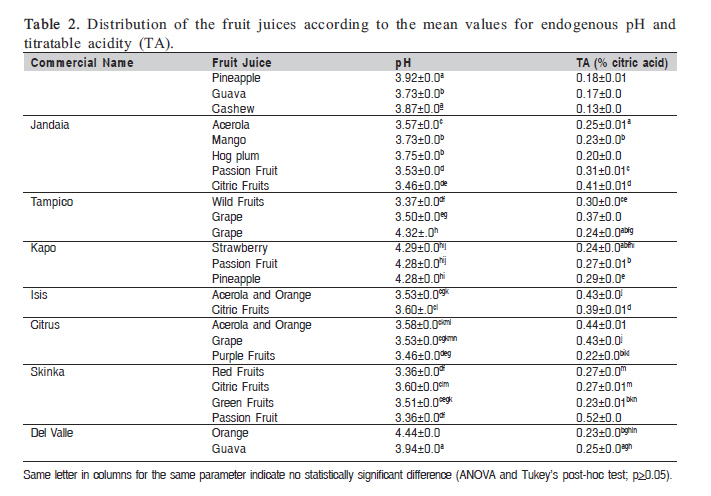
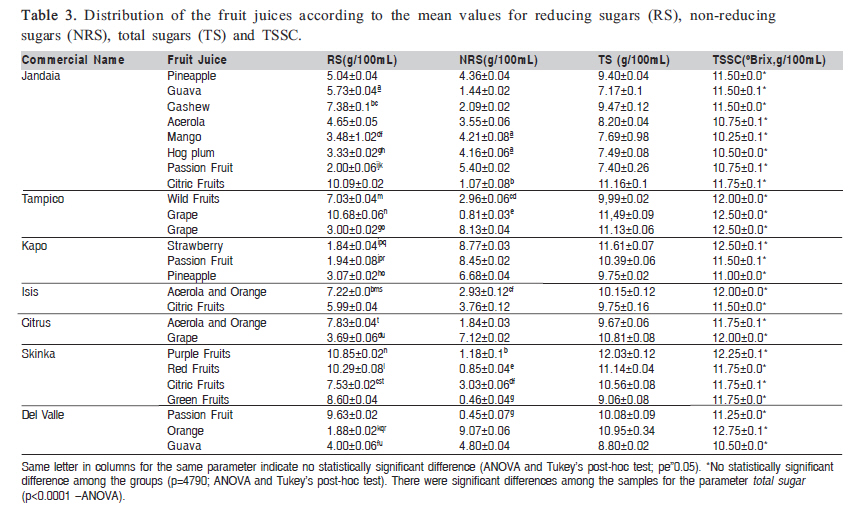
V = Volume (mL) of the sample solution Cf = Calibration factor of the Fehling solution Sv = Volume of the sample used for preparation of the solution Tv = Volume of the sample solution used in the titration Total sugars In this analysis, the non-reducing sugars were subjected to acid hydrolysis with hydrochloride acid (Vetec®, Rio de Janeiro, RJ, Brazil). These sugars were converted into reducing sugars, which were further subjected to titration and reduced the Fehling solution, according to the same method used for determination of reducing sugars. The results were expressed as grams of sugars per 100 mL of sample. Non-reducing sugars The non-reducing sugars were estimated by subtracting the reducing sugars from the total sugars and multiplying this value by the conversion factor of glucose in sucrose (0.95). The results were expressed as grams of sucrose per 100 mL of sample. Statistical Analysis All recorded data were analyzed with the software GraphPad Prism version 5.0. Data were statistically analyzed by ANOVA and Tukey's post-test. The significance level adopted was 5% for all statistical analyses. Results The results of the physical and chemical parameters varied among the evaluated brands of juices. Table 2 displays the distribution of pH and TA mean values for the tested fruit juices. All fruit juices showed pH below the critical value of 5.5, with significant differences among the samples (p<0.0001). The pH values ranged from 3.36 (passion fruit/Del Valle®) to 4.44 (orange/Del Valle®). Mango juice (Jandaia®) presented the lowest TSSC (10.25 oBrix), while orange juice (Del Valle®) presented the highest TSSC (12.75 oBrix), with no significant differences among the groups (p>0.05). The lowest TA value was recorded for cashew juice (Jandaia®) (0.13%) and the highest TA value was recorded for passion fruit (Del Valle®) (0.52%), with significant differences among the samples (p<0.0001). Table 3 displays the distribution of reducing sugars, non-reducing sugars and total sugars mean values for the tested fruit juices. For the reducing sugars, the highest value was recorded for purple fruit juice (Skinka®) (10.85 g/100mL) and the lowest value was recorded for strawberry juice (Kapo®) (1.84 g/100mL). With regards to non-reducing sugars, the values ranged from 0.45 g/100mL (passion fruit/Del Valle®) to 9.07 g/100mL (orange/Del Valle®). Fourteen samples presented total sugar content over 10 g per 100 mL. Purple fruit juice (Skinka®) and guava juice (Jandaia®) presented the highest (12.09 g/100mL) and the lowest (7.25 g/100mL) total sugar, respectively. There were significant differences among the samples for reducing, non-reducing ad total sugars (p<0.0001). Discussion Fruit drinks have been increasingly consumed by young infants in the form of diluted squashes and juices7. Historically, fruit juice has been recommended by pediatricians as a source of vitamin C and an extra source of water for healthy infants and young children as their diets expanded to include solid foods with higher renal solute3. Because juices taste good, children readily accept them. However, though juice consumption has some benefits, it also has potential detrimental effects3, including shortness of stature and obesity22, development of dental caries23 and dental erosion9,14. Therefore, fruit juices should be used as part of a meal or snack, and should not be sipped throughout the day or used as a means to pacify an unhappy infant or child3. The measurement of the pH is a practical method to assess the erosive potential of acidic drinks. In agreement with previous in vitro investigations12-13,17,24-25, the present study showed that any of the tested fruit juices could cause dental erosion because all of them had pH values below the critical value assumed for dental demineralization (5.5). Although the values were numerically very similar, it must be kept in mind that pH is a logarithmic scale. Small changes in pH values therefore equate with larger changes in the hydrogen ion concentration14. Regarding TA (i.e., amount of base required to bring a solution to neutral pH), the values obtained for the tested industrialized juice brands were lower than those reported in the literature26. The type of acid present in the beverages seems to influence the demineralizing capacity of the product; citric acid, for example, has a greater erosive potential than maleic, phosphoric and hydrochloric acids27-30. The high erosive potential of the citric acid is associated with its capacity of forming complexes with the calcium ions present in the hydroxiapatite30. Therefore beverages with low pH and containing citric acid are considered as being potentially erosive31. Baseline pH values give only a glimpse of the initial hydrogen ion concentration and therefore provide no indication as to the presence of undissociated acids. It is currently thought that TA is a more accurate measure of the total acid content of a drink and may, therefore, be a more realistic means of predicting erosive potential32. Another evaluated parameter was °Brix, which is a measure of total content of soluble solids (proteins, lipids, glucides, mineral salts, vitamins, organic acids, pigments and other substances) in a sample33, which has a direct relationship with the viscosity of the ingested foods, possibly facilitating the retention of diet components on the dental surfaces. In this study, the TSSC (°Brix values) ranged from 10.25 °Brix (Mango juice, Jandaia®) to 12.75 °Brix (Orange juice, Del Valle®), which is in agreement with the findings of previous Brazilian studies13,26,34. Regarding this parameter, all fruit juices evaluated in the present study seem to have similar viscosity, as they did not significantly differ in °Brix analysis. The cariogenic potential of foods is linked to the content of a variety of sugars, monosaccharides and disaccharides. Water is the predominant component of fruit juice. Carbohydrates, including sucrose, fructose, glucose and sorbitol, are the next most prevalent nutrients in juice3. All three sugars, sucrose, glucose and fructose, are fermentable to acid by a variety of oral microorganisms15. Sucrose can be split into its two component sugars (glucose and fructose). This process is called inversion, and the product is called invert sugar. Invert sugar is used mainly by food manufacturers to retard the crystallization of sugar and to retain moisture in the packaged food. Glucose and fructose can reduce the content of cations, such as copper ions, which are present in the Fehling solution, transforming the copper into an oxidized product. Sucrose, however, does not have the same characteristic and it has to be acidulated in order to have its content measured35. This study evaluated the content of reducing sugars (e.g.: glucose), non-reducing sugars (e.g.: sucrose) and total sugars. Fourteen samples presented total sugar content over 10 g per 100 mL, which is an important value as far as liquid intake by children is concerned. Some studies have analyzed sugar content of commercial brands of juices of fruits and found values ranging from 2.833 to 7.3 g per 100 g26. Therefore, the total sugar content values obtained in the present study may be considered high, which leads to the conclusion that frequent and excessive ingestion of such products combined with poor oral hygiene, may contribute to the initiation of carious lesions. Both reducing (glucose) and non-reducing sugars (sucrose) can be metabolized by S. mutans. However, these microorganisms have greater capacity of forming glucans from sucrose. This sugar is a substrate for glycosyltransferase (GTF), which can be of three types: GTF-B, GTF-C and GTF-D. The glucans mediate the adherence of microbial cells to dental surface, favoring biofilm formation36-37. The implication is that an important concern with the consumption of these beverages by infants should be their erosiveness rather than their cariogenicity. However, it obviously must be borne in mind that since all these products contain sugars, no matter whether natural or added, if they are allowed to remain in the mouth over long periods as part of a frequent, protracted sugar intake pattern, it is likely that they will be able to contribute to the caries process, in which sugars serve as substrate for acid formation15. It is important to emphasize some limitations of this study, among which the fact that it was not possible to have an equal distribution of flavors among the commercial brands because this variability is not available in the market. Another important point to be considered is the need of evaluating different lots of products, as the three measurements were done in different samples of the same lot in the present study. The national and international literature is scarce in studies investigating the presence of reducing, non-reducing and total sugars in industrialized fruit juices. In addition, to the best of our knowledge, there is no standardized value in the literature to establish the cariogenic potential of the sugars present in beverages. It should also be considered that dental caries and erosion have a multifactorial etiology and that an in vitro study, such as the present one, does not meet all requirements for extrapolating the obtained results to the clinical conditions. Thus, further studies about this issue are required. Public health advocates widely believe that poor infant feeding practices, particularly feeding with juice in a bottle at bedtime, are associated with the development of caries in primary teeth23. Parents and caregivers should limit young children's consumption of fruit juice to less than 350 mL per day7. Moreover, instructing parents/caregivers on the negative impacts of an excessive intake of fruit juices by their children is an important aspect to be considered in the prevention of dental erosive lesions. In conclusion, the industrialized fruit juices evaluated in this study presented low pH and a high total sugar content, differing in their erosive and cariogenic potential, respectively. Therefore, parents/caregivers should be instructed on the potential deleterious effects of such beverages on the dental hard tissues when often consumed by children. Furthermore, information on healthy dietary habits and instructions on adequate oral hygiene measures must be an integral part of health education actions. References
Copyright 2010 - Braz J Oral Sci The following images related to this document are available:Photo images[os10034t3.jpg] [os10034t2.jpg] [os10034t1.jpg] |
| |||||||||