 |
| About Bioline | All Journals | Testimonials | Membership | News |
|
||||||
|
||||||
Braz J Oral Sci, Vol. 9, No. 3, July-September, 2010, pp. 398-401 Bone mineral density on conventional and digitized images under different parameters of digitization and storage Matheus Lima de Oliveira1, Frab Norberto Bóscolo2, Guilherme Monteiro Tosoni3 1 DDS, MSc, Graduate Student, Department of Oral Diagnosis,
Piracicaba Dental School, State University of Campinas, Brazil
Correspondende to: Matheus Lima de Oliveira Department of Oral Diagnosis, Piracicaba Dental School, State University of Campinas UNICAMP - 13414-903, Piracicaba, SP, Brazil Phone / Fax : 55-19-21065327 E-mail: matheusoliveira@hotmail.com Received for publication: November 19, 2009 Code Number: os10044 Abstract Aim: To assess the bone mineral density on conventional and
digitized images, comparing whether different parameters of digitization and
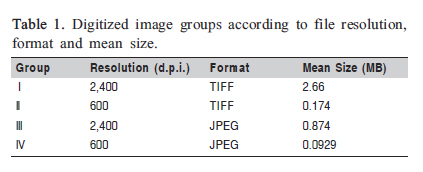
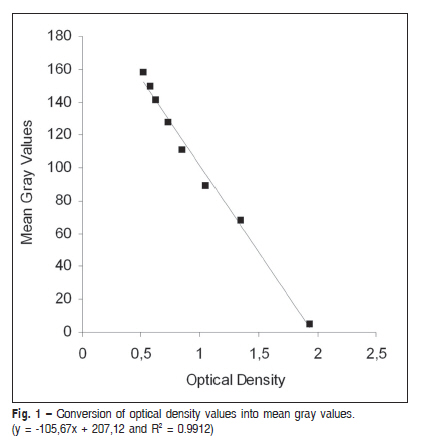
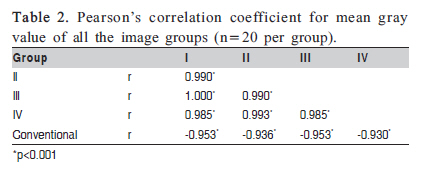
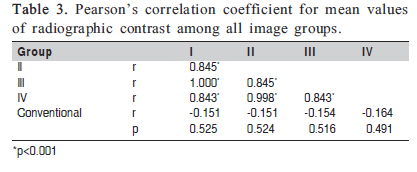
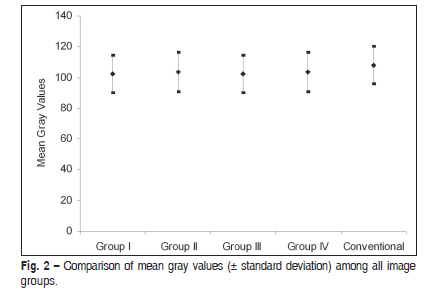
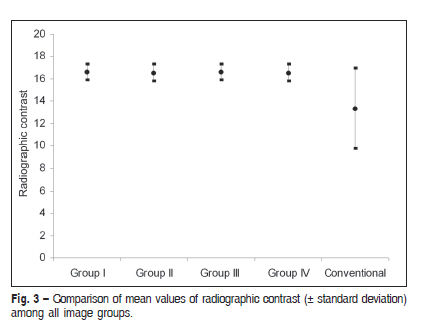
storage change these values. Keywords: bone density, densitometry, dental radiography, digital dental radiography. Introduction Despite the large number of studies and the development of several direct digital dental systems in the last 20 years, conventional radiography is still being used by dentists, considering that film is reliable and inexpensive when compared with direct digital radiography1-4. Although this scenario tends to be changed in the near future, converting the existing records of film-based images to digital is one important issue to be currently addressed. Digitized radiography has preceded direct digital radiography and can be useful for quantitative analysis of images5-6. While conventional image is permanent and cannot be changed, digitized image can be post processed by the examiner7-8. Besides these advantages, digitized image presents many additional options, such as digital storage, compression and exchange of radiographic information2,4. Radiographic images have been used to evaluate object density such as bone tissue9 and dental materials10-13. Density on film-based images is quantified by measuring the optical density. After digitization process, the digitized image also can be used for this purpose using imaging analysis software. However, the analog conversion of film-based image into digital files involves many parameters, and some loss of information may occur, hindering the bone density analysis2. The aim of this study was to assess the bone mineral density on conventional and digitized images, comparing whether different parameters of digitization and storage change these values. Material and methods This study was designed according to the local Institutional Research Ethics Committee and carried on after its approval (Protocol #33/05). Five partially dentulous dry mandibles, presenting teeth both on anterior or posterior region, were selected. The teeth were radiographed using the GE 1000 unit (General Electric, Milwaukee, WI, USA), operating with 70 kVp, 3 mAs and 40 mm source-to-film distance. In all 20 radiographic acquisition, Insight Kodak #2 films were vertically placed in parallel position to the tooth, fixed with adhesive tape and utility wax. A custom-made aluminum 7mm-stepwedge was placed on the superior edge of the film and a 24-mm-thick acrylic plate simulated the soft tissue scatter. Automatic film processing was performed in a darkroom with the Dent-X 9000 unit (Elmsford, NY, USA), set in 6 min. The film-based images were digitized with Agfa SnapScan 1236s flatbed scanner transparency unit (Mortsel, Belgium), using dedicated software (Agfa FotoSnap 32V3.00.05), which allowed digital conversion and storage. The digitization process was performed in duplicate. Primarily, the films were scanned with 2,400 d.p.i. (dots per inch), the maximum scanner resolution, and subsequently, with 600 d.p.i. Each digitized image was saved into two different file formats, TIFF (tagged image file format) and JPEG (joint photographic experts group). The TIFF file format corresponded to the raw image, with no compression, while the JPEG corresponded to compressed image format. Thus, the film-based image yielded four different groups of digitized images (Table 1). All images were analyzed using ImageJ version 1.32j (http://rsb.info.nih.gov/ij/docs/), a public domain software developed by the National Institutes of Health (NIH-USA), and none of them was post processed. On each image, nine circular regions of interest (ROI) with 2 mm in diameter were selected using appropriate tool of the software. ROI (A) was randomly selected on trabecular alveolar bone, away from adjacent anatomical structures such as lamina dura, mandibular canal, mental and lingual foramen, mental ridge and etc. ROI (1) was chosen as background image and represented the most radiolucent region of the image. ROIs (2-8) were selected on each step of the aluminum 7-mm stepwedge. To have reproducible ROIs in all digitized image groups, the coordinate values of each ROI were registered and this value was used as reference to select the same ROI. Mean gray values measurements were performed. The MRA CQ-01 densitometer unit (Ribeirão Preto, SP, Brazil), with a 2-mm diameter circular aperture, measured optical density on each ROI of the film-based image. The measurements were performed in triplicate and the mean value of optical density was registered. To insure that the corresponding ROIs were measured on the densitometer with the same diameter and position previously selected, the digitized images, with all ROIs marked on it, were printed on a sheet of cellulose acetate. This acetate was cropped and overlapped the film, helping as a template. In order to convert optical density values into mean gray values, all optical density measurements of ROI 1 to ROI 8 were plotted against the correspondent measurements of mean gray value using Microsoft Excel 2007 for Windows. The equation of the trend line between these values (y = -105.67x + 207.12 and R2 = 0.9912) was used for the conversion, as demonstrated in Figure 1. The mean gray values measured on ROI 4 and ROI 5 were chosen to establish the radiographic contrast of the conventional and digitized images due to their uniformity and similarity to the bone density, using the following equation: Radiographic contrast = ROI (5) - ROI (4). Pearson's correlation coefficient was calculated between mean gray values and contrast measurements of all image groups. ANOVA for differences between image groups and Tukey's test were performed. The significance level was set at 0.05. Results Pearson's correlation coefficient showed a negative, significant and strong mean gray values association between digitized and conventional images (Table 2). A significant and strong correlation could be observed in the radiographic contrast among the four digitized image groups, which differs of the conventional image group that did not show a significant association when compared with the four digitized image groups (Table 3). ANOVA did not reveal a statistically significant difference in mean gray values (Figure 2) and radiographic contrast (Figure 3) among the four digitized image groups, but the contrast of conventional images was significantly lower (p<0.001) than the digitized images, as can be observed in figure 3. Discussion The final quality of the radiographic image may be modified by the digitization process14-16. It includes factors inherent to the digitization process such as file resolution and format. In this study, an obsolete flatbed scanner captured the images in resolutions of 600 and 2400 d.p.i. The former corresponds to a fair image size and a short scan time and the latter corresponds to the maximum scanner resolution. As it is known that the spatial resolution contributes to image quality17, it was chosen to compare a widely used resolution with the maximum possible resolution, and although 2,400 d.p.i. had been selected, the images presented an actual resolution of 1,200 d.p.i.. Moreover, modern digital radiographic imaging systems allow high resolution image acquisition and the file size is very close to the file sizes found in this study. In addition, each digitized image was saved in two different file formats, TIFF and JPEG. The TIFF file corresponded to the original file format of the image, with no compression, while the JPEG format corresponded to a compressed image, with a smaller file size. The image compression in JPEG is sufficient even for the challenging task of radiographic detection of non-cavitated proximal carious lesions18. However, the JPEG compression can introduce potentially deleterious variations to radiodensity data19. It is hard to compare the degree of information loss related to image compression in JPEG because its compression scale is not standardized and software applications have different or even opposing compression scales19-20. Thus, four digitized images with different features of resolution and format were assessed. Although it could be expected that different resolutions and file formats would yield different results of densitometry21, this was not found in the present study. This might have happened due to the minimum resolution used in this study (600 d.p.i.), considering that lower resolution such as 300 d.p.i. is considered good enough even for dental caries diagnosis15. The digitized images showed significant and strong correlation between the bone density values, with no statistical difference. It means that none of the parameters tested in this study (digitized image resolution and compression) interfered in the bone mineral density measured in mandibular alveolar bone. Thus, under experimental conditions established in this study, it can be recommend the combination of 600 d.p.i. and JPEG file as a parameter for digitized images in studies of densitometry (group IV); since this group of image presented a 0.0929 MB mean file size, which is nearly 28 times smaller than the image group of maximum resolution (group I), and represents a short time scan, small storage size and a faster transmission. Bone mineral density values of conventional and digitized images were statistically similar. The negative correlation is due to density values being inversely proportional when measured in conventional and in digitized images. Our findings demonstrated that the results of densitometry are similar when it is conducted on radiographic films using a densitometer device or when it is conducted on digitized image, using image analysis software. Therefore, the digitization process can be used as an indirect method to measure bone mineral density, replacing the densitometer and presenting benefits such as different storage and transmission possibilities. The results of image contrast were also very similar among the digitized images but they were significantly higher than conventional image. These findings were expected and they are in agreement with Parissis et al.16. Digitizing process with 8-bit expands automatically the grayscale resolution to fill the scale from 0 to 255 resulting in increased image contrast. Nevertheless, this feature in the displayed image does not interfere with densitometry results. The limitation of this study is that other parameters of measuring image quality, such as noise, have not been tested. It has been reported in the literature22 a trade-off between noise and resolution. As regards this parameter, since our study captured the images with two resolutions (600 and 2,400 d.p.i.), and based on our results of densitometry, it can be inferred that noise does not seem to have an effect on bone mineral density measurements in digitized images, if this latter is captured using these two resolutions. In conclusion, bone mineral density did not differ in conventional and digitized images. The parameters of image compression and resolution, tested in this study, did not change the results of densitometry, and the digitization process increased the radiographic contrast. Acknowledgments The authors gratefully acknowledge financial support from FAPESP, a research foundation of the State of Sao Paulo Brazil (Process # 2005/04615-3). References
Copyright 2010 - Braz J Oral Sci The following images related to this document are available:Photo images[os10044f1.jpg] [os10044t3.jpg] [os10044t2.jpg] [os10044f2.jpg] [os10044t1.jpg] [os10044f3.jpg] |
| |||||||||
