search
for
 About Bioline  All Journals  Testimonials  Membership  News


Iranian Journal of Pediatrics
Tehran University of Medical Sciences Press
ISSN: 1018-4406 EISSN: 2008-2150
Vol. 18, Num. 1, 2008, pp. 38-46

Iranian Journal of Pediatrics, Vol. 18, No. 1, March, 2008, pp. 38-46

Longitudinal Pattern and Reference Values of Obesity Indices of Infants in Jahrom (Southern  Region of), Iran

Seyed Taghi Heidari*1,2, Msc, Biostatistics; Mohammad Ali Vakili2,3 , MSc, Biostatistics; Fatemeh Emamghorashi3, MD, Pediatricien

1Gastroenterohepatology Research Center, Shiraz University of Medical Sciences, Shiraz, IR Iran
2Department of Health, Lorestan University of Medical Sciences, Khoramabad, IR Iran
3Department of Biostatistics, Shiraz University of Medical Sciences, Shiraz, IR Iran
4Department of Health, Golestan University of Medical Sciences, Gorgan, IR Iran
5Department of Pediatrics, Jahrom University of Medical Sciences, Jahrom, IR Iran
* Correspondence author; Address: Department of Biostatistics, School of Medicine, Shiraz University of Medical Sciences, P.O. Box 71345-1847, Shiraz, IR Iran. E-mail: heidaryt@sums.ac.ir

Received: 17/12/07; Revised: 05/05/07; Accepted: 25/07/07

Code Number: pe08006

Abstract

Objective:Obesity (scaled weight-by-height index) charts of a cohort of 597 healthy infants (391 boys and 206 girls) living in Jahrom (Southern Iran) are presented.
Material & Methods:An adjusted weight-for-height was used to develop power type obesity indices, Ip=W/Hp. Polynomial modeling was used by applying HRY (Healy, Rasbash, Yang) nonparametric method to estimate age-related smoothed centiles of obesity.
Findings:
The optimal value of p was found to be 2.5 for girls and 2 for boys. No more than cubic and quadratic polynomials were needed to fit obesity-for-age smoothly for infants. Infant's obesity increases from birth to six months of age and decreases later on to the age of 20 months when it becomes stable.
Conclusion:Using age–dependent obesity index (scaled weight by height) is an appropriate index which explores the degree of fatness. A local standard for assessing obesity in clinical practice as well as community health programs in Iran is of urgent need; our data serve this purpose.

Key Words: Obesity index, Infants, Age, Reference values, Obesity

Introduction

Obesity is a complex disease; multiple causes lead to an imbalance between energy intake and output and to the accumulation of large amounts of body fat. Obesity is defined when the weight is not proportional to height regarding sex and age. Obesity can be caused genetically, by diet rich in energy, lack of physical exercise, low activity and stress or tension[1].

Obesity is becoming increasingly recognized as a public health problem even in developed world, because obesity affects all body activities. Besides, obese persons have psychological and emotional problems[2-7]. In addition, in recent decade, obesity increased in developing countries due to modernization that caused affluence and increased food consumption[8-12]. Obesity causes some diseases in adults such as cardiovascular disease, hypertension, diabetes mellitus type II, and degenerative joint diseases[1]. In children and adolescents, it can cause hypertension, cardiovascular disease, diabetes mellitus, cerebrovascular diseases, colorectal cancer and increases mortality rate[13].

There are many problems to cure obesity or lose weight, in USA the cost of obesity treatment includes 2 to 7% of the whole health cost[14]. Considering that most obese adults have been overweight as children, we can prevent and decrease incidence of obesity by early diagnosis in childhood, and further reduce cost and risk factors of diseases related to obesity.  

There are different instruments available for measuring obesity in adults and children such as the thickness of the skin fold, chemical analysis, reference curves, weight-height tables, etc[15]. In addition, there are different life styles and nutritional habits in the world. A normal weight child in developed countries may be seen as overweight or obese compared with children of the same weight in developing countries and vice versa. So it is recommended that the obesity index becalculated by local data, because using other indices might be misleading. Also the trend of obesity and growth is different during times, and therefore it is necessary to update the old data[16]. In recent decade, there have been only a few studies on obesity of children in Iran[16-23]. One of the most appropriate obesity indices of children is the power index, Ip=W/Hp, that calculates the best power (P) based on social-economic and nutrition status, as well as weight and height in different ages. The calculation of Body Mass Index (BMI) in which P=2 is the most commonly used method in many studies related to obesity[24-26].

The value of dynamic charts, which take age into account, is of crucial importance for clinical works as well as public health strategies. Most studies are static whereas this study is dynamic.

Therefore, the purpose of this paper was to develop indices measuring the degrees of fatness (obesity indices) in infants by scaling weight-for-height, and present the pattern of change of these indices with age by fitting appropriate smooth curves for Jahrom infants in southern region of Iran.

Material & Methods

In a prospective study, 597 (391 boys and 206 girls) children born in Jahrom entered our study from April 2001 to December 2002. A sample size of 259 cases computed in relation to correlation coefficient between obesity and weight[21], was adequate for the study. These were the children who were referred to Jahrom Health centers, with a birth weight more than 2500 g, fetal age of 37-42 weeks and with no congenital anomalies. The height, weight and head circumference of these children were recorded 18 times by trained personals (once a month from one month of age up to one year and then every two months up to two years of age). The children's height was measured in supine position before walking and thereafter in standing position. Weight of the children was measured with a precision of 10 g, height and head circumference with that of 10 mm, and exact age was recorded at the time of referral to the center.

There was no significant difference between demographic characteristics in children observed in health centers and the others. During 2 years only 2.5 percent of children visited health centers less than 6 times, 22 percent less than 12 times and 72 percent at least 12 times (table 1).

Table 1- Frequency distribution in children referred to health center for anthropometric measurements

Times

Frequency (%)

2

2 (0.3)

4

5 (0.8)

5

3 (0.5)

6

5 (0.8)

7

8 (1.3)

8

16 (2.7)

9

14 (2.3)

10

15 (2.5)

11

28 (4.7)

12

37 (6.2)

13

43 (7.2)

14

45 (7.5)

15

71 (11.9)

16

94 (15.7)

17

119 (19.9)

18

92 (15.4)

Total

597 (100)

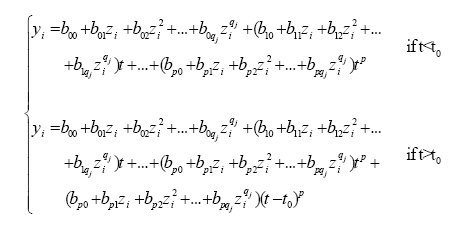
Choice of obesity indices

We used Ip= W/Hp to adjust weight (kg) for height (m), where P is a constant[18]. It is assumed that the distribution of obesity is independent of height, thus a 'good' value of p is one whose obesity index is uncorrelated with height. A good obesity index will also be highly correlated with weight. A model of W=c×Hp (c is a constant) is suitable to search for appropriate values of P.

The logarithmic transformation leads to logW=c+P×logH. Thus the value of P can be estimated (with 95% confidence interval) by ordinary regression analysis.

Analysis of infant obesity indicator

In order to fit appropriate models for obesity, HRY method[28] was used to estimate age related smoothed centiles. This method makes no assumption about the nature of the measurement. In HRY model the measurement centiles at any given age are estimated and then polynomials model with a cut point (because trend of obesity index is not homogeneous) fit to unsmooth centiles to smooth them. The polynomials model is:

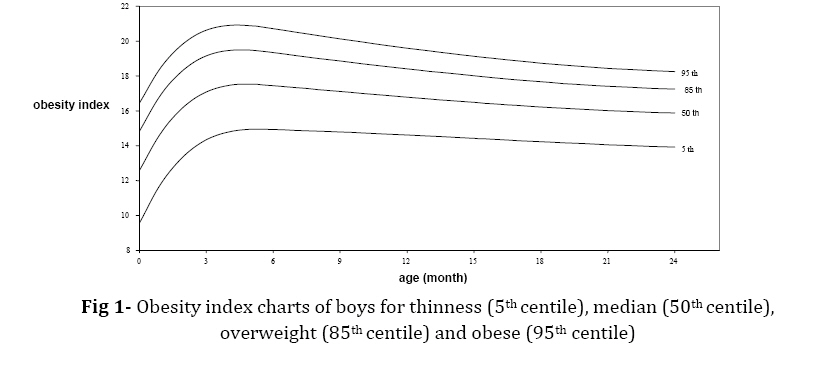
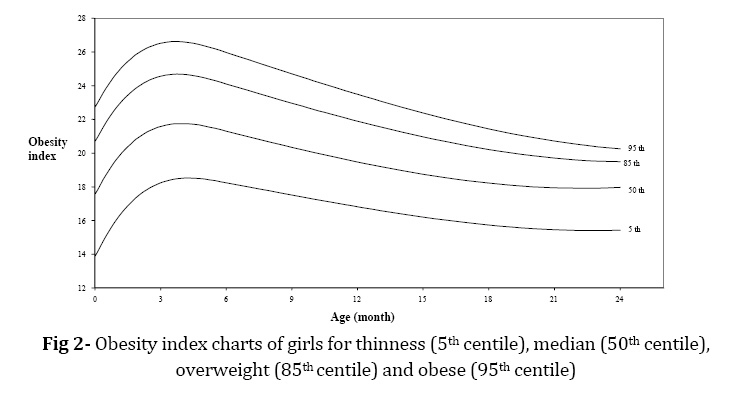
Where yi is ith centile, bij is constant coefficient and zi is the corresponding normal equivalent deviate (NED). This method was implemented for the World Health Organisation as GROSTAT computer package[29]. First goodness of fit was assessed both graphically and numerically. Second Z-scores (SD scores) of the measurements were calculated upon fitting smoothed age related centiles.

Findings

Choice of obesity index

P was calculated as 2 with 95% confidence interval (1.83-2.15) for boys and 2.5 with 95% confidence interval (2.23-2.7) for girls. The value of P for different age groups was examined and a power P>1 for parents and a power >2.5 for infants were not necessary. Therefore, P=2 and P=2.5 were chosen as the best powers for estimating an index of obesity for boys and girls respectively. For more validation a searching approach was applied using P=1, 1.5... 4. Table 2 shows that the only indices with minimal acceptable correlations with height are I2 and I2.5 for boys and girls respectively. These indices are significantly correlated with weight.

Obesity index charts

Obesity index charts of boys and girls are presented in fig 1 and 2 respectively. Obesity tends to increase with age in both sexes up to the age of 6 months and then decreases to age 20 months where it becomes stable. Cubic polynomials with cut point 6 fitted obesity-for-age smoothly for boys and girls. Tables 3 and 4 show the smoothed centiles for obesity index by sex and age.

Table 2- Obesity correlation coefficient Ip with height and weight.The best obesity is given in bold

Subjects

Index

Weight

Height


Boys

n=391

            I1

0.944*

0.527*

I1.5

0.831*

0.296*

            I2

0.623*

-0.004

I2.5

0.355*

-0.307*

            I3

0.100

-0.541

I3.5

-0.097

-0.662*

            I4

-0.238*

-0.784


Girls

n=206

            I1

0.963*

0.626*

I1.5

0.889*

0.460*

            I2

0.746*

0.225*

I2.5

0.528*

-0.059

            I3

0.273*

-0.331*

I3.5

0.039

-0.554*

            I4

-0.145

-0.688*

*P<.01

Table 3- Obesity index smoothed centiles for boys by age

age

3rd centile

5th centile

10th centile

25th centile

50th centile

75th centile

85th centile

90th

centile

95th centile

97th centile

1

11.5

11.9

12.5

13.6

14.8

16.2

17.0

17.6

18.6

19.2

2

13.0

13.4

14.0

15.1

16.2

17.6

18.4

19.0

19.9

20.6

3

13.9

14.3

14.9

15.9

17.1

18.4

19.2

19.7

20.6

21.3

4

14.4

14.8

15.4

16.3

17.5

18.7

19.5

20.0

20.9

21.6

5

14.5

14.9

15.5

16.4

17.5

18.7

19.5

20.0

20.9

21.5

6

14.5

14.9

15.5

16.4

17.4

18.6

19.3

19.9

20.7

21.3

7

14.5

14.9

15.4

16.3

17.3

18.5

19.2

19.7

20.5

21.1

8

14.5

14.8

15.4

16.2

17.2

18.3

19.0

19.5

20.3

20.9

9

14.4

14.8

15.3

16.1

17.1

18.2

18.9

19.3

20.1

20.7

10

14.4

14.7

15.2

16.0

17.0

18.1

18.7

19.2

20.0

20.5

11

14.3

14.7

15.2

15.9

16.9

17.9

18.6

19.0

18.8

20.3

12

14.3

14.6

15.1

15.8

16.8

17.8

18.4

18.9

19.6

20.1

13

14.2

14.6

15.0

15.7

16.7

17.7

18.3

18.7

19.4

20.0

14

14.2

14.5

15.0

15.6

16.6

17.5

18.1

18.6

19.3

19.8

15

14.1

14.4

14.9

15.6

16.5

17.4

18.0

18.4

19.1

19.6

16

14.0

14.4

14.8

15.5

16.4

17.3

17.9

18.3

19.0

19.5

17

14.0

14.3

14.8

15.4

16.3

17.2

17.8

18.2

18.9

19.4

18

13.9

14.2

14.7

15.3

16.2

17.1

17.7

18.1

18.7

19.2

19

13.9

14.2

14.6

15.3

16.1

17.0

17.6

18.0

18.6

19.1

20

13.8

14.1

14.6

15.3

16.1

17.0

17.5

17.9

18.5

19.0

21

13.7

14.1

14.5

15.2

16.0

16.9

17.4

17.8

18.4

18.9

22

13.7

14.0

14.5

15.2

16.0

16.8

17.4

17.7

18.4

18.8

23

13.6

14.0

14.4

15.1

15.9

16.8

17.3

17.7

18.3

18.8

24

13.6

13.9

14.4

15.1

15.9

16.7

17.3

17.7

183

18.7


Discussion

In this study, BMI (p=2) is the obesity index for boys and I2.5=W/H2.5 for girls. These indices have a maximum correction with weight and minimum correlation with height (table 2). This is different from other studies because BMI is used for obesity disregarding the age or as a static view; in this situation the index has a high correlation with weight and height. This index challenges the logic in obesity index and regarding effect of age on obesity index in infants (age less than 2 years), Therefore, BMI is not appropriate for use  in infants. Obesity index with correlation to age is more reliable and scientific. The value of p in a similar study in Shiraz was 2.5 for boys and girls[20], the same value for girls as in the present study. Table 5 shows the comparison of infant girls obesity index in Shiraz and Jahrom related to age (month). The smoothed centiles for obesity index is not different in Shiraz and Jahrom. The correction coefficients between obesity index and weight are 0.623 and 0.528 in boys and girls respectively. This result shows that the 30% and 28% of variation in obesity is caused by weight in boys and girls respectively; also this  variation  is  23.3%  in  Shiraz, which  is  not

Table 4- Obesity index smoothed centiles for girls by age

age

3rd centile

5th centile

10th centile

25th centile

50th centile

75th centile

85th centile

90th

centile

95th centile

97th centile

1

15.6

16.1

16.8

18.1

19.6

21.5

22.7

23.4

24.7

25.7

2

17.0

17.5

18.2

19.4

20.9

22.7

24.0

24.7

26.0

26.9

3

17.8

18.2

18.9

20.1

21.6

23.3

24.6

25.2

26.5

27.5

4

18.1

18.5

19.2

20.3

21.8

23.5

24.7

25.3

26.6

27.6

5

18.0

18.5

19.1

20.2

21.6

23.3

24.5

25.1

26.4

27.3

6

17.8

18.2

18.9

19.9

21.3

22.9

24.1

24.7

26.0

26.9

7

17.6

18.0

18.6

19.7

21.0

22.6

23.7

24.3

25.5

26.5

8

17.3

17.8

18.3

19.4

20.7

22.2

23.3

23.9

25.1

26.0

9

17.1

17.5

18.1

19.1

20.3

21.9

23.0

23.5

24.7

25.6

10

16.9

17.3

17.8

18.8

20.0

21.5

22.6

23.2

24.3

25.1

11

16.6

17.0

17.6

18.6

19.7

21.2

22.2

22.8

23.9

24.7

12

16.4

16.8

17.4

18.3

19.5

20.9

21.9

22.4

23.5

24.3

13

16.2

16.6

17.1

18.1

19.2

20.6

21.6

22.1

23.1

23.9

14

16.0

16.4

16.9

17.9

19.0

20.3

21.3

21.7

22.7

23.5

15

15.8

16.2

16.7

17.7

18.7

20.0

21.0

21.4

22.4

23.1

16

15.6

16.0

16.6

17.5

18.5

19.8

20.7

21.1

22.0

22.8

17

15.5

15.9

16.4

17.3

18.4

19.6

20.4

20.8

21.7

22.4

18

15.3

15.7

16.3

17.2

18.2

19.4

20.2

20.6

21.4

22.1

19

15.2

15.6

16.2

17.1

18.1

19.2

20.0

20.4

21.2

21.8

20

15.1

15.5

16.1

17.0

18.0

19.1

19.8

20.2

20.9

21.5

21

15.0

15.4

16.0

17.0

17.9

18.9

19.7

20.0

20.7

21.3

22

14.9

15.4

16.0

17.0

17.9

18.9

19.6

19.9

20.5

21.0

23

14.9

15.4

16.0

17.0

17.9

18.8

19.5

19.8

20.4

20.8

24

14.9

15.4

16.1

17.0

18.0

18.8

19.5

19.7

20.3

20.7


significantly different from that in Shiraz and Jahrom.

Also less than 0.5% (0.3% and 0.001% for boys and girls) of variation in obesity is caused by height; this result is the same as in other studies. The low changes in obesity index by weight can be attributed to high correlation between obesity index and other factors such as head, chest and arm circumference in children and anthropometric measurement in parents (the latter could not be measured due to limitation). So, we can not calculate the correlation between obesity index and other measurements.

It is recommended that in future for studies to determine obesity index in children, other measurements such as chest and arm circumference in children and parents be recorded in addition to measurements of weight and height for calculating power indices. Most studies use obesity index because of simple interpretation of obesity.

In this paper, we present the reference curves of obesity indices. These curves are determined based on an advanced statistical model, which show the pattern of obesity in Jahrom's infants. The curves can be used as a standard reference for screening the degree of obesity in children.

Table 5- Comparison of obesity index smoothed centiles for girls in Shiraz and Jahrom by age


age

(mo)

3rd centile

5th centile

10th centile

25th centile

50th centile

75th centile

85th centile

90th

centile

95th centile

97th centile

Jahrom

1

15.6

16.1

16.8

18.1

19.6

21.5

22.7

23.4

24.7

25.7

2

17.0

17.5

18.2

19.4

20.9

22.7

24.0

24.7

26.0

26.9

3

17.8

18.2

18.9

20.1

21.6

23.3

24.6

25.2

26.5

27.5

4

18.1

18.5

19.2

20.3

21.8

23.5

24.7

25.3

26.6

27.6

5

18.0

18.5

19.1

20.2

21.6

23.3

24.5

25.1

26.4

27.3

6

17.8

18.2

18.9

19.9

21.3

22.9

24.1

24.7

26.0

26.9

9

17.1

17.5

18.1

19.1

20.3

21.9

23.0

23.5

24.7

25.6

12

16.4

16.8

17.4

18.3

19.5

20.9

21.9

22.4

23.5

24.3

15

15.8

16.2

16.7

17.7

18.7

20.0

21.0

21.4

22.4

23.1

18

15.3

15.7

16.3

17.2

18.2

19.4

20.2

20.6

21.4

22.1

21

15.0

15.4

16.0

17.0

17.9

18.9

19.7

20.0

20.7

21.3

24

14.9

15.4

16.1

17.0

18.0

18.8

19.5

19.7

20.3

20.7


Shiraz

1

16.0

16.3

16.9

17.9

19.1

20.5

21.3

21.9

22.7

23.3

2

16.5

16.8

17.4

18.4

19.6

21.0

21.8

22.3

23.1

23.7

3

16.9

17.2

17.8

18.8

20.0

21.3

22.1

22.6

23.5

24.0

4

17.1

17.5

18.0

19.0

20.2

21.6

22.3

22.8

23.6

24.2

5

17.3

17.6

18.2

19.2

20.4

21.7

22.4

22.9

23.7

24.3

6

17.3

17.7

18.2

19.2

20.4

21.7

22.4

22.9

23.7

24.2

9

17.1

17.4

18.0

19.0

20.1

21.3

22.0

22.5

23.2

13.7

12

16.3

16.7

17.2

18.2

19.3

20.5

21.1

21.5

22.2

22.7

15

15.4

15.8

16.3

17.3

18.3

19.4

20.0

20.4

21.1

21.5

18

14.6

15.0

15.5

16.5

17.5

18.5

19.1

19.4

20.0

20.4

21

14.2

14.5

15.1

16.0

17.0

18.0

18.5

18.8

19.3

19.7

24

14.2

14.5

15.1

16.0

17.0

18.0

18.5

18.8

19.3

19.7


According to international definition of obesity 5th, 85th and 95th centiles are low weight, overweight and obese respectively[3-6]. Also tables 3 and 4 show the smoothed obesity centiles based on age and sex.

Most of the studies on obesity in the world have been done on children aged more than 6 years[1,8,29-32]. Cole et al determined a reference for obesity index on 0-20 year-olds in Netherlands[33], and in Iran the first study on 0-2 year-olds obesity index was done by Ayatollahi and Heydari[20], this cohort study also determined the pattern of obesity related to age based on gender.  

A limitation of the present study was that only the infants born in Jahrom city have been included, whereas a national cohort study is needed for monitoring of growth and obesity in infants.

Conclusion

Age–dependent obesity index (scaled weight by height) is an appropriate index which explores the degree of fatness. The local standard provide in this study can assess the obesity both in clinical practice and public health programs in the country. So, there is a need to standardize these results in a national study in several intervals.

References

  1. Laitinen J, Power C, Jarvelin M. Family social class, maternal body mass index, childhood body mass index and age at menarche as predictors of adult obesity. Am J Clin Nutr. 2001;74(3):287-95.
  2. CDC. CDC Growth Charts: United States. US Department of Health and Human Services. 2000; Number 314.
  3. Kalies H, Lens J, von Kries R. Prevalence of overweight and obesity and trends in body mass index in German pre-school children, 1982-1997. Int J Obes Relat Metab Disord. 2002;26(9):1211-7.
  4. Zimmermann MB, Hess SY, Hurrell R. A national study of the prevalence of overweight and obesity in 6-12 y-old Swiss children: body mass index, body-weight perceptions. Eur J Clin Nutr. 2000;54(7): 568-72.
  5. James PT, Leach R, Kalamara E, et al. The worldwide obesity epidemic. Obes Res. 2001;9(suppl4):228-33S.
  6. Kuskowska-Wolk A, Bergtrom R. Trends in body mass index and prevalence of obesity in Swedish women 1980-89. J Epidemiol Community Health. 1993;47(3):195-9.
  7. Rolland-Cachera MF, Castetbon K, Arnault N, et al. Body mass index in 7-9-y-old French children: frequency of obesity, overweight and thinness. Int J Metab DIsord. 2002;26(12):1610-6.
  8. El-Hazmi MA, Warsy AS. A comparative study of prevalence of overweight and obesity in children in different provinces of Saudi Arabia. J Trop Pediatr. 2002; 48(3):172-7.
  9. Al-Isa AN. Changes in body mass index (BMI) and prevalence of obesity among Kuwaitis 1980-1994. Int J Obes Relat Metab Disord. 1997; 21(12):1093-9.
  10. Kordy MN, el-Gamal FM. A study of pattern of body mass index (BMI) and prevalence of obesity in Saudi population. Asia Pac J Public Health. 1995;8(2):59-65.
  11. Musaiger AO, Gregory WB. Profile of body composition of school children (6-18 y) in Bahrain. Int J Obes Relat Metab Disord. 2000;24(9):1093-6.
  12. Wilborn C, Beckham J, Campbell B, et al. Obesity: Prevalence, theories, medical consequences, management, and research directions. J Int Soc Sports Nutr. 2005; 2(2):4-31.
  13. Stice E, Shaw H, Marti CN. A meta-analytic review of obesity prevention programs for children and adolescents: The skinny on interventions that work. Psychological Bulletin. 2006;132(5):667-91.
  14. Dietz WH, Belizzi MC. Introduction: The use of body mass index to assess obesity for children. AM J Clin Nutr. 1999;70(1): 123s-5s.
  15. Grrow JS. Energy Balance and Obesity in Man, 2nd. Elsevier/North-Holland Biomedical Press; Amsterdam. 1978; Pp:225-32.
  16. Ayatollahi SMT, Carpenter RG. Height, weight BMI and weight-for-height of adults in southern Iran: how obesity should be defined? Annals of Human Biology. 1993; 20(1):13-9.
  17. Ayatollahi SMT. Obesity in school children and their parents in southern Iran. Int J Obes Relat Metab Disord. 1992;16(11): 845-50.
  18. Ayatollahi SMT. Sizes and obesity pattern of South Iranian adolescent females. Annals of Human Biology. 2003; 30(2):191-202.
  19. Ayatollahi SMT. Infants body mass index reference curves for Iran. Journal of Research in Medical Sciences. 2004;5(1): 22-7.
  20. Ayatollahi SMT, Heydari ST. Obesity indices among infants and their parents, Shiraz, Iran. Iranian Journal of Medical Sciences. 2004;29(4):161-7.
  21. Hosseini M, Carpenter RG, Mohamad K, et al. Standardized percentile curves of body mass index of Iranian children compared to the US population reference . Int J Obes Relat Metab Disord. 1992;23(8):783-6.
  22. Dorosty AR, Siassi F, Reilly JJ. Obesity in Iranian children. Arch Dis Child. 2002; 87(5):388-91.
  23. Cameron N. The Measurement of Human Growth. Bristol: Biddle Ltd. Guildford and King’s Lynn. 1984.
  24. Cole TJ, Freeman JV, Preece M. Body mass index reference Curves for uk, 1990. Arch Dis child. 1995;73(1):25-9.
  25. Cole TJ, Roede MJ. Centiles of body mass index for Ductch children aged 0-20 years in 1980- a baseline to assess recent trends in obesity. Ann Hum Biol. 1999; 26(4):303-8.
  26. Lake JK, Power C, Cole TJ. Child to adult body mass index in the 1958 British birth cohort: associations with parental obesity. Arch Dis Child. 1997;77(5):376-81.
  27. Healy MJR, Rasbash J, Yang M. Distribution-free estimation of age-related centiles. Ann Hum Biol. 1988;15(1):17-22.
  28. GROSTAT. A Programme for estimating age related distribution free centiles. 1988; London: London School of Hygiene and Tropical Medicine.
  29. Massa G. Body mass index measurements and prevalence of overweight and obesity in school-children living in the province of Belgian Limburg. Eur J Pediatr. 2002; 161(6):343-6
  30. Must A, Dallal GE, Dietz WH. Reference data for obesity: 85th and 95th percentiles of body mass index (wt/ht2) and triceps skin folds thickness. Am Clin Nutr. 1991; 53(4):839-46.
  31. Quek CM, Koh K, Lee J. Parental body mass index: a predictor of childhood obesity? Ann Acad Med Singapore. 1993;22(3): 342-7.
  32. Guo SS, Wu W, Chumlea WC, et al. Predicting overweight and obesity in adulthood from body mass index values in childhood and adolescence. Am J Clin Nutr. 2002;76(3):653-8.
  33. Cole TJ, Bellizzi MC, Flegal CM, et al. Establishing a standard definition for child overweight and obesity worldwide: International survey. BMJ. 2000;320(1):1-6.

© Copyright 2008 - TUMS PUBLICATIONS


The following images related to this document are available:

Photo images

[pe08006f2.jpg] [pe08006f1.jpg]
Home Faq Resources Email Bioline
© Bioline International, 1989 - 2024, Site last up-dated on 01-Sep-2022.
Site created and maintained by the Reference Center on Environmental Information, CRIA, Brazil
System hosted by the Google Cloud Platform, GCP, Brazil