 |
| About Bioline | All Journals | Testimonials | Membership | News |
|
||||||
|
||||||
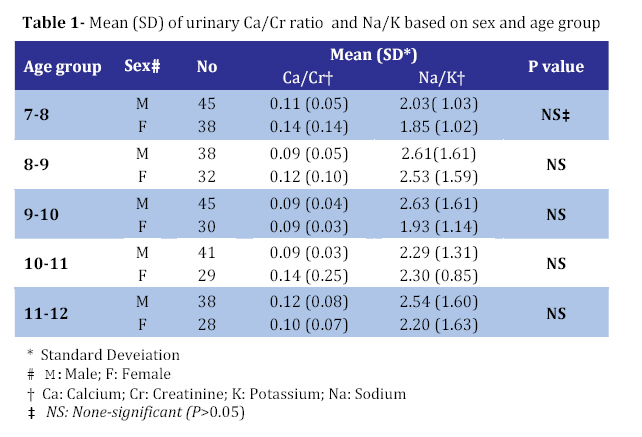
Iranian Journal of Pediatrics, Vol. 18, No. 3, Sept, 2008, pp. 263-266 Normal Values for Random Urinary Calcium to Creatinine Ratio in Iranian Children Ahmadali Nikibakhsh1, MD, Pediatric Nephrologist;Abolhassan Seyedzadeh2, MD, Pediatric Nephrologist; Hashem Mahmoodzadeh1, MD, Pediatric Nephrologist; Zahra Yekta1 , MD, Community Medicine Specialist;Mohammadtaghi Zadieh3, MD, Clinical Pathologist; Mohammad Karamyar1, MD, Pediatric Infectious Diseases Specialist; Ahad Ghozavi1, MD Resident in Pediatrics 1.. Department of Pediatrics, Urmia University of Medical Sciences, IR Iran Code Number: pe08041 Abstract Objective:Due to worldwide variations, reference values of urinary calcium to creatinine ratio in pediatric population are not yet well established. To determine normal values for urinary calcium to creatinine ratio and its relation to urinary sodium or potassium, a descriptive (correlation type) study was conducted in 7 to 12 years old healthy children in Urmia, Iran. Key Words: Urinary calcium; Urinary creatinine; Hypercalciuria; Urinary sodium; Urinary potassium Introduction Idiopathic hypercalciuria has been increasingly recognized as a cause of urinary tract complaints in clinical pediatrics. Clinical manifestations of hypercalciuria in children are gross or microscopic hematuria, renal calculi, dysuria, enuresis, osteopenia/rickets, sterile pyuria, renal colic, urinary frequency/urgency, short stature and polyuria[1]. Hypercalciuria is defined as urinary calcium excretion of >4 mg/kg/day. However, due to the difficulty of obtaining a 24h urine collection in children , a random urine calcium (UCa) to creatinine (Cr) ratio is routinely used in clinical practice to screen for hypercalciuria as it is found to have a good correlation with the 24h calcium excretion[2,3]. Traditionally, a UCa/Cr of 0.21 has been regarded as normal and suggestive of hypercalciuria[4]. However, due to worldwide variations, reference values for the pediatric population are not yet well established[5]. Several studies suggested that UCa/Cr value is dependent on age and geographic areas[2]. The variation in UCa/Cr values is believed to be due to differences in climate and exposure to sunlight[6], mineral composition of drinking water, nutritional habits, age, genetics and race[7,8]. On the other hand, Cirillo et al showed an association between high urinary sodium (Na) to potassium (K) ratio and increased risk of urolithiasis[9]. A direct correlation between UCa/Cr and UNa/K ratio in hypercalciuric patients has been shown by Osorio et al[10]. They suggested that increased potassium intake in hypercalciuric children has beneficial effect on UCa/Cr ratio and patient’s symptoms. We conducted this study to determine age–related reference values for UCa/Cr in healthy children of primary schools in Urmia city, North West of Iran and relationship between UCa/Cr and UNa/K in study population. Subjects & Methods During October and November 2005, children aged 7 to 12 years were selected from primary schools in Urmia city. Primary schools were divided into 2 sectors and 7 clusters including 4 clusters of primary school boys and 3 clusters of primary school girls. The subjects were randomly selected. Then, according to population of each cluster, children were randomly selected for study. In pilot study the range of Ca/cr ratio was estimated 0.42, therefore standard deviation was calculated about 0.07 (1/6 range). Significant level was 0.05. The sample size was about 147 (α=0.05, d=0.01, σ=0.07). Cluster effect was also considered (because of cluster sampling). The final sample size in our study consisted of about 364 subjects. Children who didn’t have any history of kidney or urinary tract diseases (according to a well designed questionnaire filled in by parents) and also proved normal by physical examination were included in the study as healthy children. The aim of the study was explained for subjects and their parents. The consent form was obtained from all participants. Random, non-fasting morning urine samples were obtained from each subject and sent to laboratory immediately. UNa and UK were measured by Flameependorf Efox 5054 automated analyzer. UCa was measured by manual colorimetric CPC method. UCa was measured by Jaffe method Using Hitachi 902 automated analyzer. UCa/Cr (mg/mg) and UNa/K (mEq/mEq) were calculated for each subject. For data analysis, mean and 95th percentile of UCa/Cr and UNa/K were used. Pearson test was used to determine any relationship between UCa/Cr and UNa/K values. For comparison of UCa/Cr and UNa/K values between males and females, Mann-Withny test was used. Data analysis was performed using SPSS version 13 software. Statistical significance was set at 0.05. Findings A total number of 364 children were enrolled in the study. There were 208 (57.1%) males and 156 (42.9%) females. Mean (SD) urinary Ca/Cr was 0.11(0.10). This value was 0.1 (0.05) for males and 0.12(0.14) for females. Ninety fifth percentile for UCa/Cr was 0.24 for study population, 0.22 for males and 0.28 for females. Mean (SD) urinary Na/K was 2.30 (1.42). This value was 2.42 (1.69) for males and 2.15(1.29 for females. Ninety fifth percentile for UNa/K was 5.21 for study population, 5.4 for males and 5.12 for females. There was no significant difference in UCa/Cr and UNa/k between males and females (P>0.05). Table 1 shows mean(SD of UCa/Cr and UNa/k based on sex and different age groups. The relationship between UCa/Cr and UNa/K was statistically significant (P<0.01). However, this correlation was weak (r=0.20). Discussion According to our study mean UCa/Cr in healthy primary school children in Urmia was 0.11 (0.10) and the 95th percentile was 0.24. We did not find any differences between males and females. Also, our study showed a weak relationship between UCa/Cr and UNa/K. The normal values for UCa/Cr are controversial issues. Esbjorner reported normal UCa/Cr as high as 0.44 in healthy Swedish children[11]. However, the age of children in his study (2-18 years) was different from ours. Whereas Ceran from Turkey reported UCa/Cr equal to 0.1[5], just similar to our study, Sorkhi’s study from north of Iran, showed higher values (0.155)[12]. However, one has to consider that weather and dietary habits in north of Iran are absolutely different from that of our region in north west of the country. On the other hand, Safarinejad reported extremely low UCa/Cr (0.04) in an Iranian healthy children population[13]. Although several factors including geographic location, genetics, nutritional habits, source of drinking water, season, exposure to sunlight and even environmental pollutants[14] have been postulated to explain these huge differences, apparently none of them can absolutely explain the reason for these differences. Strong direct correlation between UCa/Cr and UNa/K in hypercalciuric children has been demonstrated by Osorio et al[10]. Our study showed only a weak relationship between these two parameters. Although this correlation and also the clinical effect of higher UNa/K on increasing the risk of stone formation are well established by several studies, this correlation is minimal in normal individuals[2], our study population was normal too. This study was carried out in a single season. There are studies showing that urine calcium might be affected by seasons. Another important factor that must be considered in this study is uncontrolled nutrition habits of the participants. Conclusion The present study showed parallel to other studies that UCa/Cr values may differ according to geographic location. For screening of hypercalciuria, reference values of random UCa/Cr ratio should be determined in each geographic location. Acknowledgment Research Council of Urmia Medical University supported this study. We thank Emam Khomeini hospital laboratory personnel for their expert laboratory assistance. References
© Copyright 2008 - TUMS PUBLICATIONS The following images related to this document are available:Photo images[pe08041t1.jpg] |
| |||||||||
