 |
| About Bioline | All Journals | Testimonials | Membership | News |
|
||||||
|
||||||
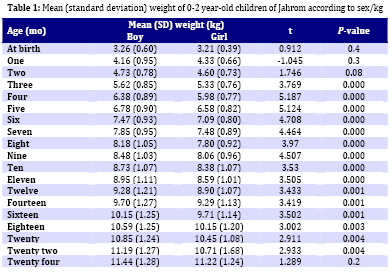
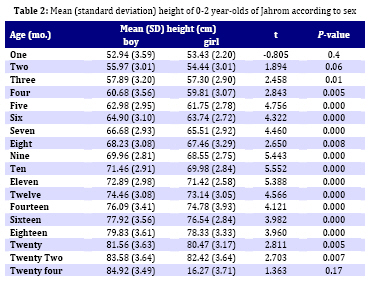
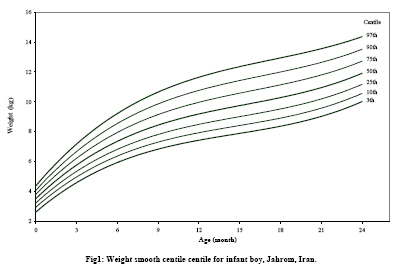
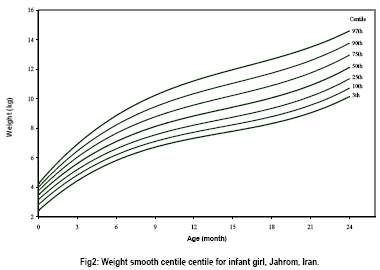
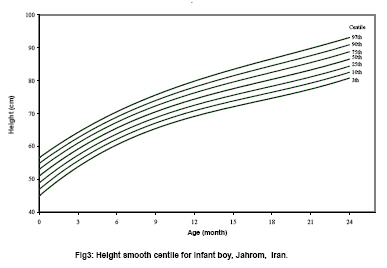
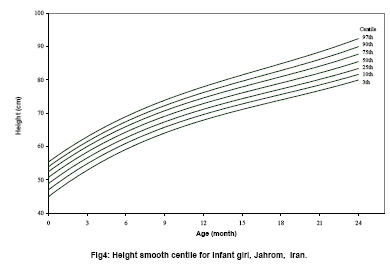
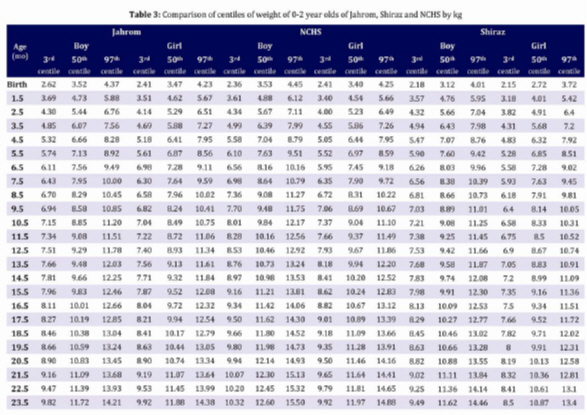
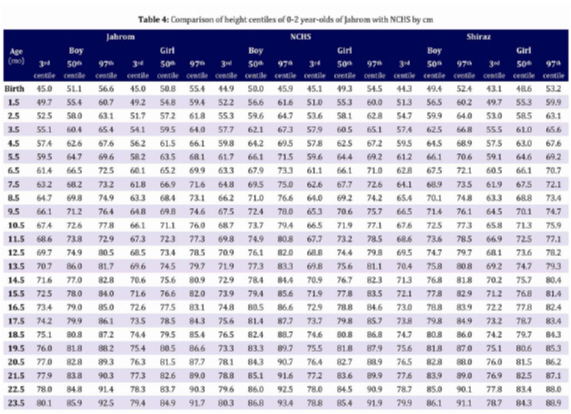
Iranian Journal of Pediatrics, Vol. 19, No. 1, March, 2009, pp. 25-34 Infants’ Growth Charts in Jahrom, Iran Seyed-Taghi Heydari1,2, PhD; Fatemeh Emamghoreishi3, MD; Mitra Amini4, MD 1. Gastroenterohepatology Research Center, Shiraz University of Medical Sciences, Shiraz, IR Iran Received: 17/11/07; Revised: 10/06/08; Accepted: 12/07/08 Code Number: pe09004 Abstract Objective: This study was performed to provide the curves of weight and height of 0-2 year-old children in Jahrom, Southeastern Iran. Key Words: Growth; Children under two-years; Height; Weight; NCHS Introduction Constant measurement and recording of height and weight on appropriate diagrams is essential for preventing growth abnormalities and treatment in appropriate time[1]. Therefore, the height and weight curves thus help determine the health status of children[2]. Nowadays, child growth is internationally recognized as an important publichealth indicator for monitoring nutritional status and healthin populations[3]. The major sources of growth evaluation include growth curves, most of which are adopted from the criteria of advanced western countries, such as England, Sweden or U.S.A[4-6] and introduced over 30 years ago[7]. Various studies in recent years showed that the growth pattern will change by time[8-9]. For instance, the mean height in 8-10 year-old Dutch children increased by 22 mm from 1965 to 1980[10]. Tanner et al in their study showed that the mean height in Japanese men increased by 4.5 cm and in women by 2.7 cm from 1957 to 1977[11]. Available curves based on the information about children in industrialized western countries could not be applied to other countries due to cultural, economic, social and traditional differences and the influence of genetic factors on the growth of people[12-14]. A suitable local measurement should be provided for growth monitoring in children for each region. Many studies on the height and weight of children were conducted in various cities of Iran such as Shiraz, Tehran, Isfahan and Mashad[15-19], using American and British growth curves to monitor the children' growth. This would impute Iranian children to be of low weight. It is therefore essential to evaluate growth of children in any area according to the measurements peculiar to that region[20,21]. The goal of this study was to provide the curves of weight and height for 0-2 year-olds in Jahrom, Southeastern Iran. Subjects and Methods In a prospective study, 597 children (391 boys and 206 girls) born in Jahrom entered our study from April 2001 to December 2002. A sample size of 259 cases computed in relation to correlation coefficient between obesity and weight[21], was adequate for the study. These children had no congenital anomalies and were referred to Jahrom Health centers, with a birth weight more than 2500 g, fetal age of 37-42 weeks. The height and weight of these children were recorded 18 times from one month to two years of age by trained personnel (every month, up to one year and two months to two years of age). The children's height was measured in supine position before walking and then, in standing position. Weight was measured with a precision of 10 g, and height and head circumference to 10 mm, were measured and recorded at the time of referral to the center. In order to fit appropriate models for infant growth, HRY method was used to estimate age related smoothed centiles[18]. This method makes no assumption about the nature of the measurement. It first assumes that the 50th measurement centiles can be expressed as a polynomial of degree q (q=1, 2, ...) in age represented by t (in case of weight for height t is taken as height). The first equation relates to the smoothed value of the 50th measurement centile, y50, that is: y50=a1t+a2t2+a3t3+... The second equation, refers to the other measurement centiles at any given age, and can be expressed in polynomials of standard normal deviate, z, in relation to the 50th centile, i.e. yi =y50+b0+b1z+b2z2+b3z3+... where yi is the 9th smoothed centile of the measurement and z the corresponding normal equivalent deviate (NED). In the second equation, if the measurements exactly followed normal distribution with standard deviation of SD (y), then b2=b3=...=0 and b1=SD (y). A term in z2 can account for skewness and in z3 for kurtosis. The HRY method does not assume that the coefficients b1, b2, b3, ... were fixed but allowed them to vary with age (t) so that the whole model after combining the terms in t0, t1, t2, etc. from the two equations, might be presented as yit=a0+b01z+b02z2+...+(a1+b11z+b12z2+...)t+(a2+b21z+b22z2+...)t2+ ... This method was implemented for the World Health Organisation as GROSTAT computer package[19]. Firstly, goodness of fit was assessed both graphically and numerically. Secondly, Z-scores (SD scores) of the measurements were calculated upon fitting smoothed aged related centiles. SPSS software version 11.5 was used for statistical analysis using t test and ANOVA. Findings This study comprised 597 children (391 boys and 206 girls) aged between 0 to two years. The mean age in 18 subjects is shown in Table 1 according to gender. The mean weight of male newborns, except those aged one month, was more than females. Before two months of age and among two year-olds, there was no significant difference between the weight of males and females. The mean height in 0-2 year-old newborns is shown in Table 2. The mean height of male newborns, except those aged one month, was more than females and this difference was statistically significant in newborns from 3 to 22 months of age (P<0.05). The polynominals for weight and height of boys and girls were of the order (3 3 3 2 0), (3 3 3 2 0) and (3 3 2 1 0), (3 3 2 2 1), respectively, where the first element was the degree of polynomials in age (p) and the rest the degree of constant (q0), linear (q1), quadratic (q2) and cubic (q3) polynomials in Z-score of the data. The smooth centiles of weight and height of male and female newborns are shown in Figures 1, 2, 3 and 4. The height of males and females showed an increase by age up to two years. The weight of males and females also increased by age but the rate of increase to six months was more than that of six months to two years of age. Tables 3 and 4 show the comparison between 3rd, 50th and 97th centiles of weight and height of children in this study and NCHS measurements. As seen in the tables, except for the birth time, the height and weight of those under two years were lower than NCHS standards. Discussion Regarding various anthropometric studies on children's growth in different regions, particularly in preschool age, it is necessary to conduct specific studies in each region because of genetic, nutritional, cultural and economic differences of each community[20]. World Health Organization suggested to evaluate the accuracy of using NCHS information and its application to communities with different genetic backgrounds[21]. The study of Kamal et al. in Qatar on 0-5 year-old children and comparing their results with NCHS showed that 11% of children suffered from dwarfism and 4.4% were underweight. The information obtained from present study showed the irrelevance of applicability of NCHS curve to our region. Also, a study carried out in Saudi Arabia in 2003 on 0-3 year-old children showed that children's growth measurements in Saudi were different from NCHS-based results and required different charts for each region[23]. This difference was observed not only in various countries, but maybe true in different regions of the same country and even different times of the same region due to the differences in nutrition and increasing awareness of people[24-27]. Comparative studies in Hong Kong in 1995 and 1975 showed changes in children's growth[28]. Different results have been obtained in the various studies in different regions of Iran. In this connection, a study conducted in Isfahan in 1997 showed the suitability of NCHS curve for children evaluation, but studies carried out in 1990-92 and during 1996 in Shiraz,Iran showed that all corresponding centiles were lower than that of NCHS[17,29]. Such differences in various regions of the world and NCHS was due to the variabilities in genetic and environmental factors[30]. In this regard, efforts were made to provide suitable growth curves for different races[31]. With regard to foregoing differences, extensive studies were carried out to prepare standard curves for many countries[23,32,33,34]. Studies on the height and weight of children in some countries showed higher or lower values compared with those of NCHS measurements[35-37]. The present study which was conducted in Jahrom (Southeastern Iran) in 2004 on children under two years of age showed that, although children's weight at birth was not different from NCHS, gradually their weight and height differ from that of NCHS measurements which were the same as those of the previous study in Shiraz[16]. All weight centiles in girls from six months and in boys from two months of age were lower than NCHS measurements, but the same as values reported from Shiraz (Table 3 and 4). The same difference was also true for height, whereas, all height centiles at birth were higher than NCHS measurements, but a reduction in height was found after one month of age, as all height centiles were lower than that of NCHS. The present study only included the infants born in Jahrom city, whereas a nationwide cohort study is needed for monitoring the growth and obesity in children. Conclusion According to the results obtained, height and weight in children under two years of age in Jahrom necessitated the setting up of a standard curve for this region. If NCHS measurements are used, some children may be considered thinner or shorter for no reason, demanding a local curve to be established. The local standard provided in this study can assess the growth both in clinical practice and public health programs in the country, and warrant a national study to be conducted periodically in order to standardize these results. Acknowledgment The authors would like to thank the office of Vice-Chancellor for Research of Jahrom University of Medical Sciences for financial support, the University Review Board for permission to this study and Dr. Mehdi Kabiri for editorial assistance. References
© 2009 by Center of Excellence for Pediatrics, Children’s Medical Center, Tehran University of Medical Sciences,All rights reserved. The following images related to this document are available:Photo images[pe09004t3.jpg] [pe09004f4.jpg] [pe09004f2.jpg] [pe09004f1.jpg] [pe09004f3.jpg] [pe09004t2.jpg] [pe09004t1.jpg] [pe09004t4.jpg] |
| |||||||||