 |
| About Bioline | All Journals | Testimonials | Membership | News |
|
||||||
|
||||||
Iranian Journal of Pediatrics, Vol. 20, No. 3, July-September, 2010, pp. 284-290 Increasing Low Birth Weight Rates: Deliveries in a Tertiary Hospital in Istanbul Yasemin Akin1, MD; Serdar Comert1, MD; Cem Turan,2 MD; Orhan Ünal2, MD; Abdülkadir Piçak1, MD; Lale Ger1, MD, and Berrin Telatar1, MD 1Department
of Pediatrics, Dr. Lütfi Kırdar Kartal Training and Research Hospital,
Cevizli, Istanbul, Turkey Received: Aug 18, 2009; Final Revision: Jan 16, 2010; Accepted: Feb 10, 2010 Code Number: pe10042 Abstract Objective: Prevalence
of low birth weight deliveries may vary across different environments.
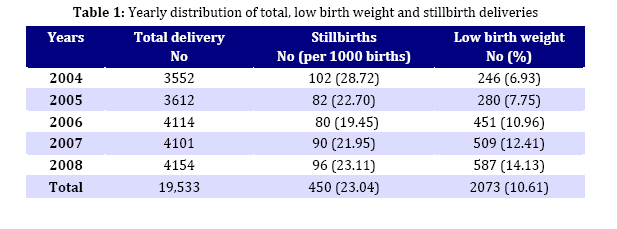
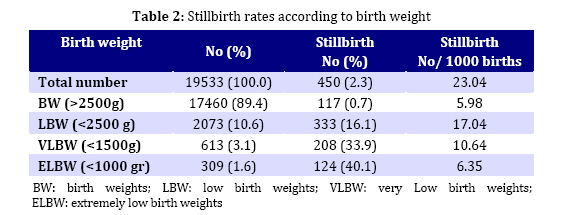
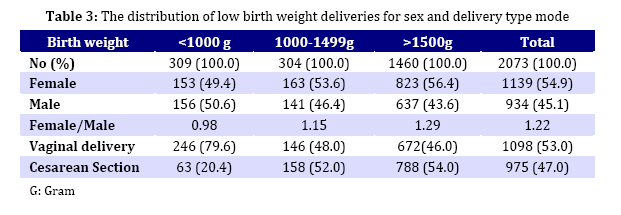
The necessity of determination of regional data prompted this study. Key Words: Infant; Newborn; Low Birth Weight; Very Low Birth Weight; Stillbirth Introduction In both developed and developing countries, low birth weight is an important factor that effects neonatal mortality, and infant and childhood morbidity[1,2]. Considerable attention has been focused on the causal determinants of birth weight, and especially of low birth weight (LBW), defined by World Health Organization (WHO) as birth weight less than 2500g. Below this value, birth weight specific infant mortality begins to rise rapidly[2,3]. LBW infants carry a forty-fold increased risk of death than normal birth weight babies[1]. WHO estimate that more than 20 million infants worldwide are born with low birth weight, and this constitutes 15.5 per cent of all births. More than 95 per cent of LBW infants are born in less developed countries[4,5,6]. Beside its critical role in aggravating perinatal mortality rates, LBW is a reliable indicator in monitoring and evaluating the success of maternal and child health programs[7]. Additionally, it is believed that, LBW may be a predisposing condition for adult diabetes, hypertension and coronary heart disease[1]. Each year approximately 10 million children under the age of five die, globally[8], yet most are overlooked by national health-information systems. Almost 40% of all deaths in these children occur in the first month of their life, and 30% in the first week. Until recently, most attempts to improve information about child deaths focused mainly on the postnatal period[9]. Stillbirths have not been as well studied despite the fact that more than 3 million stillbirths occur annually (WHO report this number to be 3.3 million in 2005)[3,4]. The estimated stillbirth rate for the developed countries is 5.3 per 1000 deliveries while in developing countries it is 25.5 per 1000[3,9]. In the study of Erdem[10], evaluating perinatal mortality in Turkey, stillbirth rate was found to be 18 per 1000 deliveries. The relation between LBW and stillbirths usually goes unrecognized. Fetal growth restriction and LBW are both important factors for stillbirth[1]. Although LBW seems to be a universal problem across less developed countries, striking regional variations exist. Determinants of LBW may vary across different settings and there is need for analysis within different environments[6]. This paper attempts to overview local LBW and stillbirth trends in Dr Lütfi Kırdar Kartal Training and Research Hospital, also considering, the relationship of sex, maternal age and mode of delivery to these variables. Subjects and Methods This is a retrospective study on local LBW and stillbirth delivery trends over five years. It was carried out at Dr. Lütfi Kırdar Kartal Training and Research Hospital, which is one of the largest tertiary care state hospitals, located on the suburbs at the Asian side of Istanbul, with a Neonatal Intensive Care Unit (NICU) of 25 beds. It is a teaching hospital frequented by the local population, which not only live in its immediate surroundings that took a lot of migration over the last few decades from all over Turkey, but also share an under-privileged socio-economic background. The information regarding the deliveries between January 1, 2004 - December 31, 2008 at the hospital were all collected from delivery registry records of the Obstetrics Departments. Birth weight, sex, maternal age and the baby’s vital status at delivery as well as the mode of delivery were recorded and evaluated. This study was approved by Local Institutional Ethics Committee. WHO define viability as a birth weight of at least 500g, at the gestational age of at least 20 weeks[11]. Eligibility criteria on the inclusion of subjects of this study were based on this definition. A stillbirth was defined as: intrauterine death of a fetus weighing at least 500g after 20 completed weeks of gestation occurring before the complete expulsion or extraction from its mother[11,12]. Birth weight was defined as the first measurement of body weight, usually in the first hour of life measured to the nearest gram. A low birth weight (LBW) infant was defined as an infant weighing less than 2500g at birth irrespective of gestational age. Infants whose birth weight was less than 1500g and 1000g were evaluated as “very LBW”(VLBW) and “extremely LBW”(ELBW) respectively[1,4,8]. The frequency of ELBW and VLBW births was determined in LBW newborns. LBW babies were further grouped into <1000g, 1000-1499g and ≥1500 g, each group having been compared for different parameters. The dependence of LBW on stillbirth rate, sex, maternal age and the mode of delivery was also evaluated. In assessing the maternal age, we attempted to look into a direct relationship between maternal age and LBW, by forming 3 age groups: Group I (<18 years of age), Group II (18-35 years of age) and Group III (>35 years). Within each group, LBW and the ≥2500g babies were compared in terms of the relationship between birth weight and maternal age. Statistical calculations were performed with NCSS 2007 program for Windows. Beside standard descriptive statistical calculations (frequencies, mean and standard deviation), one way ANOVA was used in the comparison of groups, and Chi square test was performed during the evaluation of qualitative data. For the comparison of maternal age and the weight of the newborns, one way ANOVA and unpaired t test were performed. Statistical significance level was established at P<0,05. Test results were evaluated within a 95% Confidence Interval (CI95%). Findings In a period of five years, among 19,533 total births, the number of live-births was found to be 19,083. A total of 450 deliveries (23.04 per 1000 births) were stillbirths (Table 1). Total number of LBW deliveries was 2073 (10.61%). As shown in Table 1, the rate of LBW deliveries increased between 2004 (6.93%) and 2008 (14.13%). This increase in the yearly distribution of LBW deliveries during the study period was found to be statistically significant (P<0.001)(Table 1). LBW deliveries were grouped as VLBW and ELBW. The distribution of those and the stillbirths according to birth weight are shown in Table 2. The prevalence of VLBW and ELBW was found to be 29.6% and 14.9% of the total LBW deliveries respectively. Stillbirths: Out of 2073 LBW deliveries, 333 (16.06%) were stillbirths. On the other hand, 74% of all the stillbirths were LBW deliveries. The rate of stillbirths who are LBW and ≥2500g was 16.06% and 0.67% respectively. The stillbirth delivery rate in LBW infants was significantly higher than those with birth weight ≥2500g (P<0.001). That is to say, the risk of stillbirth delivery among LBW infants was 28.37 (OR: Odds Ratio) times higher than the ≥2500g birth weight infants (CI95%=22.85-35.22). As LBW infants were grouped into three and compared, the rate of stillbirth deliveries was statistically higher for <1000g and 1000-1499g newborns than those ≥1500g (P<0.001). After the comparison of each of the three LBW groups against newborns with birth weight ≥2500g: the odds ratio of stillbirth deliveries in the <1000g, 1000-1499g and >1500g birth weight groups were 99,87 (CI95%=74.62–133.7), 56.59 (CI95%= 41.5–77.1) and 13.87 (CI95%=10.72–17.97) respectively. This shows that the risk of stilbirth deliveries increased with decreasing birth weight. Sex: Within a five-year study period, of the total 19,533 deliveries, 9288 (47.55%) newborns were females and 10,245 (52.45%) males. Male/female ratio was 1.1. The sex distribution of LBW deliveries is shown in Table 3. The proportion of the female deliveries were significantly higher than the males in the LBW group (P<0.001) (Table 3).Of the VLBW neonates 316 (51.55%) were female, whereas 297 (48.45%) were male. The female/male ratio was 1.06. The sex distribution of ELBW infants are shown in Table 3. Statistical analysis of the (LBW) newborns with regard to sex and birth weight, did not present any significant difference (P=0.07) in comparison, in none of the three groups. Among the 333 LBW stillbirth deliveries there were 170 females and 163 males. The comparison of stillbirths versus live-borns in terms of sexual distribution in the LBW group, presented no statistical significance (P=0.1). There were 58 males and 66 females weighing <1000g, as well as 39 males and 45 females weighing 1000-1499g, and 66 males and 59 females weighing ≥1500g. No statistical difference was found in the <1000gr and 1000-1499g stillbirths with regard to the sex (P=0.2, P=1), while the ratio of male stillborns was significantly higher than the females (P=0.03) for the newborns weighing ≥1500 g. Maternal age: The mean maternal age of the ≥2500g birth weight group was 26.58±5.54 years (range 15-45 years) and of the total of the LBW group 27.02±6.1 (r: 13-53) years. The mean maternal age of the VLBW group and ELBW deliveries was 27.3±6.15 (r:13-53) years and 27.3±6.36 (r:13-53) years respectively. Regarding the relationship between maternal age and birth weight no statistical difference was reached comparing the LBW infants with those ≥2500g (P=0.1). When LBW groups with birth weights <1000g, 1000-1499g and ≥1500g were each compared with the ≥2500g group, no statistical difference was found either (P=0.2). When mothers as a whole, were grouped into three as follow: <18, 19-35 and >35 years of age, LBW delivery distribution were 4.5%, 85%, 10.5% respectively. Similarly, no statistical difference was found for the comparison of the mothers of those ≥2500g versus the LBW deliveries (P=0.07). Mode of delivery: Among the 19,533 deliveries the mode of delivery in 5831 (29.85%) was cesarean section (c/s). The rate of c/s among LBW infants was 47%. The rate of c/s for <1000g, 1000-1499g and ≥1500g deliveries were respectively 20.4%, 52%, 54% (Table 3). Regarding the mode of delivery, for those <1000g, the frequency of the c/s was significantly lower than for the other two groups (P<0.001). Within 2073 LBW born between 2004–2008, the number of newborns from multiple pregnancies (n: 341, 16.4%) delivered in each year was: 45 (18%), 39 (13.9%), 77 (17%), 78 (15.3%), 102 (17.4%) respectively. Discussion Low birth weight is one of the most important determinants of perinatal mortality and morbidity in both developing and developed countries[1,13] and its prevalence widely varies. The fetal growth and birth weight shows a degree of variation from country to country and even from a region to other within the same country[4,14]. Therefore it is essential to have data on local patient population. In USA and England, LBW rates have been reported to be 7.7% and 7.8% respectively,[15,16] and from Korea to be 7.2%[2]. The prevalence of LBW is nearly 50% in South Asia whereas it’s reported to be 31% to 47% in Bangladesh[6,14,17]. In Turkey, the prevalence of LBW was 17% in 2001 according to the findings of the Turkish Neonatal Society[18]. We have found that, LBW rate in this study to be 10.6% of all deliveries. Even though our finding seems to be lower than the nationwide rate, it is quite similar to the rate of 9.14% reported in 2006 by Altuncu et al[19] from the European side of Istanbul. As the most populated city in Turkey where the health facilities are the most pronounced, it is only natural that the LBW rates in Istanbul are lower than the national rate, but, still higher than those reported by the developed countries. Furthermore, according to the National Vital Statistics Report of the United States[15] VLBW rates were 1.46%, Shin et al[2] from Korea reported as 1.4%. VLBW rates in this study (3.14%) are higher in comparison. Goldenberg[1] and Martin[15] reported an increase in LBW rates in USA. Between 1990 and 2002, preterm and LBW rates have risen by 14 % and 11% respectively and the very low birth weight rate (VLBW) has increased from 1.27 to 1.46 percent[15]. This small, but steady increase in the LBW and VLBW rates was attributed to the increase in multiple pregnancies due to assisted reproductive technologies. The increase in LBW deliveries in our hospital also is striking, despite the fact that we have not had any statistical increase in multiple pregnancies from assisted reproductive technologies (Our hospital is not a center for Assisted Reproductive Technologies, either). This rise could be explained via the under-privileged socio-economic background of the parents, as well as an overcrowding in the suburban region from which most of the patients come from. Yet, such an explanation is beyond the limits and scope of this paper. Such an analysis, though, would appropriately be the subject matter of yet another scientific study, be it social or medical. While the stillbirth rate in developed countries is reported to be 3-7 per 1000 births, it is more than 30 per 1000 births in developing countries[1]. In a prospective study conducted by Erdem[10] throughout Turkey, stillbirth rate was 18 per 1000 deliveries in 1999. Some other researchers from Turkey reported regional stillbirth rates. Kale et al[20] from Diyarbakır in Southeastern Anatolia region, reported a stillbirth rate of 49 per 1000 births, while it was found to be 40 per 1000 births by Serin et al[21] from Eastern Anatolia (Turkey is divided into seven census-defined geographical regions, serving to statistical purposes). Although the stillbirth rate of 23.04 per 1000 births found in this study was higher than the rates of developed countries, it’s much lower than the results of these two studies conducted in regions that have, on average, less developed health care facilities. The number of routine visits during pregnancy, optimum management of high risk pregnancies affects the rate of stillbirth and may be an explanation for this discrepancy. Goldenberg et al[1] state that, especially the LBW infants comprise two-thirds to three quarters of all stillbirths. In accordance with Goldenberg et al[1], in this study we have found that 74% of stillbirths were LBW and the risk of stillbirth in LBW infants was found to be statistically higher than >2500gr infants. In contrast to the findings of this study, Feresu et al[12] from Zimbabwe reported that 16% of their stillbirths were LBW. Since fetal growth restriction and preterm birth are important risk factors for stillbirth, in order to decrease stillbirth rates, efforts should be aimed at reducing LBW deliveries. Among 108,486 live births, Shin HM et al[2] showed that 52% were males. In the same study, LBW rate was statistically higher for females. Similarly, although this study also showed male predominance in all deliveries, the probability of the birth of a female infant was significantly higher in LBW group. Moreover, similar to the study results of Shin et al[2], we could not find any gender predominance among VLBW and ELBW deliveries. The relation of LBW and maternal age is well documented in many studies. Shin et al[2] and Hosain GM et al[6] showed that maternal age and birth weight were strongly related and infants born to older mothers were heavier. The results of this study were not in parallel with those of the two above-mentioned studies. Kayastha et al[7] reported that the prevalence of LBW among teenage mothers was only 6.3%, contradicting with the assumption that maternal age is a determinant factor of birth weight. We have found the rate of LBW deliveries under the maternal age of 18 years as 4.5% and similar to the conclusion reached by Kayastha et al[7], we could not find any statistically significant relation between maternal age and birth weight either. Although there are several studies from Turkey on LBW and stillbirth rates[10,19-22], this is the first time any data is gathered pertaining to both LBW and stillbirth rates on a local basis in Istanbul. Furthermore, the infant population upon which the research data is collected comprises the largest single-center research and the most up-to-date of any case study so far from Turkey. The aim of this study is merely to contribute to the literature on the topic by emphasizing differences between various surroundings, and updating on the local LBW and stillbirth rates, as this study represents the local population. Although the suburbs where our hospital is located at, took a lot migration from all over Turkey over the last few decades, it would be misleading to argue that its results are equally representative of or applicable to the whole of Turkish population. In other words, the results of this one center study should not be generalized for the whole region or country. Conclusion Low birth weight and stillbirth rates provide important clues on the status of public health in a given area. They also hint at potential precautions that could be taken to minimize the consequences. While in industrialized countries, the epidemiology of LBW has been extensively studied, in less developed countries reliable data remains limited. This is why the findings of this study are important: even though the LBW and stillbirth rates found are lower than that of most other developing countries, there seems to be a slow but steady increase over time in our district. Without taking proper precautions, it is inevitable that neonatal mortality and morbidity rates will eventually tend to rise. We encourage parallel studies to be made in various regions comprising multiple socio-economic backgrounds, so that comparative analyses could be made with newfound results and their general evaluation. Furthermore, we look forward to a closer involvement of public health services in the area, both official and otherwise, especially concerning prenatal maternal care. Early identification and treatment of the risk factors for stillbirth and LBW deliveries, especially those that are preventable, are indispensable to alleviation. Acknowledgment The authors wish to thank Ms Deniz Gözler for her linguistic editing, research nurses Ayla Kurt and Emriye Tercan Tarakçı for their contribution in collecting data, and Ms Rana Konyalıoğlu for the statistical evaluations. Conflict of Interest: None References
Copyright 2010 - Iran Journal of Pediatrics |