
|
Indian Journal of Pharmacology
Medknow Publications on behalf of Indian Pharmacological Society
ISSN: 0253-7613 EISSN: 1998-3751
Vol. 36, Num. 1, 2004, pp. 15-19
|
Indian Journal of Pharmacology, Vol. 36, No. 1, Feb, 2004, pp. 15-19
Economic analysis of drug expenditure in government Medical College hospital, Nagpur
V. R. Thawani, A. V. Turankar, S. D. Sontakke, S. V. Pimpalkhute, G. N. Dakhale,
K. S. Jaiswal, K. J. Gharpure,* S. D. Dharmadhikari**
Department of Pharmacology, *Pharmacist, **Chemist, Government Medical
College, Nagpur -440003, India.
Correspondence to: V. R. Thawani, 14-A, Jeevan Jyoti, Clarke Town, Nagpur
- 440004, India.
E-mail: thawani_ngp@sancharnet.in
Received: 11.3.2003
Revised: 15.9.2003
Accepted: 20.9.2003
Code Number: ph04005
Abstract
Objective: To conduct the economic analysis of drug
expenditure in the Government Medical College Hospital, Nagpur and to identify
the categories of drugs needing stringent management control.
Material and Methods: A matrix based on the coupling of cost (ABC) analysis
and vital/essential/desirable (VED) criticality analysis was formulated for
prioritization, to narrow down the group of drugs requiring greater managerial
monitoring. The difference between actual expenditure and the inflation factor-derived
expenditure was found. Expenditure for forthcoming years was forecasted by
regression analysis using NCSS software.
Results: The annual drug expenditure was found to be
only 11.59 % of the total hospital budget. The division of the drug inventory
into two priority categories resulted in identifying the priority I drugs (56)
for stringent control. The percentage cost of each drug helped in determining
the economic order quantity and the schedule of placing the purchase orders
for drugs of high value but low criticality. Using the cost inflation index,
it was observed that the overtly seen increase in annual drug expenditure was
just 2.84% when the inflation factor-based expenditure was derived.
Conclusion: Categorization of drugs by the ABC-VED
coupling matrix model helps to narrow down on fewer drugs. The application
of the cost inflation index justified the increased annual budget.
Key Words: ABC analysis, VED analysis, ABC-VED matrix,
drug inventory management.
Introduction
About one-third of the annual hospital budget is spent on
buying material and supplies, including medicines.1 A study from
a 1500-bedded, state-funded, teaching hospital, like ours, has claimed that
review and control measures for expensive drugs brought about 20% savings.2 It
has been suggested that with six months of data, the performance and functioning
of a current inventory system can be estimated.3
Cost analysis (ABC analysis) has been found to be effective
in the management of a medical store.1 In this, 10% items consume
about 70% of the budget (Group A). The next 20% inventory items take away 20%
of the financial resources (Group B) and the remaining 70% items account for
just 10% of the budget (Group C). With the use of ABC, costing was found to
be more detailed and precise and overhead costs diminished drastically.4 Among
various inventory control models, Economic Order Quantity (EOQ) has been commonly
used,
which attempts to balance the carrying cost of inventory
with the cost of running out of an
item.5 EOQ in conjunction with ABC has been proposed to be effective
and
efficient.6 Most of the savings with the ABC-EOQ were reported with
the low-value items (B and C items) which were being purchased
too frequently.7 Automated capital budgeting systems have been claimed
to reduce capital spending by identifying
utilization trends.8 Analysis based on the vital, essential and desirable
(VED) criticality need of drugs has been commonly used in hospital inventory
management.
Drug inventory management stresses on cost containment and
improved efficiency. Continuous quality management in medical stores strives
not only for the absence of adverse events but also for the extension of ever-increasing
value-added services. We undertook this economic analysis of drug expenditure
to identify areas for further improvement as well as to find corrective interventions.
Our team effort simultaneously served the purpose of data retrieval, compilation,
entry and storage in the process of the computerization of medical
stores. The exercise lasted for more than a month, since all the
hard data had to be first fed into the computer and then
processed to generate the desired information.
Inventory analysis seeks to achieve maximal output with minimal
investment input, based on the economic principle of stretching the limited
means to meet unlimited ends. We attempted to narrow down the areas, where
management supervision and control measures are needed for optimal utilization
of the available resources. To achieve this end result, the economic analysis
of drug expenditure for the last completed financial year, 2001-2002,
of the Government Medical College Hospital, Nagpur was undertaken. This exercise
had the following broad objectives:
- Analysis of the annual drug expenditure (ADE) using ABC
and VED analysis.
- Evolution of the priority system based on the ABC VED matrix.
- Identification of the drug categories requiring greater
supervisory monitoring.
- Application of the Cost Inflation Index (CII) to find the
influence of inflation on ADE.
- Comparison of the actual ADE with indexed cost to know
the variation.
- Assessment of the expenditure for the current financial
year (FY) using regression analysis.
- Suggestion of measures for quality improvement.
In this report, we present the ABC analysis in an unconventional
way, with explanation for the variation from routine expression.
Material and Methods
The data of annual hospital expenditure (AHE) of our 1400-bedded
hospital was obtained from the office of the Superintendent of the hospital.
The annual consumption of each drug and the expenditure incurred thereon were
calculated from the records of the Medical Stores. ABC cost analysis of all
the drugs in the inventory was done.9 For this the ADE of individual
drugs was arranged in descending order and then cumulative cost calculated.
The cumulative total being 100% of ADE, percentage spent on each drug was found.
Then this list was divided into three groups based on cumulative cost, sequentially.
Roughly, 10% drugs consuming about 70% of ADE constituted Group A, 20% drugs
consuming nearly 20% value made up Group B, and the remaining 70% drugs consuming
about 10% of ADE formed Group C. The cutoffs were not exactly at 10/20/70%
and differed marginally, which is permissible.10
The VED criticality analysis of all the drugs was done to
classify the drug inventory into vital (V), essential (E), and desirable (D)
categories.11 The drugs from the hospital formulary, critically
needed for the survival of the patients, which must be available in the hospital
at all times, were included in the vital category. Drugs with a lower criticality
need, which may be available in the hospital, were included in the essential
group. The remaining drugs with lowest criticality, the absence of which will
not be detrimental to the health of the patients, were included in the desirable
group. The VED status
of each drug was discussed / debated with justification by
the study group till a collective consensus was reached. Thus,
all drugs in the medical stores list were included in the V, E or
D category.
Then a matrix was formulated by combining the ABC and VED
analysis to evolve a management system, which can be used for prioritization.
From the resultant combination, we prioritized two categories to direct the
supervisory monitoring. Category I was the high priority group, needing greater
attention, comprising the AV, AE, AD, BV, and BE groups of drugs. Category
II of lower management priority constituted drugs belonging to the BD, CV,
CE and CD groups of drugs. Whereas the first alphabet denotes its place in
the ABC analysis the second one stands for its place in the VED analysis.
Cost inflation index (CII) as determined by the Government
of India12 was applied as suggested13 to find the indexed
cost of acquisition14 of annual drugs. The difference between the
actual ADE and the derived indexed cost was calculated and the percentage difference
found.15 Linear regression function (NCSS software) was used to
assess the expenditure for the forthcoming years.
Results
The AHE of our hospital, with annual OPD attendance of 6,69,085
and 73,592 indoor admissions, during the financial year 2001-2002 was Rs. 27,18,63,746
out of which ADE was Rs. 315,00,749 which is about 11.59 % of the AHE. The
drug expenditure includes indoor use as well as outdoor dispensing which is
usually done for 3 days, except in specialty clinics (diabetes, cardiology,
tuberculosis, psychiatry, epilepsy and ANC) where patients are dispensed drugs
for 15 days per visit.
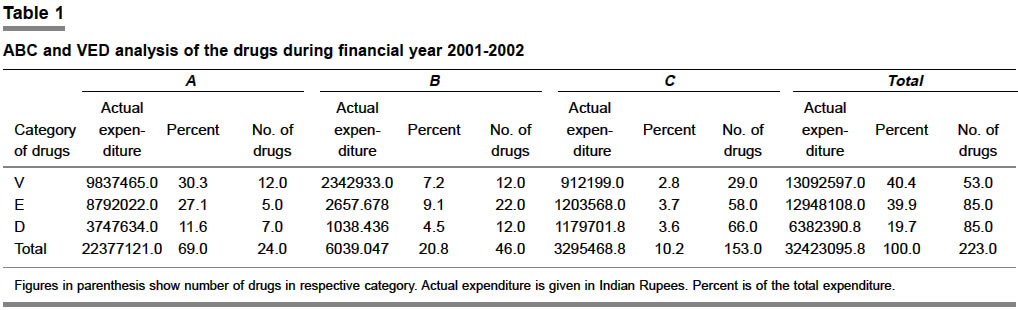
Table 1 shows the split of the ADE incurred on ABC and VED
categories of drugs.
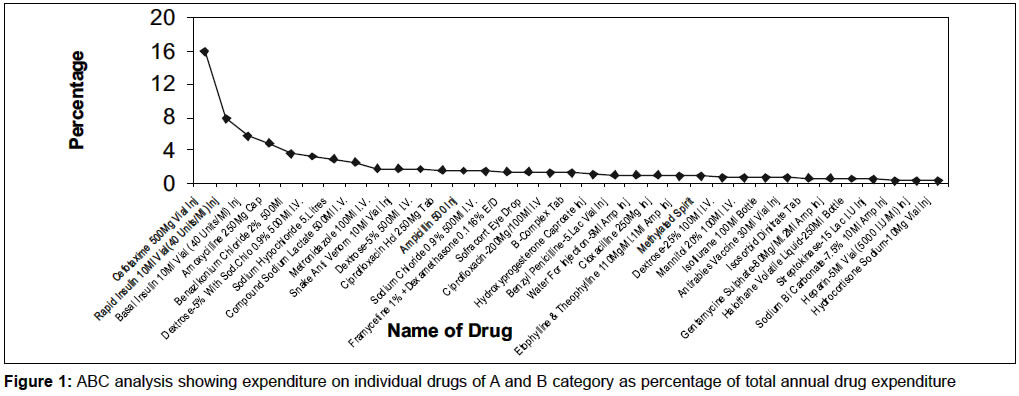
Figure 1 gives findings of the ABC analysis in which the percentage
cost of individual drugs with respect to ADE has been shown. It can be appreciated
that the obtained curve is concave as against the conventional plotting of
the cumulative cost which is convex and does not show individual drug expenditure
as a percentage of the total, which is the advantage with the variant used
by us.
Inflationary economy progressively reduces the purchasing
power of the currency. Hence mere increase in ADE does not reflect the true
expenditure on drugs since the value for money (VFM) is lower as compared to
previous year. Due to inflation, the same quantity of drug will cost more in
the subsequent year, unless the cost of drug comes down, which is rare. The
application of CII overrides this fallacy, justifying increased ADE. Hence
the indexed cost of acquisition of the drugs by applying the index factor was
calculated for FY 2001-02 using the following expression14 with
the previous year's ADE as baseline:
The ADE for 2000-01(considered as base) being Rs. 307,79,353;
Index factor for 2001-02 being 42612 and that for
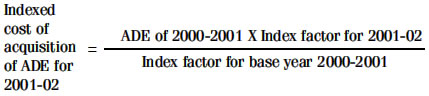
2000-01 being 40512, the derived indexed cost of
acquisition of drugs for 2001-02 comes to Rs. 3,23,75,319 and the difference
between actual ADE and indexed cost is (3,15,00,749 - 323,75,319) 8,74,570.
Thus after inflationary correction, the actual ADE of FY 2001-02 was just 2.84%
higher than that
of the previous year.
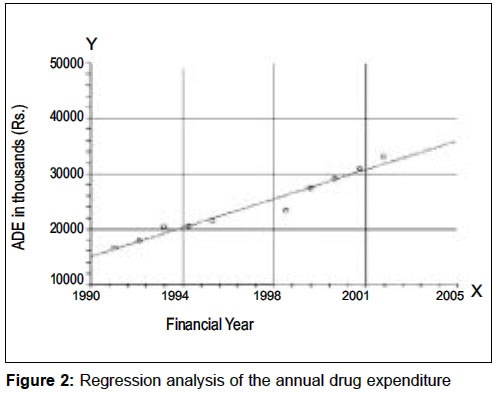
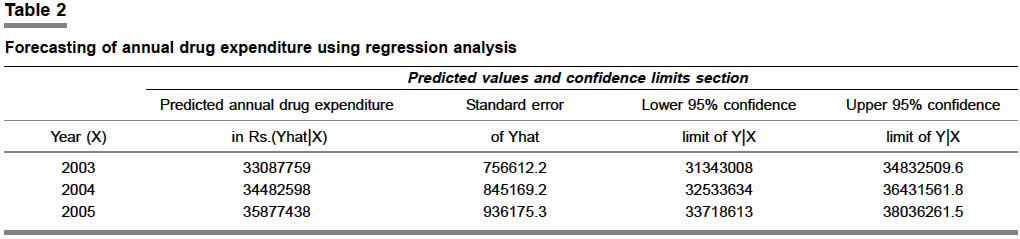
Figure 2 shows the actual ADE in Rs from 1990 to 2002 and
also forecasts the ADE for forthcoming years till 2005, using the linear regression
function of NCSS software. The forecast of ADE from 2003 to 2005 along with
upper and lower confidence limits has been shown in Table
2.
Discussion
In spite of Internet search on multiple engines, we could
not find any matching study, hence our data lacks the opportunity for comparison.
We found that the ADE for the year under study was 11.59%
of the AHE in our hospital, which is lower than the reported range of 25 to
45% in other studies.1,16
In material management "cost/use variance" software,
can find out whether increase in inventory costs is due to higher vendor costs
or due to expanded use of products, and
what percentage each
represents.3 Here too the natural extension is ABC analysis, to identify
the groups deserving more or less intense management. The combination of two
systems like ABC-EOQ has been tried by
some.6,7 A multi-unit selective inventory control three-dimensional
(MUSIC
3D) approach has been advocated.17 This approach considers criticality
of the usage, consumption value and lead-time in supply; with each factor having
two variantscritical and non-critical usage, high and low consumption and long
and short lead-time, respectively. This approach may be suitable for material
management in general but does not seem good for drug management. In case of
drugs, besides the criticality factor, the cost factor also must be taken into
consideration, as can be seen from our study, where about 10% of the drugs consumed
about 70% of the drug budget. This is the group requiring greater monitoring
because it has fewer drugs consuming most of the drug budget. We also noted that
not all the drugs in this group were vital or essential. It also had drugs from
the desirable category like benzylkonium chloride, ciprofloxacin tablet, framycetin+dexamethasone
eyedrops, B-complex tablet, cloxacillin injection, etophylline+theophylline injection
and purified chick embryo cell rabies vaccine. Thus it was realized that merely
cost or criticality factor could not be the basis of our classification of the
drug inventory.
The cost factor is important for us since Governmental hospitals
have to manage the year-round performance in allocated budgets, sanctioned
in advance, which is a tightrope walk. Most of the drugs used in the hospital
have to be either purchased from the companies, which have entered into rate
contract with the Maharashtra Government for a specified period of supply or
from the Governmental firms producing these drugs. This system selects the
lowest bid from the approved bidders with applicable terms. Thus there is hardly
any freedom for us in selecting the supplier of the drug. Autonomous hospitals
have the advantage of being the decision-makers in determining the source of
supply and therefore exercising price/ supply period control.
Having considered various options, we found that cost as well
as criticality of the usage of the drug was paramount to us. Hence we derived
the matrix by coupling of ABC and VED for drug inventory, which has been implemented
successfully in our hospital. We found that after the introduction of this
system, there was noticeable improvement in the inventory as well as financial
management. With improved monitoring and control there was a reduction in expenditure
and an improvement in the availability of the drugs. Improved availability
resulted in substantial decrease in emergency local
purchases.
For drug inventory if we consider ABC analysis alone, we will
effectively control the recommended 23 drugs from Group A, but will be compromising
on the availability of drugs of a vital nature from B and C categories (12+29).
Similarly if only VED analysis is considered, ideal control can be exercised
on the identified vital and/or essential group. But we found that our Group
A also contained seven desirable drugs. Hence it was not possible to ignore
the desirable group totally. If we consider both A as well as V group of drugs i.e. AV,
AE, AD, BV and CV, we would have to concentrate on 64 drugs for vigilance.
However, if the suggested ABC-VED coupling matrix model is used for prioritization,
with focus on the matrix group of drugs consuming more than 5% of ADE, we can
narrow down to AV, AE, AD, BV and BE i.e. 56 drugs in our case, which
is more rational for repeated order placement and effective vigilance.
According to Government of Maharashtra directives, we hold
three months stocks of all the drugs in medical stores. Thus for us order placement
is more or less a quarterly affair, initiated a fortnight in advance to cover
the processing time. The exception to such order point of three and half months
is in the case of drugs with seasonal variation in drug consumption like antimalarial,
antidiarrheal, anti snake venom, to name some. The CV group with 29 drugs consumed
merely 2.9% of the annual budget (Table 1). This contains drugs of low cost
but high criticality. We suggest that these can be procured once a year and
shelved to save management efforts, ensure year-round availability, and avoid
stock-outs, without locking substantial capital in the stock-carrying cost
and this would mean less loss to the government even if these expire. This
is possible for the drugs where there is not much change in the pattern of
usage and which have shelf life. Annual change in the pattern of usage is considered
at the end of the FY when drug formulary is updated with the incorporation
of new drugs on the rate contract list. Group AD, which has just 7 drugs but
consumes a significant budget of about 11%, should be monitored for EOQ and
order placement must always be justifiable and rational for its constituent
drugs.
To decide the EOQ and the time of order placement, the economic
picture of each drug can be speedily sighted by viewing the percentage cost
of each drug with respect to ADE. The cumulative cost expressed in conventional
ABC analysis projection does not give information about the actual amount consumed
by individual drugs. The concave graph, as used by us, has that advantage;
hence we recommend that the ABC analysis be expressed as actual percentage
of the total ADE.
One of the secondary objectives of inventory management is
financial forecasting for the year ahead. Knowing the financial resources which
will be required to manage inventory, surely gives that extra edge to the planning
exercise. It tones and braces the management in advance so that the provisions
for the future are based on the sound economic data of today. However, it is
accepted that such forecasting cannot consider the arrival of new drugs and
their inclusion in the inventory, extension of hospital facilities if any,
and unknown pressure
in the form of epidemics.
Often, the demand for increased allocation of financial resources
for purchasing drugs for the forthcoming year is seen with skewed eyes, due
to the limitation of economic resources and the pressing demands from other
hospital services. The application of CII incorporates the inflation factor,
thereby giving one additional justification for the increased claim for higher
allocation of the drug budget. Even though the inflation is not uniform in
all commodities, it reflects the general trend and therefore is relied upon
as an important index by the economic planners. The application of CII makes
sense as it proves that the increased expenditure on drugs is a result of the
all-pervasive inflation. For a developing country like India, such inflation
is going to be there till we achieve the status of a developed economy, when
the value for money (VFM) will be constant after the rupee gets stabilized.
Till then the medical store managers will do well to adapt to and adopt CII.
Even if the expensive innovative drugs may medically offer VFM, budget-sanctioning
authorities cannot afford the required Money for Value.18 Since
the inflation factor for future years cannot be known in advance, the prediction
of the drug expenditure can be done better by using regression analysis. The
justification for hiked budget allocation, based on such hard economic data,
reasons out the need scientifically and improves the chances of acceptance
of the claim for greater budgetary allocation for drugs.
Such economic analysis will go a long way in the efficient
management of the medical stores. It will help in policy framing, prioritization
and allocation of resources for vital and essential drug purchase.
Acknowledgments
We thank Ms Hetal Sampat, Chartered Accountant, for her free
professional services and financial analysis of our data.
References
- Kant S, Pandaw CS, Nath LM. A management technique for
effective management of medical store in hospitals. J Acad Hosp Adm 1996-1997;89:41-7.
- Pillans PI, Conry I, Gie BE. Drug cost containment at a
large teaching hospital. Pharmacoeconomics 1992;1:377-82.
- MacKenzie GB. Scientific inventory planning in materials
management. Hosp Mater Manage 1989;14:16-9.
- Laurila J, Suramo I, Brommels M, Tolppanen EM, Koivukangas
P, Lanning P, et al. Activity-based costing in radiology. Application
in a pediatric radiological unit. Acta Radiol 2000;41:189-95.
- Hughes TF. Objectives of an effective inventory control
system. Am J Hosp Pharm 1984;41:2078-85.
- Murphy J, Yemen S. Computer-assisted inventory control
utilizing ABC inventory analysis and EOQ in a hospital pharmacy. Can J
Hosp Pharm 1986;39:159-63.
- Ballentine R, Ravin RL, Gilbert JR. ABC inventory analysis
and economic order quantity concept in hospital pharmacy purchasing. Am
J Hosp Pharm 1976;33:552-5.
- Sadock J, Tolman ED. Capital equipment budgeting: changing
an art to a science. J Healthc Resour Manag 1997;15:16-21.
- Gopalakrishnan P, Sundaresan M. Material management - An
integrated approach. New Delhi: Prentice Hall of India Pvt Ltd; 1985.
- Ammer DS. Materials management and purchasing, 1st Indian
reprint, Bombay: D. B. Taraporevala Sons and Co. Pvt. Ltd.; 1982.
- Government of Maharashtra: Hospital administration manual.
Volume I, Revised June 1976, Urban Development Public Health and Housing
Department. Mumbai: Government of Maharashtra; 1976.
- Dhruv RA. Direct taxes ready recknoner. 16th ed. New Delhi:
Bharat Group of Concerns; 2002-03.
- Eisenberg JM. Clinical economics-A guide to economic analysis
of clinical practices: JAMA 1989;262:2879-86.
- Manoharan TN. Direct tax laws with tax planning aspects
2000-2001. 5th ed. Chennai: Sujatha Publications Private Limited; 1999.
- Thawani VR, Gharpure KJ, Shelgaonkar SD, Naik MS. Drug
expenditure trends in Government Medical College Hospital, Nagpur. J Acad
Hosp Admn 1998:10:43-7.
- Gupta S, Kant S. Hospital stores management-An integrated
approach. 1st ed. New Delhi: Jaypee Bros Medical Publishers Pvt Ltd; 2000.
- Gupta S, Kant S. Hospital stores management-An integrated
approach. 1st ed. New Delhi: Jaypee Bros Medical Publishers Pvt Ltd; 2000.
- Redwood H. Pharmaceutical cost containment and quality
care. Conflict or compromise? Pharmacoeconomics 1998;14:9-13.
Copyright 2004 - Medknow Publications on behalf of the Indian Pharmacological Society. Free, full-text articles
also available from http://www.ijp-online.com
The following images related to this document are available:
Photo images
[ph04005t1.jpg]
[ph04005f2.jpg]
[ph04005f1.jpg]
[ph04005t2.jpg]
|
